x
LIST OF FIGURES
FIGURE NO. TITLE PAGE
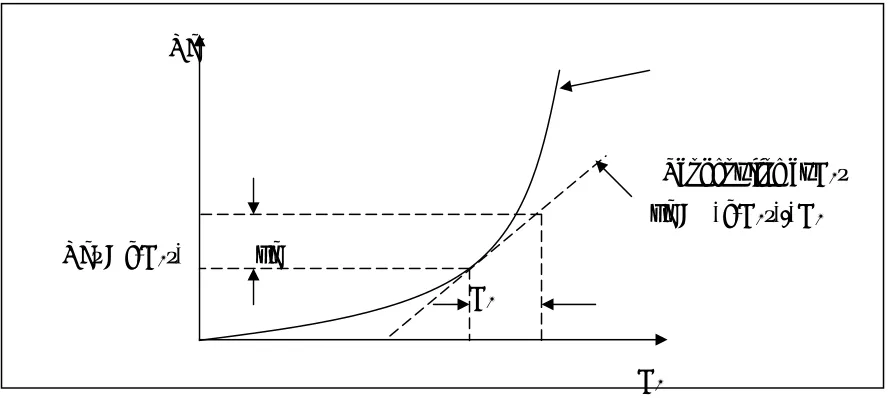
2.1 Sugeno type fuzzy logic controller 7
2.2 The horizontal tank 8
2.3 Step response and control signal of the three controller 10 3.1 Sequence of PID and FLC implementation on CE 105 13
3.2 Single tank system 14
3.3 Linearization of the liquid level operating system 16
3.4 Schematic diagram of the couple tank system 19 3.5 The schematic functional detail of CE 105 20 3.6 Schematic Diagram of the overall system 22 3.7 Pump and Level Sensor Characteristic 23 3.8 Schematic Diagram of the overall system 24 3.9 CE 105, personal computer and data acquisition hardware 25 3.10 Block diagram for open loop system with compact
DAQ interfacing 26
3.11 Block Diagram of PID and Fuzzy Logic control for
closed loop system with compact DAQ interfacing 27 3.12 Block diagram of PID controller 29 3.13 PID controller block diagram of system representation 30 3.14 Block diagram representation of the closed loop system 31
3.15 System representation 34
xi
3.18 Fuzzy Logic controller of system representation 38 3.19 Input membership functions for the fuzzy tank
level controller 39
3.20 Output membership functions for the fuzzy tank
level controller 40
3.21 Resolution of input 41
3.22 Resolution of output 42
3.23 References graph to gain G and time constant determination 43 3.24 Graphical user interface for open loop test 44 3.25 Block diagram using LabVIEW for system
dynamic characteristic 45
3.26 Transient response specification 45 3.27 Hardware connection between DAQ and couple tank system47 3.28 LabVIEW 8.6 programming and interfacing 48 3.29 Real time implementation on the couple tank system
with data acquisition 49
3.30 GUI for PID Controller 50
4.1 flow rate against pump supply voltage 53 4.2 Graph Pump Supply against Flow rate 55 4.3 Graph Pump Supply (V) against Liquid Level (mm) 56 4.4 Block Diagram for Open Loop Step Response Measurement58
4.5 Output response of open loop control 59 4.6 Graph for Open Loop Step Response Method 59
4.7 Ziegler Nichol’s second method 61 4.8 Level (mm) against Time (sec) for the Single Tank
System by Ziegler Nichol's Method: kp=4.545 ki=0.046 62 4.9 Simulink block of the system and PID controller 63 4.10 Level process response from simulation with P controller 64
4.11 Graph for tuning with the kp=5 65
4.12 Graph for tuning with the different value of
xii
4.13 Level process response from simulation with PI controller 67
4.14 Graph for tuning with the kp=5, ki=0.5 68 4.15 Graph for tuning with the different value of PI gain 68
4.16 Level process response from simulation with PD controller 70
4.17 Graph for tuning with the kp=6, kd=0.1 71
4.18 Graph for PD controller 71
4.19 Level process response from simulation with PID controller 73
4.20 Graph for tuning with the kp=5, ki=0.5, ki=0.001 74 4.21 Level process response from on line with P, PI
and PID controller 74
4.22 Simulink block of the system and Fuzzy Logic controller 78 4.23 Level process response from simulation with
Fuzzy Logic controller 78
ix
LIST OF TABLES
TABLE NO. TITLE PAGE
3.1 Specification of couple tank system 20 4.1 Comparison between simulation and experiment result
for proportional controller 65
4.2 The value of proportional gain and actual level on the tank 66 4.3 Comparison between simulation and experiment result
for proportional integral controller 69 4.4 Comparison between simulation and experiment result
for proportional derivative controller 72 4.5 Comparison between simulation and experiment result
for proportional integral derivative controller 74 4.6 Comparison of P, PI and PID base on time delay,
settling time and % overshoot 76
4.7 Comparison between calculation, simulation and
1
CHAPTER 1
INTRODUCTION
1.1 Project background
In many industries process such as petro chemical industries, paper making industries and water treatment industries are using the tank system to control the liquid level. The liquid level must be controlled by the proper controller. The objective of the controller in the level control is to maintain a level set point at a given value and be able to accept new set point. The conventional proportional- integral- derivative (PID) is commonly utilized in controlling the level. On the other hand, the fuzzy logic controller (FLC) is also popularly implemented in many practical industries application.
2
1.2Problem Statement
The control of liquid level in tanks and flow between tanks is a basic problem in the process industries. The process industries require liquids to be pumped, stored in tanks, then pump to another tank. Many times the liquids will be processed by chemical or mixing treatment in the tanks, but always the level of liquid in the tanks must be controlled, and the flow of the tank must be regulated.
Level and flow control in tanks are at the heart of all chemical engineering systems. But chemical engineering system are also at the heart of our economies. Vital industries where liquid and flow control are essential include petro chemical industries, paper making industries and water treatment industries.
Our lives are governed by level and flow control system. The water closet (WC) toilet in our house is also a liquid level control system. The swinging arm attached to the input valve of the WC water tank allows water to flow into tank until the float rises to a point that closes the valve.
There are many alternative controller design theories that can be used to control the level of liquid on tanks. Proportional integral derivative control is one of a kind of control strategies that uses to control the level and flow of liquid. Proportional control, PI control, PD control and PID control will be investigate to determine which controller is the best for liquid level control.
Even though the PID controller is widely used in industrial process, the tuning of PID parameter is a crucial issue in particular for the system’s characteristic which has large time delay and high order system [Underwood, 2000]. Commonly in industrial process, only an expert or experience workers are able to monitor and tune the PID parameters based on their experience.
3
1.3Objectives
The objectives of the project are as followings:
1. To develop the real time control (PID and FLC) on the Tank Apparatus (CE 105) by graphical environment using Laboratory Virtual Instrument Engineering Work bench (LabVIEW) language.
2. To investigate the performance of P, PI, PD and PID controller in control of tank system.
3. To propose the Fuzzy Logic Controller in control of tank system.
1.4 Scope of the project
The scopes of the project are as followings:
1. Study the characteristic of Tank Apparatus (CE 105).
2. Hardware setup between Couple Tank, Data Acquisition Card and personal computer.
3. Study on Fuzzy Logic controller toolbox.
4
1.5Thesis outline
This thesis is organized in six chapters. The first chapter gives an overview of the project that gives the introduction of control system. It consists of project background, objective, and scope.
Chapter two covers literature review which included the controller used to control of pump running. Some brief explanation on the results obtained.
Chapter three covers the flow of methodology and description of each procedure. The details of the implementation of software and hardware are discussed. It also consists of theory of controller implementation.
Chapter four focus on the result, analysis and discussion of this project.
5
CHAPTER 2
LITERATURE REVIEW
2.1 Overview
6
2.2 Related Works
In the previous years, there are many control strategy approaches for controllers design of liquid level control system such as robus PID controller [Masato Kahara et. Al, 2001], Fuzzy-PD control, Cascade control, Multiple Model Predictive Control [Ming He et. Al, 2005] and advance PID auto tuner [Qiang Bi et. Al, 2000]. For example, [Satean Tunyasrirut et. Al, 2007] proposed a Fuzzy Logic Controller and Cascade Controller which can control the liquid level in horizontal tank. Another example is a Generalized Predictive Control for control the level water in couple tank developed by Ahmad ‘Athif bin Mohd Faudzi [Ahmad ‘Athif et. Al, 2006].
In some cases, an artificial intelligent approach such as Fuzzy Logic Control (FLC) has gain interest in control system design. For example, [Pornjit Pratumsuwan et. Al, 2009] proposed a Fuzzy Logic Control to control the electro hydraulic system. This hardware was used as a equipment in laboratory for student experiment tasks. This project also used PID controller. Finally, student will see the different between PID and FLC performance. For PID tuned, they used Ziegler Nichols method and trial and error. Fuzzy Logic Control has superior performance compared to a PID controller.
2.3 Fuzzy based using SCADA
7
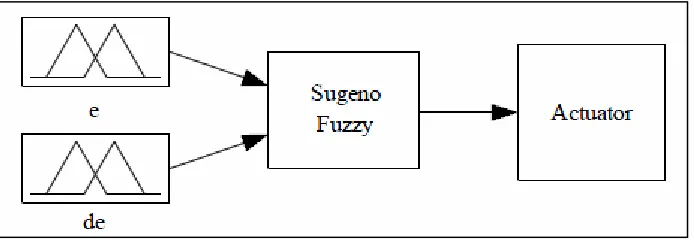
Figure 2.1: Sugeno type fuzzy controller
As shown in figure 2.1, this fuzzy logic controller has two input variables; e(t) is the error which is the difference between set value and process value and de(t)dt is the differential of e(t) and an output variable which is the control signal of the actuator. Linear type output membership functions have been used in fuzzy rule base which has four fuzzy rules.
The function of the SCADA in this research is for monitoring element. A SCADA system has been composed for monitoring the liquid level in the tank and position of the actuator valve. It is possible to observe the time variations of the level water and position of the actuator valve.
8
2.4 PID, fuzzy and cascade controller
Satean Tunyasarirut and Santi Wangnippranto proposed concept of PID, fuzzy logic and cascade controller to control the liquid level in horizontal tank. The user can control the liquid level using three types of controller. The cylindrical horizontal tank has diameter 300 mm and 480 mm long. The interface card module PCI 6024E and LabVIEW software program is used for build the cascade controller.
Cascade control can be used for improved disturbance rejection when there are several measurement signals and one control variable. Cascade control is build up by two controller loop. The inner loop is called the secondary loop that using the PID controller. The outer loop is called the primary loop that using the fuzzy logic controller. This research consists of computer, interface card, level transmitter, and linear control valve.
Figure2.2: The horizontal tank model
9
The fuzzy logic controller was builds in the LabVIEW program. The input of fuzzy logic controller is the level error between the actual level and target level of the level in horizontal tank. Fuzzy logic controller part consists of fuzzification, control rule and defuzzification. Membership function editor is used for expressing input and output variables.
From this research, the conclusion has been made which is the response time of the cascade controller less than single loop or fuzzy logic control. Both of controllers give the smallest state error and also can see that the interrupt load can effect all the controller.
2.5 Neuro- fuzzy controller by genetic algorithms
The title of this research is tuning of a neuro- fuzzy controller by genetic algorithms (NFCGA) with an application to a couple tank liquid level control system was finished by Seng Teo Lian, Khalid Marzuki and Yusof Rubiah. This paper has proposed a method for a automatic tuning of a fuzzy logic controller which is based on the RBF neural network using genetic algorithm (GA). It is named NFCGA. The NFCGA is then applied to a noisy couple tank liquid level.
A linear mapping method is used in this project to encode the GA chromosome, which consists of the width and center of the membership function, and also the weights of the controller. Dynamic crossover and mutation probabilistic rates are also applied for faster convergence of the GA evolution.
10
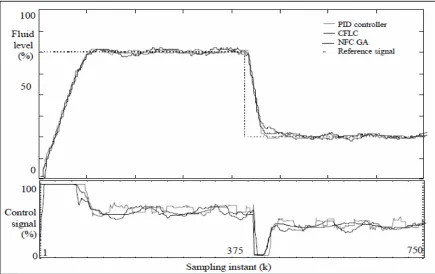
Figure 2.3: Step responses and control signals of the three controllers
11
2.6 Summary
The controller of controlling the liquid level in the tank system can be generalized in many ways. Zafer Aydogmus have shown that the SCADA control via PLC is designed for monitoring and control the liquid level and valve position. The sugeno fuzzy type has been selected as the best algorithm for this research. While, Satean Tunyasarirut and Santi Wangnippranto using PID, FLC and cascade controller. As a result cascade controller produces the less response time compared to others. Last but not least, neuro fuzzy controller by genetic algorithm proposed by Seng Teo Lian from Universiti Teknologi Malaysia. This research activated the plant using three types of controller which is PID, Fuzzy and NFLGA. As a result the control signal from the NFLGA is smoother than others.
12
CHAPTER 3
METHODOLOGY
3.1 Overview
The focus of this chapter is to provide further details of methodology and approaches to completing this research. The CE 105 Couple Tank System which is available in Instrumentation and Measurement Laboratory, FKEE, UTHM. CE 105 will be use as model to implement the PID and FLC. The process plant, data acquisition card and the LabVIEW software will be discuses for its implementation.
13
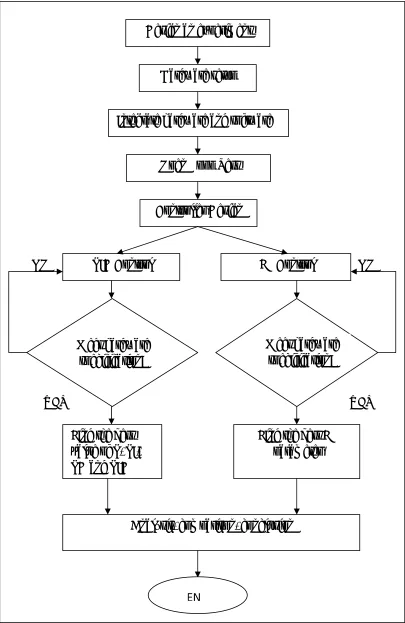
Design an experiment
Hardware setup
Integrate hardware and software
Open Loop Test
NO NO PID Control
YES
Meet hardware specification?
FL Control
Meet hardware specification? Controller Design
YES
Find the best value of P, PI, PD and PID
Find the best FL parameter
Analysis, comparison, conclusion
[image:17.612.159.564.51.674.2]EN
14
3.2 Modeling the Single Tank System
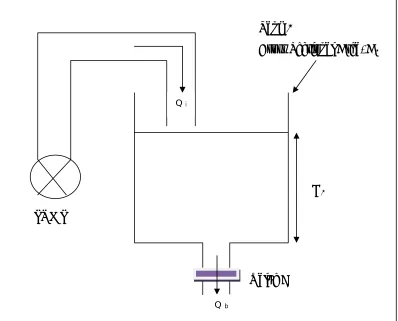
Initially, consider the couple tanks with valve A closed and valve B open. This system is a single tank process that can be drawn as shown in figure 3.2.
H1 pump
valve Valve B B
H1
PUMP
Q b Q i
[image:18.612.115.513.213.534.2]Cross Sectional Area, A1 Tank 1
Figure 3.2: Single Tank System
The system model is determined by relating the flow into the tank to that leaving via valve B [Couple tank system CE 105 manual].
Hence,
Qi – Qb = rate of change of liquid level volume
Qi – Qb = dt dV1
= A dt dH1
15
Where,
A = cross sectional area of tank 1
V1= volume of liquid in tank 1 (V1 = A.H1) Q i = pump flow rate
Q b = flow rate out of valve B
If valve B is assumed to behave like a standard sharp edged orifice, then the flow through valve B will be related to the fluid level in the tank, H1, by the expression,
1 b
db
b C .a. 2g.H
Q = (3.2)
Where,
ab= cross sectional area of the orifice. Represents the dimensions of valve B and the flow channel in which it is mounted. Because this dimension changes along the length of the channel, ab would have to be taken to be the mean value.
cdb= discharge coefficient of valve B. This coefficient takes into account all liquid characteristics, losses and irregularities in the system such that two sides of the equation balance.
g= gravitational constant = 0.98 m/sec2
The orifice relationship (3.2) assumes Cdb is a constant and, therefore, that Qb is proportional to the square root of the level H1 for all possible operating condition. In a practical valve the flow rate Qb will be some general non linear function of level H1.
16
Combining equation 3.1 and 3.3 gives,
dt dH
A. 1 + f(H1)=Qi (3.4)
Equation 3.4 is the mathematical model that describes the system behaviour.
The system model, equation 3.4 is a first order differential equation relating input flow rate Qi, to the output water level, H1. In order to make it useful for control systems purposes it must be linear equation by considering small variations about a desired operating level of liquid in the tank.
Qb
Tangent line at H1’ qb = δf(H1’)/δH1 Qb’ = f(H1’) qb
H1
[image:20.612.113.558.298.497.2]H1
Figure 3.3: Linearization of the liquid level operating system
Let, H1 = H1’ + h1
17
Let the inflow Qi consist of a steady component Qi’ plus a small change qi, then if Qb’ is the steady state outflow corresponding to h1, then we can rewrite equation 3.4 as:
dt dh
A. i+Q'b+qb=Q'i+qi (3.5)
Which can be rewritten, with reference to figure 3.3 as,
dt dh
A. 1+f(H'1)+h1.D=Q'i+qi (3.6)
Where the coefficient is the slope of the valve characteristics at the level H1’
1 1
δH ) δf(H'
D= (3.7)
When the level is constant, with qi=0 and h1=0, then equation 3.5(b) gives the steady state relation for flow and level,
f(H1’) =Qi’ (3.8)
Subtracting equation 3.8 from equation 3.5 and then rearranging gives the linear, first order differential equation for the single tank system,
dt dh
A. 1 + h1.D=qi (3.9)
Given,
kb = D-1 = 1/D
D = 1/kb
18
) dt dh
(T.D 1 + i b 1 .
1 q
k
h = (3.10)
) dt dh kb
1
(T. 1 + i
b 1 .
1 q
k
h = (3.11)
) dt dh [(T. kb 1 1
+ h1]=qi (3.12)
dt dh
T. 1 + h1 .=kbqi (3.13)
Taking Laplace transforms gives the single tank system transfer function,
[T.sh1] + h1 = kb.qi h1 [Ts + 1] = kb.qi
= (s) h1 1 Ts kb
+ .qi(s) (3.14)
where, T is the Time Constant of the system given by,
T = A/D and kb is given by,
Kb = D-1
Where;
19
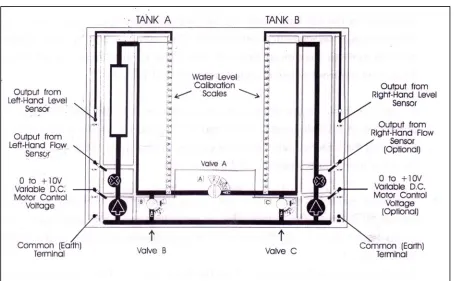
3.2.1 System Description of Couple Tank System
[image:23.612.116.399.277.531.2]In this research, couple tank apparatus CE105 is used as a plant system. This plant developed by the TQ Education and Training Ltd, 2001. The schematic diagram of the couple tank system is shown in figure 3.4. This system has two types of transducers which are pressure sensing liquid level and flow transducer. The specifications of the couple tank system as shown in table 3.1.
Figure 3.4: Schematic diagram of the Couple Tank System
20
Table 3.1: Specification of Couple Tank System
Tank 1 Cross Sectional Area = 9350 mm2 Tank 2 Cross Sectional Area = 9350 mm2 Valve A,B,C 10 mm Valve Orifice
Cross Sectional Area = 78.5 mm2 Liquid Level Sensors 0 to 10 V DC Output
Corresponding to 0 to 250 mm
As indicated on the front panel water level scales
Pump Flow Sensors 0 to 10 VDC Output
Corresponding to 0 to 4400 mm
[image:24.612.105.559.398.679.2]As indicated on the front panel flow meter
21
Figure 3.5 shows the schematic functional detail of the unit as well as providing quick and easy access. The three rotary valves mounted on the front panel of the CE 105 enable the flow characteristic of the system to be varies as required. Valve B and C provide direct discharge into the reservoir below from the left and right hand tanks respectively. Valve A may be used to vary the coupling between the two tanks. In all cases, the scales adjacent to each valve indicate the relative discharge rate. (0 being closed and 5 being open).
An overflow channel is included at the top of each tank. Each tank is fitted with a pressure sensing liquid level transducer. The output from the pump is sensed by an in line flow transducer of the variable reluctance type.
The top unit of the CE 105 contains the mains supply unit connector and the AC to DC rectification circuit. These are mounted in a sealed die-cast box designed to prevent water from entering. This ensures that, the user isolated from potentially dangerous voltage levels.
The motor drive and transducer signal conditioning circuit (flow and level) are also located in the top unit of the CE 105. Electrical connections between the individual transducers, the pump drive circuit and the top unit are made with the relevant plugs and sockets being correctly fitted at the time of installation.
The manipulated input can be set manually to simulate the PC from 0 to 10 Volt output. If the manipulated variable (level transducer) is connect to the manipulated input (pump voltage), the feedback signal will acquire the output from the pressure sensing liquid level transducer.
22
3.2.2 Transfer Function of the CE 105 System: Single Tank System
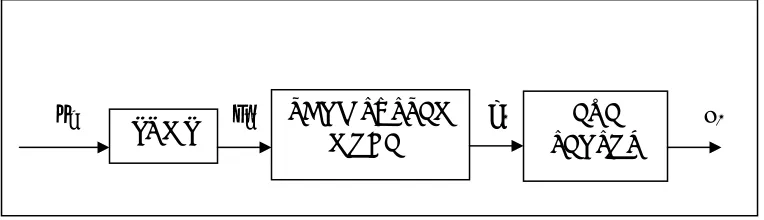
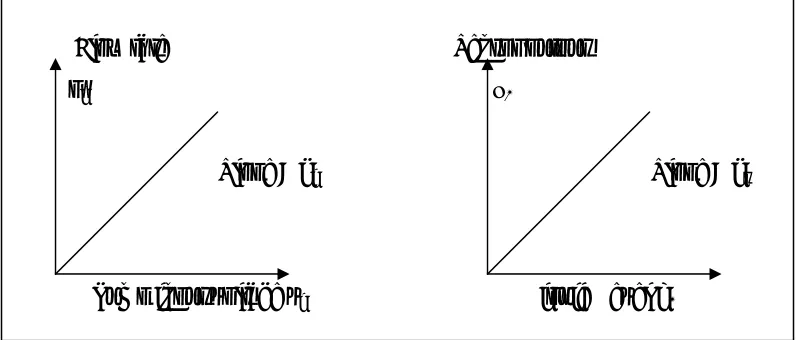
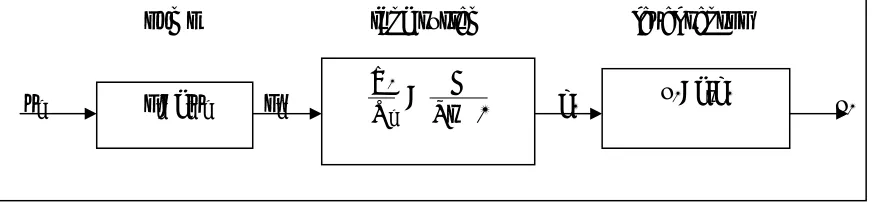
The couple tank is used as a control system, the input flowrate (qi) is controlled by adjusting the applied voltage to the pump motor amplifier (vi). The liquid level is sensed by a pressure transducer that produces an output voltage (y1), which is proportional to the liquid level (h1). The overall system represent schematically in figure 3.6.
[image:26.612.122.504.248.358.2]vi qi h1 y1 PUMP TANK SYSTEM MODEL SENSOR LEVEL
Figure 3.6: Schematic Diagram of the overall system
Where;
vi = applied voltage to the pump motor amplifier qi= input flow rate
h1= liquid level y1=output voltage
23
Flow rate Sensor output qi y1
Slope = ki Slope = ks
[image:27.612.113.515.74.244.2]Pump input voltage vi Liquid Level h1
Figure 3.7: Pump and Level Sensor Characteristic Figure 3.7: Pump and Level Sensor Characteristic
If Ki and Ks are the pump and sensor gain constants respectively, then, If Ki and Ks are the pump and sensor gain constants respectively, then,
qi = ki . vi (3.15) qi = ki . vi (3.15)
y1= ks . h1 (3.16) y1= ks . h1 (3.16)
1 Ts
kb
+ .qi(s) (3.17)
(s) h1(s)= =
h1
Equation 3.17 can takes from the modeling of tank system.Combined these with the system transfer function equation gives the standard first order system transfer function, i 1 V Y = 1 Ts G
+ (3.18)
G = ki.ks.kb (3.19) Where,
G = the system gain
24
pump tank system level sensor
vi qi h1 y1
[image:28.612.114.551.67.168.2]
Figure 3.8: Schematic Diagram of the overall system Figure 3.8: Schematic Diagram of the overall system
Figure 3.8 shows the overall diagram of the tank system. Finally, the experimental result of open loop test will be use to obtain transfer function of the single tank system. The gain and time constant can be taken from the output response of the open loop result.
Figure 3.8 shows the overall diagram of the tank system. Finally, the experimental result of open loop test will be use to obtain transfer function of the single tank system. The gain and time constant can be taken from the output response of the open loop result.
3.2.3 Experimental Setup
The plant CE 105, data acquisition hardware and personal computer are connected as shown in figure 3.19 and evaluated as t o whether everything is in working condition. The experiment consists of a pump inside the couple tank, with pressure sensing liquid level and flow meter. The range of the pump is 0 to 10 V and also same with level sensor and flow rate sensor. Pressure sensing liquid level is located in the tank.
The NI 9263 and NI 9201 developed by National Instrument is used to read and write data to and from the CE 105. From figure 3.9, both analog input and analog output will directly connect to the CE 105 plant using Compact Data Acquisition.
qi=kivi i
1
Y V =
G y
1=ksh1 1