Journal of Chemical and Pharmaceutical Research, 2013, 5(12):270-274
Research Article
CODEN(USA) : JCPRC5
ISSN : 0975-7384
Multi-functional area design and simulation in the dangerous
pharmaceutical enterprise
Yin Jing, Chen Nan and Meng xiangying
School of Mechanical-electronic and Automobile Engineering, Beijing Engineering Research Center of Monitoring for Construction Safety, Beijing University of Civil Engineering and Architecture, Beijing, China
____________________________________________________________________________________________
ABSTRACT
Focus on the dangerous pharmaceutical logistics center which integrate the function of production, logistics and marketing, the multi-functional area planning and design is taken into consideration in the paper. Based on the operation workflow description and quantity analysis, the plane layout and the spatial distribution are illustrated. Combined with the dynamic simulation on the platform of Flexsim, the relevant performance data is provided and the running effect can be seen at last.
Keywords: Dangerous pharmacy; Multi-functional area; Planning and design; Dynamic simulation; Flexsim ____________________________________________________________________________________________
INTRODUCTION
The chemical and pharmaceutical industry plays an important role in the people’s livelihood which has developed rapidly in recent years. With fierce competition, many large-scale enterprises start to seek new effective operation mode and the comprehensive logistics center has been built up which integrates multiple functions of production, warehousing, packing and sales. Because of the more complex logistics structure presented and the special requirements for dangerous goods in the enterprises, it becomes crucial to make the efficient area planning and design that can contribute to reduce logistic costs and improve the working efficiency.
Since the Systematic Layout Planning method (SLP) is proposed, it has been applied to solving the problems of facility Layout design in practical[1]-[2]. At present, dynamic simulation technology is combined with SLP to do design and planning, by which more scientific and optimal scheme can be obtained[3]-[4]. In the paper, the problem of area planning in the logistics center is concerned, which has following characteristics:
(1)The planning object is a two-layer building in which multiple functions should be done, including production, warehousing, results and discussion, packing and sales and etc.
(2)With the background of chemical and pharmaceutical enterprises, the special requirements for dangerous goods are taken into consideration.
EXPERIMENTAL SECTION
1 LOGISTICS WORKFLOW ANALYSIS
Figure 1.The operation workflow
2 LOGISTIC CONDICTION ANALYSIS
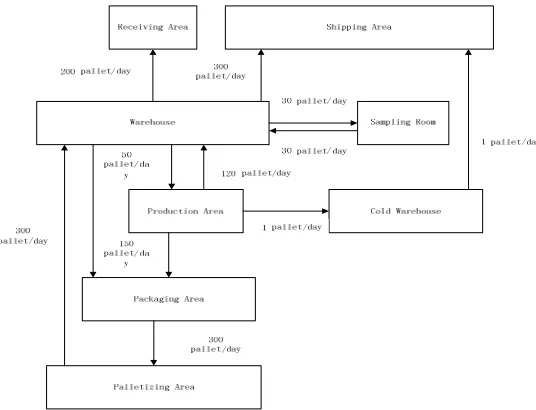
In the logistics center, the logistic structure and quantity every day is shown in figure 2.
Figure 2. The logistic structure and quantity
3 Logistics relationship analysis
[image:2.595.135.480.636.726.2]There are eight kinds of area in the system, including receiving and shipping area, common warehouse, cold warehouse, sampling room, production area, packaging area and palletizing area, which represented by 1-7 respectively. On the basis of workflow analysis and the logistics data, the logistics intensity is calculated in table 2.
Table 2.The logistics intensity
Number Area 1 Area 2 Throughput(pallet/day) Throughput Proportion(%) Grade
1 1 2 500 33.7 A
2 6 7 300 20.2 E
3 2 7 300 20.2 I
4 2 5 170 11.5 O
5 2 6 150 10.1 U
6 2 4 60 4.1 U
7 1 3 1 0.1 U
4. Non-logistics relationship analysis
In the pharmaceutical enterprise, some special pharmaceutical rules must be paid much attention, as follows: (1)The requirement for clean extent of different functional areas is different;
(2)The forklift and operator can be shared between different areas; (3)There is no flammable risk between the two areas.
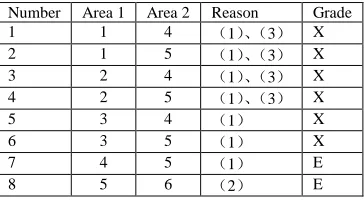
[image:3.595.216.398.202.302.2]The non-logistics intensity is shown in table 3. It's worth noting that the production area and sampling room are in concentrated areas of chemical drug and it’s better to set aside the aisle and window area, in order to keep the area of ventilation.
Table 3.The non-logistics intensity
Number Area 1 Area 2 Reason Grade
1 1 4 (1)、(3) X
2 1 5 (1)、(3) X
3 2 4 (1)、(3) X
4 2 5 (1)、(3) X
5 3 4 (1) X
6 3 5 (1) X
7 4 5 (1) E
8 5 6 (2) E
[image:3.595.83.532.358.527.2]The weight of logistics factor and non-logistics factor is set in the ratio of 2:1, the table of comprehensive relationship is shown in table 4.
Table 4.The comprehensive relationship
Affinity Degree on different Areas
Number Area 1 Area 2 Logistics Factor(Weight:2) Non-logistics Factor(Weight:1) Comprehensive Relationship
Grade Mark Grade Mark Mark Grade
1 1 2 A 4 8 A
2 6 7 E 3 6 E
3 2 7 I 2 4 I
4 4 5 E 3 3 O
5 5 6 E 3 3 O
6 2 5 O 1 X -1 1 U
7 1 3 U 0 0 U
8 2 6 U 0 0 U
9 2 4 U 0 X -1 -1 X
10 3 5 U 0 X -1 -1 X
11 3 4 X -1 -1 X
12 1 4 X -1 -1 X
13 1 5 X -1 -1 X
RESULTS AND DISCUSSION
PLANE DESIGN
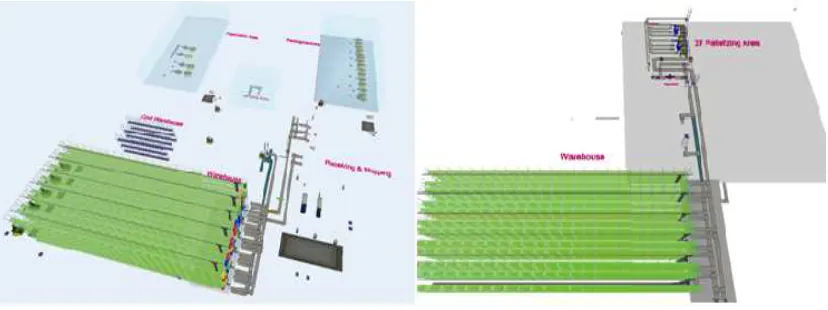
Considering the comprehensive relationship among functional areas, the 1F Layout and the 2F Layout are shown in figure 3. The 1F layout includes receiving and shipping area, warehouse, cold warehouse, production area, packaging area and sampling room. For convenience, warehouse and palletizing area are placed on 2F.
[image:3.595.107.506.611.742.2]DYNAMIC SIMULATION
By using the Flexsim simulation software, the layout designed above could be displayed through 3D dynamic perspective drawing, as shown in figure 4. The logistics costs and functional areas efficiency could also be obtained through simulation data analysis.
Figure 4.The model of 1F & 2F Layout
The statistical result is derived from simulation model running 86400 seconds (24hours), as shown in table 5. The key entity state is listed in the table, including:
(1) 6 stackers in the warehouse handling 1200pallet/day approximately; (2) 8 trucks arrived and receiving 200pallet/day totally;
(3)13 shipping trucks, a total of 305pallet/day; (4)300pallet/day processed by sampling room.
[image:4.595.100.514.129.284.2]In addition, because of the upper limit of receiving and shipping content is 80pallet, the real-time condition of this area needs to be paid more attention. By figure 7 we can see that this area capacity can well meet the requirement.
Table 5.The state report table
Flexsim Summary Report Time: 86400
Object Content Max Input Output Min
Staytime Max Staytime Avg Staytime
ASRSvehicle_subway1 1 202 202 16.243494 32.25222 23.305
ASRSvehicle_subway2 1 198 198 16.236004 33.31562 23.53
ASRSvehicle_subway3 1 197 197 16.201269 32.34959 23.334
ASRSvehicle_subway4 1 195 195 16.261156 32.34408 23.396
ASRSvehicle_subway5 1 193 193 16.193544 32.24847 23.369
ASRSvehicle_subway6 1 190 190 16.260389 32.2843 23.284
Queue_carbuffer149 1 21 21 0 0 0
Queue_car151 1 4 4 2372.248779 5073.441 3947.9
Queue_car156 1 4 4 800.297668 4692.25 3719.3
Conveyor_sample1out 1 30 30 79.464287 1082.622 170.88
Queue54 6 300 300 34.953434 807.9227 115.16
C_rack87 5 5 5 2790.882568 3475.253 3042
CONCLUSION
In this paper, the integration logistics center of chemical and pharmaceutical enterprises is taken into consideration. Combined with dynamic simulation technology, the multi-function area design and planning are realized. First, by the quantitative analysis of the logistics and non-logistics relationship, the comprehensive relationship between functional areas is obtained. On this basis, the static layout is proposed and the dynamic simulation is realized on the platform of Flexsim. Finally, by simulated running, the statistical performance data can be gathered and the effect of design scheme can be verified.
Acknowledgements
We are grateful to Beijing University of Civil Engineering and Architecture and Beijing Engineering Research Center of Monitoring for Construction Safety for providing research facilities.
REFERENCES
[1] Li Qin, Li Ze-rong, Wen Zhong-bo.Coal Mine Machinery, 2011, 5.
[2] Yong Luo. GuoQuan Cheng. Logistics Technology, 2005, 9.
[3] JianYong Si. The distribution center facilities planning and its simulation research master’s thesis [D]. Hang Zhou: Zhe Jiang University, 2006.