Nuclear Magnetic Resonance Relaxometry and
Thermoelectrodynamic Spectroscopy Study of Heat
Accumulating/Emitting Salt CaCl
2
⋅
6H
2
O
Kashaev R.S.-H.
Каzan State Power Engineering University,420107, Kazan, Esperanto, 62-29 *Corresponding Author: [email protected]
Copyright © 2014 Horizon Research Publishing All rights reserved.
Abstract
Using nuclear magnetic resonance relaxometry and thermoelectric dynamical methods studied phase transitions and electric power generation properties of hydrate salt CaCl2⋅6H2O. It can be used as a phase-changingmaterials (PCM) for heat accumulating/emitting thermal electric energy storage. For studies of phase transitions temperature and time dependences on protons was used Portable Relaxometer NMR NP-2 on resonance frequency νо = 14,5МГц. Was received data on structure-dynamical NMR-parameters, determining phase transition properties of salt.
Keywords
Nuclear Magnetic Resonance Relaxometry, Thermoelectrodynamic spectroscopy, Phase Transitions1. Introduction
Direct electric energy production using thermoelectric Seebeck effect in new renewal electric energy sources is of great technology relevance. Use of phase transitions(PT) in phase-changing materials has high perspectives. But the discovery of PT mechanism is one of the great physic problems [1]. Solution of it gives an opportunity for use of ambient temperature changes during 24 hours, especially in deserts and regions with sharp continental climate. At present time such materials, named thermal energy storage
systems, are widely used in air conditioning systems for their benefits on energy conservation [2].Phase transitions in hydrated salts and paraffins due to their low temperatures of PT [3] can also be used for power generation - transformation of heat of fusion/crystallization in electric current power as a most convenient form of energy. For this purpose can be used the thermoelectric Seebek effect of electricity production using temperature overfall during the process of PT at heating and cooling.[4].But phase transitions are not studied completely and is a complicated phenomena and by Noble laureate V.L.Ginsburg are put on the seventh place among problems, needed to be solved [1].
2. Samples, Apparatus and Methods
For study were used hydrated salts: CaCl2⋅6H2O,
Na2SO4⋅10H2O, Na2S2⋅5H2O, CH3COONa⋅3H2O. Their
phys-chemical properties–temperatures of melting TmeltoC,
heat of melting, Qm (kJ/mol) and density ρ (kg/m3), taken
from [2,3], are presented in Table 1.
As it is seen from the table, essential dispersion of the parameters obtained by different authors is observed. In our opinion the reason of such data dispersion is the complex form of PT in this TES. The aim of this work – is the study and attempt of understanding by two experimental methods (NMR and thermoelectric dynamical spectroscopy) the peculiarities of phase transitions in CaCl2⋅6H2O.
Table 1
Salt Tmelt(oC) Qm(kJ/mol) ρ (kg/m3)
CaCl2⋅6H2OFSP 42-0006- (pharm) 29,7 [3]; 29,2; 29,7; 30 [2] 170[3]; 190,8; 171; 174,4;192 [2] 1562 (38.7
oC);
1802 (solid); 1710 (solid) [2]
Na2S2⋅5H2O
GOST 27068-86 48; 48-49[2] 48 [3]; 210 [3];201; 209.3 ; 187 [2] 1600[3]; 1600 (solid); 1666; 1662 [2]
CH3COONa⋅3H2O 58,2 [2] 260 [2] 1450 [2]
NMR-Relaxation Parameters Measurements
Measurements of NMR-relaxation structure-dynamical parameters (SDP): spin-lattice T1i, spin-spin T2i relaxation
times and corresponding to them proton phases populations P1,2iwere realized on the Portable Relaxometer NMR NP-2
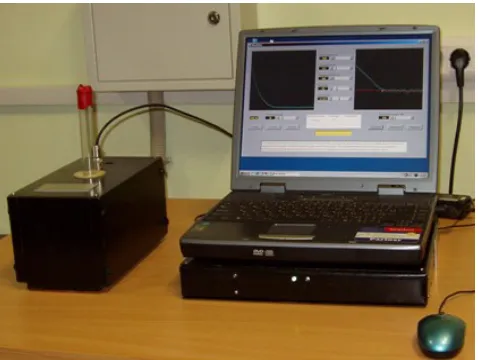
(designed and produced by CBRC, Kazan, Republic of Tatarstan, RF) and presented at fig.1 [5] at resonance frequency νо= 14,5 МHz.
Magnetic field is formed by NdFeB permanent magnet with field inhomogeneity δH< 5⋅10-4equiped with adjustable
[image:2.595.314.552.239.396.2]NMR probe-head ∅30 mm. Temperature of samples were changed and maintained with accuracy ± 0,2 о by thermo stabilization device, described in Patent of RF [6].
Figure 1. Portable Relaxometer NMR NP-2
Spin-lattice T1irelaxation times were determined using
spin-echo recovery sequence 90-τ-90о-τ
0-180оof Hahn [7].
Measurement parameters were: pulses repetition delay time T = 9 s, number of pulses steps N = 100 with a stepτ=3 ms,
τ0- 200 µs, number of accumulations n = 3.For spin-spin
T2irelaxation times measurements 90о-τ- (1800-2τ-)N sequence of Carr-Purcell-Meiboom-Gill [8] was used, eliminating influence of self-diffusion and protons exchange. T2iwere measured with delay time T = 9 s, number of 1800
pulses N = 900, intervalτ between 1800pulses–200 µs,
number of accumulations n = 10.
Main instrumental error was: γо = ± 1,44 %.Experimental error of relaxation times measurements: for ±3÷4 % and±2 %for NMR-signal amplitudes recurrence, depending from accumulations number n, so error could be reduced (n)1/2 times using n accumulations. Sample probe head has ∅30 mm, so the sample volume V for probe filling height h = 35 mm was V = 25 cm3, large enough for sample
representation. Coefficient of sensibility К = ν2V [МHz2сm3]
in used NMR-relax meter is К = 4150 МHz2сm3, that is close
to К = 1600-6400МHz2сm3of “Minispec pc120” (Bruker,
Germany).
Spin-echo amplitudes Ае envelopes dependences in Hahn and CPMG-methods (presented as curves on computer monitor at fig.2 a,b) after amplitude detection had forms,
which can be described by equations:
Aе = 1 - ∑A1iexp (-t/T1i) (1)
i = A ,B,C
Ае = ∑А2iexp (-t/T2i) (2)
i = A ,B,C
where А1i and А2i (in arbitrary units) correspond to initial
amplitudes of proton and B phases of different types of water protons motions which determine relaxation times T1i and T2i.
[image:2.595.60.299.247.427.2]From measured spin-echo amplitudes data logarithms were taken, and the curves were decomposed on three linear components, corresponding to T1,2A and T1,2B.
Figure 2. Decomposition of the polyexponential envelope of the spin-echo
signals into three Lorenz exponentials with their T1i relaxation times and
proton populations.
Term “proton phase” does not correspond to aggregate state, but to protons with relaxation, caused by dipole-dipole interactions in different states and environment.
For sufficient number of experimental points (more, than 100), reverse Laplace transformation (L-1) can be used and
the time dependence of signal (Ае = ∑А2iexp (-t/T2i)) can be
transformed in delta-function δ(t-T2i) i.e. function of
T2iappearence probability [9] using CONTIN, DASHA,
UPEN programs. So the relaxation times distribution can be determined. However, the demand of noise low level S/N< 100 to avoid displacements of T1,2i values and distortions of
weight coefficients is difficult to fulfill. Such level of S/N is a usual case in experiment. At S/N = 10 useL-1
transformation will give error in 20% [10]. At the same time relaxation function can be approximated by the sum of exponents if T1,2i difference is large enough [11]. It is really
so in our case, and for relaxation times determination we used graph-analytical method of spin-echo envelopes dependences decomposition, described earlier in [12].
Molecular motion activation energies ЕA of the linear parts
of Т1 and Т2 were determined from reverse temperatures
(103/Т) dependences using Advanced Grafer program. At
high temperature approximation 2πνоτс<< 1correlation times
constant. In such conditions, the relaxation times are equal T1
= T2, and for intramolecular contribution in relaxation the
activation energy ЕA can be determined using values of
relaxation times T1,2(2)andT1,2(1), measured at temperatures T(1)
and T(2) [13] using equation:
ЕА (J/mole = 19,13 lg (T1,2(2)/T1,2(1)) [T(1)T(2)/(T(2)-T(1))], (3)
Error of ЕA determination is the sum of instrumental,
relaxation times and temperature measurements errors:
∆ЕA/ЕA = ∆lgT1,2/lgT1,2 + ∆ T(1)/T(1), (4)
and equal toγЕ =± (1,4 + 3,5 + 0,4) ≈±5 %.
Thermoelectrodynamic Measurements
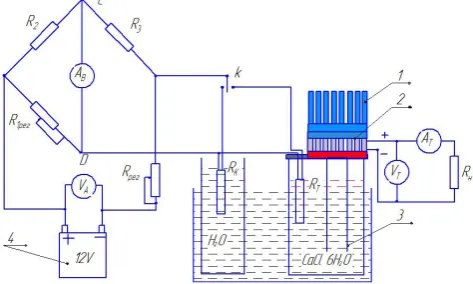
Techniques used to study phase transitions are usually conventional calorimetric, differential scanning calorimetric (DSC) and differential thermal analysis (DTA). As it is mentioned by Gibbs [ref.71 in 2], there is considerable uncertainty about the property values provided by manufacturers. Yinping [ref.72 in 2] reviewed conventional calorimetric methods and pointed out their limitations such as: a) too small quantities of sample can be analyzed (1-10 mg), but some properties depend on sampler volume; b) phase changes cannot be visually observed. According to [14] error of DTA reach ± 3% at measurement range ends. Taking it in consideration we elaborated device, structure scheme of which is presented at fig.3. It is the combination of the common and differential calorimetry additionally determining Seebeck thermoelectric tension U and current I of endo/exothermic effects in great volumes from temperature and time. It may be called thermoelectrodynamical spectroscopy (TEDS) method, because using it we can reveal the fine structure of phase transitions.
Figure 3. Device for receiving the dependences of the thermo electric tension (TET) and current from temperature and time using. Here 1- radiator; 2 –thermoelectric element (TE)ТEMO-7; 3 – thermostate; 4 - accumulator
12 V controlled by voltmeter VА; R2 and R3– resistors in Winston bridge
shoulders; R1reg – potentiometer for initial currents balancing; Rreg–
potentiometer for accumulator tension regulation; Rl – load resistor; Rтand
Rк– thermo resistors for salt and water temperatures measurements; АВ current balance meter; АТ and VТ – current and tension meters on TE.
Small thermoelectric element TEMO-7 (40x60 mm) was
used. One solder of it is connected with heat conducting plate, immersed in salt. Another solder is connected with radiator, freezed by cooler or ice. Point of melting usually is determined during 15 minutes. But we cooling process controlled during 100-180 minutes in the sample of volume V≈ 100 ml. Temperatures in sample and water were measured by precision R = 50 Ohm thermoresistors of the II class (∆t = ± (0,30 + 3,5⋅10-3t) in the temperature range -
50оС≤T ≤+180оС, maintained with Winston bridge. Resistivity is determined from equation Rt = Ro(1 + αT),
where α= 4,26⋅10-3К-1. Measurement error was ± 0.2 %.
3. Experimental Results
[image:3.595.315.549.313.413.2]Results of calorimetric measurements are presented at fig.4-5. At fig.4 is differential calorimetric curve of CaCl2⋅6H2O, on fig.5 – time dependences of temperature,
[image:3.595.317.550.449.576.2]thermoelectricity tension U(t)of CaCl2⋅6H2O and water.
Figure 4. Time dependence of differential calorimetric curve of
[image:3.595.58.295.504.646.2]CaCl2⋅6H2O at natural cooling from 70oC till 20oC
Figure 5. Time dependences of temperature (curve 1), thermoelectricity - electric tension (curve 2) and current (curve 3) of CaCl2⋅6H2O and water at cooling process from 67oC to 20oC
As it is seen from fig. 4 thermogramm curve has a complex form and first temperature increment ∆Te(T) =
2.5oC is observed at t = 10 min, but the main exothermic
effect increment appears at t = 180 min. At fig. 5 in the melted salt during cooling process main exothermic temperature Te peaks (temperature increment∆Te, followed
Compare CaCl2⋅6H2Oexothermic temperature increment
with such in Na2S2⋅5H2Oand CH3COONa⋅3H2O(see Table 2)
it can be seen, that ∆Te(T) increases with number of hydrated
water molecules sited in tetrahedral voids of crystal, giving
maximal thermoelectric tension ∆U = 45 mV with heat emission duration ∆Te = 55 min for CaCl2⋅6H2Oand ∆U =
750 mV on TEC-127-06C made from modern material and several times greater solders surface square.
Table 2
Salt ∆U (mV) Te (oC) ∆te (min) CaCl2⋅6H2O 45 29.2-30 [2,3] 55
Na2S2⋅5H2O 15 43 22
CH3COONa⋅3H2O 5 60 1-2
Before exothermic phase transition, the temperature curves of both water and salt coincide with each other (see
curves 1 and 3 at fig.5) and with correlation coefficient 873
, 0
2=
R are described by equation:
t) , (-,
T
TB = C =4348 exp 000375 , (5) So, from the position of most effective phase changing salt is
O H
CaCl2⋅6 2 and it can be used for design as thermoelectric generator.
To reveal the reason of it we studied the salt using nuclear magnetic resonance relaxometry.
3.1. Experimental Results of NMR-Relaxation Analysis and Discussion of Them
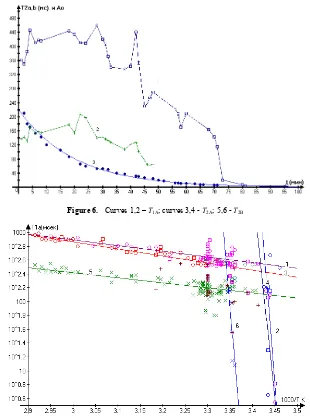
Results of measurement of spin-lattice Т1А, Т1В and spin-spin relaxation Т2А, Т2Вtimes from inverse temperature 103/Т K in CaCl H O
2
2⋅6 are presented at fig.6, time
dependences of relaxation in temperature interval of phase transition 1826 оС – on fig.7.
Figure 6. Curves 1,2 – T1A; curves 3,4 - T2A; 5,6 - T2B
[image:4.595.149.459.315.734.2]Relaxation rate (Т1,2)-1 of water protons has two
contributions: intramolecular
(Т1,2)-1intra = 3γ4h2τ/8π2Rij6, (6)
which characterize relaxation caused by reorientations of water molecules in crystalline structure, and intermolecular contribution:
(Т1,2)-1inter = πγ4h2NτD(1+2ao/5DτD)/4ao3, (7)
caused by translation diffusion of water in the melt[13]: where γ/2π = 4256/sеc⋅gauss – gyromagnetic ratio for protons, h = 6,626⋅10-34J/s – Plank constant, N
I = 6,75⋅1028
m–3 – number of spins in cm3, a
o – average molecular
diameter, Rij – average distance between protons, τR and τD –
correlation times of rotational and translational motions (τD
= ao/12D), D – self diffusion coefficient of water molecules.
Inter-proton distances Rij can be calculated using eq(6).
Studied crystal-hydrate CaCl2⋅6H2O is attributed to the crystal type, in which water molecules sited not in the pores or channels, but directly on the ions. That’s why the main relaxation is caused by reorientations of water molecules (Т1,2)-1intra connected by hydrogen H-bonds. More long times
Т1Аand Т2Аof proton phase A are attributed to protons of not crystallized water (upper and right vertical lines), times Т1В,
Т2В – to the B phase with some degree of crystal state through Н-bonds (lower and left vertical line).Alternative relaxation mechanism is not regarded, because translation of water during phase transition till melt is absent. Analysis of this paradox gives opportunity to make a conclusion (as it was noted in [15]), that diffusion is determined not only by the factor of overcoming of activation energy of potential barrier, but depends also from entropy factor, connected with molecular ordering. Salt crystal structure repeat water tetrahedral structure with her
104
2
7
′
angle between О-Н…О bonds. As it is seen from fig.6 phase transition inO H
CaCl2⋅6 2 takes place in the oscillating form in wide temperatures range T = 16-26oC (103/T = 3.46-3.375) and
finish at 103/T = 3.375for phase B and at 103/T = 3.46 for
phase A.
Temperature dependences of Т1А, Т2А and Т2В from 1000/Тare characterized by exponents and in frame of coordinates lgT1,2i (103/T) presented for Т1А by two lines with individual energies of activation ЕА – in high temperature range 103/T=2,9−3,42(19−72C) and in low temperature range10 /3 T=3,42 3,45(17 19 )− − C .
At 103/T =3,42(17 оС) observed break of Т1А dependence.
Т1А and Т2А for temperature ranges
) 72 19 ( 42 , 3 9 , 2 /
103 T= − − C with correlation coefficients 864
, 0
2 =
R and R2=0,977 are described as:
/T) , ( ,
T1A =22⋅105⋅exp −19⋅103 (8)
/T) ,
( ,
T2A=38⋅105⋅exp −21⋅103 (9) Dependence Т2В has another range of temperature
) 72 19 ( 36 , 3 9 , 2 /
103 T= − − C and described by equation:
/T) ,
( ,
T2B =83⋅104⋅exp −19⋅103 (10) Two relaxation times proton phases A and B with different activation energies are observed even in pure water near phase transition [13, с.114]. For high temperature range ЕАof pure water protons and ЕА determined for crystal-hydrate
from Т1 are very close: 3,7 and 3.79 kcal/mole accordingly.
Temporary dependences of relaxation times on fig.7 in O
H
CaCl2⋅6 2 during the phase transition are also complicated. Relaxation times of the both phases А and В change in oscillating form. So, on curve 1 (squares) -Т2А and on curve 2 (crosses) - Т2В six minimums of relaxation times are observed. That is phase transition of crystallization take place not in a moment, but is prolonged for time. The full crystallization at cooling process does not happen at the definite temperature Т = 29 or 30 оС (as it is reported in literature), but begins at earlier temperatures and goes passing through formation of temporal ordered structures, which gradually increase their degree of ordering and form minimum of Т2i as it follows from eq.(6). This process gives
oscillations of Т2ibefore crystallization. Ordering from melt
can be attributed to metastable state and for both А and В proton phases this temperature range is approximately in the range 30-35оС, corresponding to unstable intermediate state, which can be named structure-dynamical phase transition (SDPT). At the end of this range, before the transition to fully ordered (crystal) state, expenditure of the heat is needed. Physically it need additional energy for transformation of water molecules in the more ordered state. According to classical thermodynamics this situation can be expressed by Nernst law:
∆F - ∆Q = T∆S, (11) where ∆F,∆Q and ∆S are changes of free energy F, heat capacity Q and entropy S at temperature T. According the law all substances aspire to the minimum of free energy and the most stable substance has minimal F. In the case, when F decreases more rapidly, than Q, entropy S will also decrease, i.e. substance will come to more ordered form, and this will lead according to eq(6) to decrease of Т2i. The most stable
solid state will be reached only at 16 оС, not 29-30 оС and is ended when Т2А = 4 msec in crystal structure.
Decrease of Т2Aand Т2Вat SDPT takes place as a result of interproton distance Rij decrease at every ordered new
superstructure formation. Crystalline superstructures ordering are accompanied by exothermic process – emission of heat. Thermoelectrodynamic tension curve on fig.5 obviously demonstrate this.
NMR signal amplitude Ао on fig.7 (curve 3), demonstrate decrease at cooling. As it was mentioned in[16], at cooling take place lay of many structure and phase transitions, and crystallization centers grow by molecules, delayed in media due to viscosity. The process of crystal structure growth can be described by Colmogorov-Avrami equation: [16]:
Ct = −1 exp(−Ztn) (12)
depending from mechanism of crystals formation and growth (Avrami index). At n=3−4 three dimension crystals are formed, at n=2 (homogeneous nucleation) fibrilliar crystals formed. At n=1 takes place formation of one dimensional dendrites.
In our case decrease of the liquid (not crystalled) phase content, characterized by NMR Ао can be described by exponent, and equation for crystallized water is described with correlation coefficient R2=0,991by equation:
[
1 exp( 0,05)]
2, 220
Cc = − − t (13)
Taking in mind, that Avramiindex is n = 1, we can supposed, that in CaCl2⋅6H2O crystallization goes through formation of one dimensional dendrites.
[image:6.595.60.553.303.702.2]It is really so, because fotograph on fig.8, made on technical microscope with 200X optical increase confirm it. It is seen, that big crystals are formed from parallel oriented a little melted dendrites.
Figure 8. Photographs of crystalls CaCl2⋅6H2O
4. Conclusions
1. In temperature dependences of CaCl2⋅6H2O relaxation times demonstrate different behavior at the
cooling process. Relatively monotone decrease of relaxation times changed by oscillations, followed by the final sharp fall of Т2i to the value in the crystal state.
This is, we suppose, the indication of the ordering of B and A proton phases.
2. Solidification process for hydrated salt on thermoelectrodynamic curve demonstrates sharp increase, corresponding to exothermic heat emission. At the same temperatures the extremes are observed on the thermo-element tension UTE(mV) dependence.
Peculiarities in Т2i and caloric curves behavior can be
explained by structure- dynamical phase transitions (SDPT), which appear as a result of temporary (dynamical) formation and the following destruction (melting) of the supermolecular structures clusters. 3. SDPTs begins at Т = 35оС and are accompanied by the
decreasing of Rij as a result of ordering and increasing
of its density. Final phase transition do not end at Т = 29-30 оС (as by literature data), but goes on to the lower temperatures up to16оС, passing through formation of temporal structures, which gradually increase their degree of ordering.
REFERENCES
[1] Ginzburg V.L. http:ginzburg-ocr.narod.ru/online/ginzch2.ht
m
[2] Zalba B., Marin J.M., Cabeza F., Mehling H. Review of
thermal energy storage with phase change: materials, heat transfer analysis and applications.// Applied Thermal Engineering 23 (2003)251-283
[3] Chemist’s reference book, V.1, L.-М.: 1963.
[4] Kashaev R.S.-H., Masiab A.G.N. Patent of Russian Federation on useful model № .2013.
[5] IdiyatullinZ.Sh., Kashaev R.S., Temnikov A.N. Patent of
Russian Federation on useful model № 67719, G01N24/05
2006.
[6] IdiyatullinZ.Sh., Kashaev R.S., Temnikov A.N. PatentofRussianFederation on invention№23191138.4.05.20 06.
[7] HahnE.L. // J.Geogr.Res. 65,(1960) 776.
[8] Meiboom S., Gill D. // Review of Scientific Instruments. 29 (1958)688.
[9] Provencher S.W.Comp.Phys.Comm. 27 (1982)229. [10] PerepuchovА.М. Algorithm of revearse Laplace transformatio
n for complex relaxation data processing. Сoll. Of papers Intern. Science conference. St.Petersburg University.
2010.p.98
[11] Brown R.J.S. Information available and unavailable from multiexponentional relaxation dateJ.Magn.Res. 82 (1989)
[12] КаshaevR. S.-H., GazizovE.G. operative control of the
bitumen and oil components by the NMR-metod.
IzvestiyaVUZov. Problemyienergetiki. 2010. №7-8, 7 с. [13] VashmanА.А., ProninI.S. Nuclear magnetic relaxation and its
use in chemical physic. -М:. Nauka, 1979.-235p.
[14] Callaghan J.E., Sullivan S.A. Rev. Sci. Instr. 57, #10 (1986)
2584-2592.
[15] МоsvichYu.I., SergeevN.А., DotcenkoG.I. Study of water
mobility in sorrel acid by NMR method. Journal of Structure
Chemistry.V.19, №1 (1978) 57-63.
[16] SharplezeА. Crystallization of polymers. MIR publishing. М.: