Journal of Chemical and Pharmaceutical Research, 2014, 6(7):869-873
Research Article
CODEN(USA) : JCPRC5
ISSN : 0975-7384
An analysis based on the coordinated development of financial system
Yushuang Zhang
Economic and Trade Department, Shanxi University of Technology, Yangquan, Shanxi, China
_____________________________________________________________________________________________ABSTRACT
As the economic operational center of our country, financial system always acts as the coordinated development in public. The coordinated development of financial system is a result of the deepening process of financial practice. It is also the transition period to adapt to the existing norms. In the process of continuous development and innovation, the financial system is also in constant improvement, keeping up with the trend. This paper uses the fuzzy mathematics, to evaluate the coordinated development of the financial system from the overall development of the situation, as well as the size and structure.
Key words: financial system; financial development; coordination
_____________________________________________________________________________________________
INTRODUCTION
With the accelerating process of reform and opening up, China's pace of building a harmonious socialist society in also becomes more and more rapid. The so-called “harmonious socialist society” is to seek the balance in China’s urban-rural gap, regional gap and the gaps of employment, education, medical security, and social security. Basically it can reflect the real opinion of the people.
Our country's financial regulators and dominate the absolute source of social wealth. The main goal of our country is to safeguard its own financial system coordinated development while promoting the development of a harmonious society. From a macro perspective, the rise of the stock financing way directly led to the direct investment development speed, and enhanced bank’s control on financial system. But from the point of view of the securities and futures, in the national debt and policy, financial securities occupy the dominant position. The bank has maintained a steady state. In financial development, if one internally maintained a stable system of coordinated development of the situation, then the system is the benign development, and is in a stable and healthy state. If we want to evaluate a financial system, we need to apply mathematics model, not only with good or bad judgment. Because the coordinated development of this concept is relatively vague, we need to apply a fuzzy going to evaluate it. This article is based on the coordinated development of financial system and it studies our country’s financial industry development scale, structure, efficiency and also evaluates the coordinated development of the financial system.
1. MEASURES AND DATA
1.1 Choice of Objects and Explanation of Data
rising steadily. The trend of financial industry changes is not obvious. The main change of the financial industry is reflected in the rapid development of the securities investment. Therefore, this paper applies the representation by using ratio of FDR which shows the ratio of the total balance of all financing amount directly. As for the efficiency of the financial development index, we can directly see from the point of the function of financial development. On the macro level, it is that we put the functional theory of capital into the real social surplus use, and use the funds in loan pattern. The distribution of these loans is the need to certain mathematical formula in distribution. We can use the savings and loan ratios (SLR) to show the efficiency index.
The data of this paper basically comes from financial industry’s financing data during 1981 to 2004. In the field of the investigation of financial industry financing, we should keep consistency and integrity of data. At the same time, the balance of M2 and securities, loans, savings, stock value is from the scope of the historic market value at the time.
1.2 Coordination Measurement Model
As for comprehensive state index and coordination index, we should integrate all factors within the system, which can reflect the link among various factors and relationships. Systematically, there is similarity of forecast and development in the factors of every system. It can describe the relationship between the predicted results and reality and can accurately express the coordination between the internal factors. So, the point of this article is to use the coordination degree to express the relationship between the inner part and the whole part. Degree on the relationship between the state indexes as well as the relationships among the main measure is the coordination degree of the role of a major as well as the concept which can accurately express the relationship between the system and structure. To compare listed system and internal phase to the opposite attributes, can, by applying the method of interval judgment in determining the system after each link within the state, will be able to analyze the status between the coordinated development of the range and scope, so it can judge, judge whether the development of the system is in a state of a coordination. In order to be able to describe the degree of coordination, we can make the establishment of a fuzzy set, the degree of coordination can be as an indicator, in [0, 1] inside the closed interval of real number, we call it the coordination coefficient, using the coordination coefficient, can clearly shows us a coordinated development of the relationship. The coordination coefficient is real number in [0, 1] close range, the real number or what we call membership, membership function can reflect in a given range, the changing rule of the membership degree. State expression coefficients are set in fuzzy, and are used to express the coordination coefficient in line with the degree of related definition formula. See the formula below:
In the formula, is the accurate expression of state index i to state index j. Xi is the actual value. is the
coordination value which require by state index j to i.
s
2 is variance. If the value describe is very close to the coordination value, then the coordination degree will be very high. On the contrary, if the values are not very close, then the coordination degree will be low. We can subjectively value the coordination coefficient which can directly reflect the developing relationship between actual value and the coordination degree. It can also describe the coordination degree between to state indexes. The definition formula below shows the degree of coordinated development among indexes:better the financial development situation. When C(t)=1, the coordination development is fully coordinated. If a≤
C(t)<1, the development is roughly coordinated. If b≤C(t)<a, the financial industry is not coordinated. If C(t)<b,
the financial industry is also not coordinated. The values of a and b depends on the specific situation.
1.3 Steps and Methods
As for steps and methods, there are mainly two types. One of them is using regression analysis method to analyze the correlation of sequence array. Each sequence array on the regression analysis of test results is arranged. Through this, we can get the most suitable regression equation that best matches the data. The second method is based on the three listed defined types of calculation. We can take appropriate values into the formula used in the last part and get the most appropriate coordination coefficient formula for financial industry development. The third method is established by using the method of matrix above. As a result, we can calculate the suitable coordination pattern for the situation of the development of financial industry in our country in various periods of time.
2. DEMONSTRATION PROCESS AND RESULTS
2.1 Regression
Fi, Fd, F1are used to show the form of scale merit, structure indicator and efficiency target variables of financial
industry system. Fi is the dependent variable and Fd is the independent variable. After regression, we get the result
below (see Figure 1).
Fitting R2 F b0 b1 b2 Linear function 0.973 144.38 126.832 6.1451 ——
Conic 0.831 136.04 113.938 10.8888 —— Composite curve 0.712 90.73 128.07 1.0445 0.1807 Geometric progression line 0.612 90.83 4.8607 0.0765 ——
[image:3.595.168.440.292.363.2]Exponential equation 0.712 90.83 129.078 0.3228 —— Logistic equation 0.812 90.83 0.0088 0.8677 ——
Figure 1: Result of the regression with Fi being independent variable and Fd being dependent variable
After calculation, the bet fitting result should be:
2.2 Calculate the Coordination Coefficient Matrix
In this step, we should take the real value of each state index in substitution and calculate the best-fit equation. After that, we can get the corresponding coordination of value take it into the definition formula above. Finally we can get the coordination coefficient
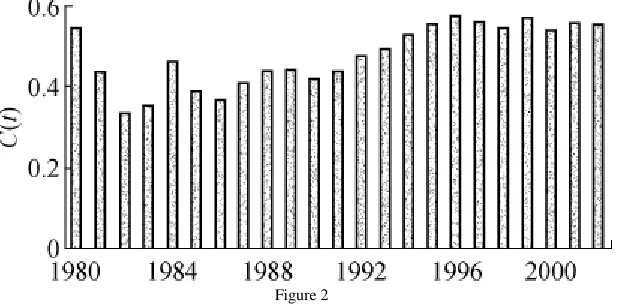
Figure 2
2.3 Calculate the Coordination of Financial Development
[image:3.595.155.464.563.716.2]different periods of time. The formula is . After calculating the development of China’s financial industry development state coordination degree by using the formula in the last part, we can get the basic developing trend of the development of China’s financial industry. The results are shown below (see Figure 2).
3. CORRELATION OF FINANCIAL COORDINATED DEVELOPMENT AND ECONOMIC GROWTH
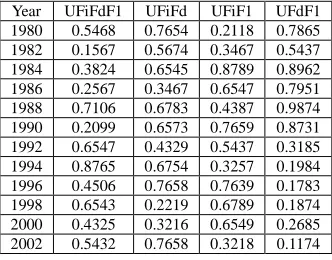
Through the data of GDP, we can make substitution by using linear regression equation. Results are shown below (see Figure 3).
[image:4.595.223.389.182.312.2]Year UFiFdF1 UFiFd UFiF1 UFdF1 1980 0.5468 0.7654 0.2118 0.7865 1982 0.1567 0.5674 0.3467 0.5437 1984 0.3824 0.6545 0.8789 0.8962 1986 0.2567 0.3467 0.6547 0.7951 1988 0.7106 0.6783 0.4387 0.9874 1990 0.2099 0.6573 0.7659 0.8731 1992 0.6547 0.4329 0.5437 0.3185 1994 0.8765 0.6754 0.3257 0.1984 1996 0.4506 0.7658 0.7639 0.1783 1998 0.6543 0.2219 0.6789 0.1874 2000 0.4325 0.3216 0.6549 0.2685 2002 0.5432 0.7658 0.3218 0.1174
Figure 3: The harmonization matrix of indicators
Taking GDP as the dependent variable Y, total industrial output I and financial industry coordination degree U as the independent variable for the needed regression equation, this regression equation can well reflect financial coordination degree's support to GDP. The specific regression equation is:
Analyzing GDP by this linear regression equation, we can do some calculation in theory and get the conclusion that the economic development in our country is greatly dependent on the development of financial industry. If the financial industry faces problems, the economic development will be deeply influenced by the bad situation.
CONCLUSION
Based on the analysis of charts and data above, we can basically explain the trend of the development of China's financial industry. This part will then summarize the features of the relationship between the coordination state of the coordinated development of China's financial system and GDP. First of all, the development of China's financial industry has reached a stable phase. After developing for a long time, the basic coordination state has been formed and it’s very intact. Secondly, the data of scale, structure and efficiency of financial industry show that the coordination among financial scale, structure and efficiency is not in conformity. The coordination between structure and scale is prior the coordination between scale and efficiency. The two points above indicate that the financial efficiency in our country is not high enough. The government should pay more attention to this and urges the improvement of financial efficiency. Thirdly, the vague model shows that the coordination of financial industry is the best developed one so far. The rising GDP is positively influencing the financial industry development. Currently, the biggest support for the coordination of financial industry is to seek change in the stable development trend.
REFERENCES
[1] Zhang Jianhua, Empirical research of the efficiency of China’s commercial banks between 1997 – 2001 using
DEA method, [J], finance research, 2003,24(3):11-25
[2] Wang Yi, Evaluation of the deepening of China’s financial system using financial stock index, [J], Finance research, 2002,23(1):22-26
[3] Xi Junyang, Zeng Zhengyu, The efficiency of China’s commercial banks – based on the experience of
parameter prediction, [J], study of international finance, 2003,77(5):17-21
[4] Wang Weiguo, On the establishment of a coordination coefficient system of national economy, [J], Statistic research, 1995,31(4):66-68
in China, [J], Journal Of Beijing University Of Technology(Social Sciences Edition);2003 (4)
[6] Li Huamin, Analysis Competitiveness in Joint-stock Commercial Bank of China Based on DEA, [J],Journal Of Shandong Institute Of Business And Technology;2006 (01)
[7] He Ren, A Comparative Study on Market Structure, Efficiency and Performance in Banking Industry--A Review Based on Shanghai Banking Industry, [J], Journal Of Finance And Economics, 2005 (12)
[8] He Liping, Financial development and China’s investment growth——data estimation and preliminary analysis