Temperature Effects in Fiber Couplers
Rahmat Alamtaha
*, Ary Syahriar, Salim Burdah
Electrical Engineering Department, Faculty of Science and Engineering, University of Al-Azhar Indonesia, Indonesia
Copyright©2019 by authors, all rights reserved. Authors agree that this article remains permanently open access under the terms of the Creative Commons Attribution License 4.0 International License
Abstract
Directional Coupler is one of the devices used in signal transmission techniques in optical fiber communication systems, especially Wavelength Division Multiplexing (WDM). The directional coupler can be used as a sensitive sensor, one of which is based on wavelength shifts and coupling length shift. This paper simulates a shift in wavelength and coupling length based on the influence of temperature in the range of 30℃ to 230℃ based on the characteristics of power output. The wavelength used in this simulation is in the C-Band region, which is around 1550 nm. Temperature changes cause changes in the material refractive index. Temperature changes cause a shift in wavelength and coupling length increase which describes the characteristics of the thermo-optic effects on the directional couplers.Keywords
Directional Coupler, Thermo-optic Effect, Effective Refractive Index, Coupling Coefficient, Wavelength Shift, Coupling Length1. Introduction
Optical couplers are passive devices which either split an optical signal into multiple paths or combine several signals into one path [2-3]. The output of the directional coupler is influenced by several things including the influence of curvature and temperature [1, 6-10]. This paper simulates thermo-optic effects on the directional coupler output, especially on silica fiber. Temperature changes on a silica fiber affect the refractive index of the silica. Studies to determine the refractive index equation as a function of temperature have been carried out by various methods, such as the prism method, interferometric method etc. [1], [6]. The equation for changing the refractive index depends on the coefficient of thermo-optics. Therefore, many studies have been developed to measure the temperature dependence of refractive index which is characterized by the thermo-optic coefficient (∂n/∂T) in silica fiber [1].
In determining the effective refractive index using various methods, among others, are analytical methods,
effective index methods and numerical methods, such as the bisection method [5]. However, analytical and numerical methods can be used when ignoring external effects such as temperature. The refractive index value as a function of temperature change is an effective refractive index (neff) on the directional coupler that affects output [1,
6]. If the effective refractive index increases, it will affect the propagation constant and coefficient coupling in a directional coupler [2-4].
This paper simulates the effect of thermo-optics on the directional coupler using Mathcad, based on changes in the effective refractive index which is influenced by thermo-optics. The output to be seen is a shift in wavelength (∆λ) and an increase in coupling length (∆L). Two silica fibers in the directional coupler are assumed to be two identical fibers. So that the output of the two fibers is considered the same. Therefore, we only have to look at the simulation results at just one output.
2. Directional Coupler
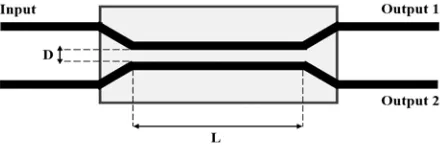
[image:1.595.311.531.573.648.2]The directional coupler structure contains two optical fibers that are joined together in a very small area of interaction (Figure 4). The process of transferring optical power in linear directional couplers is explained in the theory of coupled mode [3].
Figure 1. Directional coupler structure
The directional coupler structure contains two optical fibers that are joined together in a very small area of interaction (Figure 1). The process of transferring optical power in linear directional couplers is explained in the theory of coupled mode [3].
∂A
∂B
∂z =-jKAexp(j(β2-β1)z), (2)
where A and B are constants to be evaluated on boundary conditions and are coupling coefficients coupled by [2–5, 10]:
K = √2∆ a
U2K0�WDa�
V3[K1(W)]2
, (3) where
U = κ a, (4)
W=γa, (5)
V=k0a�n11-n2 1
, (6)
κ =�k0 2
n12-β 2
, (7)
γ =�k0 2
n12-β 2
, (8) where a is the radius of the cores of silica, D is the center to the center separation distance between them, and Δ is the relative refractive index difference. K0 and K1 are the modified Bessel functions of order 0 and 1, respectively; V is the normalized frequency (i.e. V parameter), and U and W are the normalized transverse propagation constants of the LP01 mode in the core and cladding, respectively [2-7, 10]. β is the value of wave propagation constants in the core [3].
β =k0neff= 2π
λneff, (9)
The equation for the optical fiber output coupler is represented by the transfer matrix operation in a vector as [3, 6-7]:
Mc=�
cosφ -jsin φ
-jsin φ cos φ�, (10)
where φ = Kz and z is the direction of wave propagation along L in the directional coupler. The optical fiber coupler output power solution that has one input can be calculated using Eq. (9) and matrix transfer coupler [3-7]:
Pout1=Pin[cos(Kz)]2, (11) Pout2=Pin[sin(Kz)]2, (12)
Table 1. Parameters of Simulation
Parameter Symbol Value Unit Refractive Index Core n1 1.453
Refractive Index Cladding n2 1.443
Radius Core R 4.1 μm The distance between of
two Fiber D 7 μm
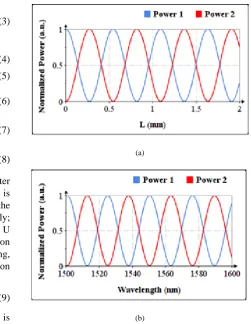
If we assume that the two-silica fiber directional couplers are identical to the parameters as in table 1. The above parameters are determined based on the optical fiber specifications issued by the SMF-28 Ultra. Power simulation results as a function of L and wavelength are
shown in Figure 2(a) and 2(b). The simulation results use the index of effective initial refraction (n0) of 1,447. Value
of wavelength in Figure 2(a) is 1550 nm and value L in Figure 2(b) is 2 cm.
(a)
(b)
Figure 2. Output Power of two silica fiber as a function of L and wavelength
3. Effective Refractive Index
Several factors influence the optical output power of the directional coupler, namely the length of the coupling area which depends on the wavelength, the length of the coupling area, the distance between the waveguide and the width of the waveguide. In addition to these factors, the most decisive factor is the effective refractive index determined by the large wavelength. In determining the effective refractive index using various methods, among others, are analytical methods, effective index methods and numerical methods, such as the bisection method [5].
The effective method index is a method that is often used in determining effective refractive indices. This method has proven to be better than analytical methods [11]. However, there are other methods that have recently been used, the bisection method. The bisection method can be used to determine the effective refractive index on fiber optics using the dispersion equation. In this paper, the disperse equation used is the dispersion equation in LP01
[image:2.595.281.533.136.461.2]values tend to be the same (n1≅n2), LP Mode dispersion equation is obtained by replacing n1/n2≅1 into TE, TM, and hybrid mode equations [2-4]. The dispersion equation mode LP01 where J0 is Bessel function zero order and J1
Bessel function one order can be written as follows [2-3].
J1(U)
UJ0(U)=
-K1(W)
WK0(W), (13) Based on several studies, the effective refractive index is influenced by temperature. This is influenced by the refractive index of cladding influenced by the type of material used when the material is heated the refractive index of the material will change. Heating a 10 mm long guide of 15.23℃ resulted in a phase shift of π/2 at a wavelength of 1523 nm [7]. The value of phase shift and time required to depend on the thickness of the cladding, thermal conductivity and substrate material used [7]. For silica on silicon, the heat supplied by the heater will diffuse into the Si substrate through the SiO2 cladding layer then
passed through the SiO2 core layer. This process occurs
because the thermal conductivity of Si is much greater than SiO2 [6]. Each lateral heat flow to the cladding glass is
small, and all glass reaches thermal equilibrium very quickly [13]. The Thermo-Optic Coefficient (∂n/∂T) and its dispersion have been critically analyzed and developed by taking into account the dispersion of the band edges correctly. The Sellmeier coefficient at any temperature T is calculated from the room temperature Sellmeier equation and the ∂n/∂T value is 10-5 ℃ [5-7, 12] with the equation as follows.
nT(T)=nR+(T-R)(∂n/∂T ), (14)
T is temperature, R is room temperature, nT(T) and nR
are two effective indexes at a certain temperature and room temperature. The refractive index equation and the thermo-optical coefficient value are carried out in a temperature range below 1000℃ [1, 6-12]. New research to determine equations and thermal-optic coefficients in silica fiber is carried out in a temperature range of 0-1200 [1]. The research was also obtained the first and second orders coefficient of the thermo-optic and established a quadratic model for the temperature dependence of the refractive index, the equation is [1].
n(T) =n0+αnT+βnT 2
, (15)
∂n(T)
∂T = αn+βnT, (16)
where n(T) is the effective refractive index that changes with temperature. αn and βn are first-order and
second-order thermo-optic coefficients. Value of αn=1.090×10
-5
and βn=1.611×10⁻⁹ [1].
Figure 3. The difference of the effective refractive index nT(T) and
n(T) as a function of temperature
Graph results in Figure 3 don’t show a significant difference. The refractive index nT(T) and n(T) have the same natural values in the temperature range 0-400℃ and begin to experience differences at temperatures above 400℃. The 𝑛𝑅 values and Thermo-optic coefficients in the nT(T) equation are derived from the equation of the refractive index n(T), so the difference between the two is not significant. Based on the graph, the thermo-optic characteristic equation used in the simulation to determine the directional coupler output is equation n (T).
4. Simulation and Discussion
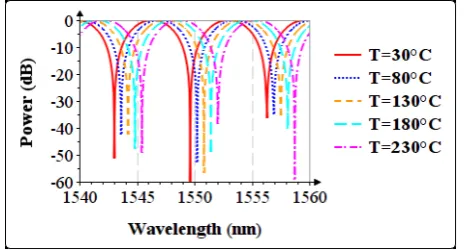
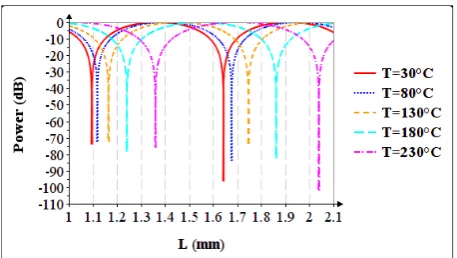
We assume that two silica fibers in the directional coupler are identical so that the simulation is done enough on one of the outputs. The first simulation is to look at the output power as a function of the wavelength in several temperatures (Figure 4), whereas in the second simulation it looks at the output power of the coupling length increase in several temperatures (Figure 5). The directional coupler is assumed to experience heating along the coupling area and heating is carried out in the temperature range 30℃ to 230℃. The difference in results in both simulations can be seen in the following graph.
[image:3.595.306.539.77.226.2] [image:3.595.306.539.567.692.2]Figure 5. Spectral response to changes in coupling length in several temperatures
Figure 4 shows that the directional coupler is a scalable device. It means that its spectral properties are periodic and these periodicities are called free spectral range (FSR) or channel spacing [6]. In this simulation, we obtain the value of FSR about 6.5 nm with the isolation power less than -30 dB in C-band wavelength ranges. In Figure 5 shows with the isolation power less than -60 dB in C-band wavelength ranges.
4.1. Wavelength Shifting Caused by Temperature Changing
Figure 6. Wavelength shift as a Function of Temperature
In this simulation, the wavelength shift increases in the temperature range 30℃ to 230℃ (Figure 4 and Figure 5). The result of the wavelength shift is illustrated in the graph above (Figure 6). Figure 6 shows that higher temperatures result in wider wavelength shifts. To illustrate the relationship between shifting wavelengths and changes in temperature, we use brute forces to fit a linear equation to shift data λ caused by temperature effects, which produce the following equation:
λT = λ0-8.2�T-T0�10
-3, (17)
A λ0 is the initial wavelength at T0 30℃. λT is the
value of the wavelength at a certain temperature after the coupler is heated. This equation can be used to immediately find out what degree of temperature must be heated to get a shift in a certain wavelength.
4.2. Coupling Length Shifting Caused by Temperature Changing
Figure 7. Coupling Length shift as a Function of Temperature
The coupling length increment in this simulation is directly proportional to the increase in temperature in the range 30℃ to 230℃. Figure 7 shows that high temperatures can produce long couplings. To illustrate the relationship between the increase in coupling length and temperature change, we use brute forces to fit a linear equation to see the length changes caused by the temperature effect, which produces the following equation:
LT=L0+(0.16�T-T0�-8.8)10 -2
, (18) where L0 is the initial coupling length at 30℃. LT is the
value of the wavelength at a certain temperature after the coupler is heated. This equation can be used to immediately find out what degree of temperature must be heated to get an increase in coupling length.
In this simulation, the temperature range is limited to 30℃ to 230℃. Based on the magnitude of the wavelength and the length of coupling, the results at very high temperatures or low temperature display the same graph form for shifts in wavelength and coupling length if the data in the fitting uses excel. The effect of temperature on shifting wavelength and coupling length is taken based on previous research on the effect of temperature on silica fiber in equation 15, so we can say that our simulation results are quite accurate because in this simulation we use silica fiber.
5. Conclusions
[image:4.595.306.536.84.268.2] [image:4.595.59.289.355.543.2]heated to produce a shift in wavelengths and certain lengths.
REFERENCES
[1] Gao, H., Jiang, Y., Cui, Y., Zhang, L., Jia, J., & Jiang, L. (2018). Investigation on the Thermo-Optic Coefficient of Silica Fiber within a Wide Temperature Range. Journal of Lightwave Technology, 5881 – 5886.
[2] Wartak, M. S. (2013). Computational Photonics. New York: Cambridge University Press.
[3] Okamoto, K. (2006). Fundamentals of Optical Waveguides, Second Edition. California: Academic Press is an imprint of Elsevier
[4] Al-Ayyubi, F. (2017). Comparison of characteristic of two and three couplers Mach-Zehnder interferometers. International Conference on Cyber and IT Servide Management (CITSM) (pp. 1-5). Denpasar,Bali: IEEE
[5] Sujecki, S. (2015). Photonics Modelling and Design. Taylor & Francis Group, LLC
[6] Palupi, R. R. (2013). Simulation of Mach Zehnder Interleaver Based Thermo-Optic Effect in L-Band Range. Regional Symposium on Micro and Nanoelectronics (pp. 269-272). Langkawi, Malaysia : IEEE
[7] Agifral, D. (2010). Simulation of Optical Switching Based on Mach-Zender Interferometer Structure . International Conference on Computer and Automation Engineering (ICCAE) (pp. 764-767). Singapore, Singapore: IEEE
[8] Ghosh, G., & Endo, M. (1994). Temperature-dependent Sellmeier coefficients and chromatic dispersions for some optical fiber glasses. Journal of Lightwave Technology, 1338 - 1342
[9] Mousavi, S. M. (2015). Design, Fabrication and Test of a Broadband High Directivity Directional Coupler. Iranian Conference on Electrical Engineering (pp. 168 - 170). Tehran, Iran: IEEE
[10] Guzmán-Sepúlveda, J. R. (2013, May). In-fiber directional coupler for high-sensitivity curvature measurement. Optics Express
[11] Buus, J. (1982). The effective index method and its application to semiconductor lasers. Journal of Quantum Electronics, 1083 - 1089