International Journal of Emerging Technology and Advanced Engineering
Website: www.ijetae.com (ISSN 2250-2459, ISO 9001:2008 Certified Journal, Volume 3, Issue 5, May 2013)
Clustering of Datasets by using Centroid Based Method
Niraj . N.Kasliwal
1, Prof Shrikant Lade
2, Prof Naveen Malviya
31M-Tech, 2HOD, 3Asst.Prof, IT & RKDF Bhopal, India
Abstract - The integrated data mining processing technique to find appropriate initial centroids and Vectors in data clustering process by K-means and C-means algorithm. The processes include data cleansing, preprocessing, and finding features relation with Apriori algorithm to get appropriate features. Here we used centriod based model that represents the processes for finding appropriate initial clustering centroids and selecting the most relevant features from large datasets. We can get better clustering result with these clustering methodology. The experimental result shows the working enviournment of both clustering techniques.
Keywords - Data mining, Apriori algorithm, K-means clustering, C- means (Fuzzy) clustering.
I. INTRODUCTION
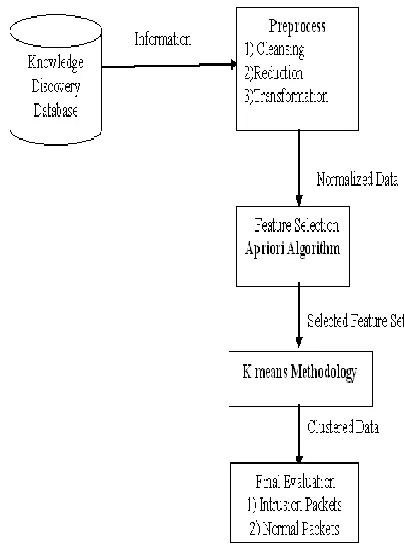
[image:1.612.69.267.435.563.2]The data mining [1,2] is the automatic process of searching or finding useful knowledge. The process extracts data from large database with mathematics-based algorithm and statistic methodology to reveal the unknown data patterns that can be useful information.
Fig. Data Mining Process
The information got from data mining process is very important knowledge that help user in decision making concerned business strategies. These processes are also called Knowledge Discovery in Database (KDD) in that knowledge discovery and analysis can be performed from many information and raw data in databases
This paper studies various techniques to improve the data clustering by using centriod based clustering methods like K-means & C means. The problems in data clustering with k-means are the selection of initial centroids in each cluster of data. Poor selection results in more time processing. But in case of C means it’s exactly opposite i.e good selection result in less time. The research has focused on the working enviournment of both clustering methods.
In this paper, the main idea of data mining technique in data clustering from raw data with appropriate initial centroids selection is presented. The techniques used in this paper are Apriori algorithm for feature selection process and clustering data with k-means & C means (Fuzzy) clustering methodology.
A. Apriori-based Algorithm
Apriori [1] is a classic algorithm for frequent itemset mining and association rule learning over transactional databases. It proceeds by identifying the frequent individual items in the database and extending them to larger and larger item sets as long as those item sets appear sufficiently often in the database. The frequent item sets determined by Apriori can be used to determine association rules which highlight general trends in the database: this has applications in domains such as market basket analysis.
B. K-means Clustering Methodology
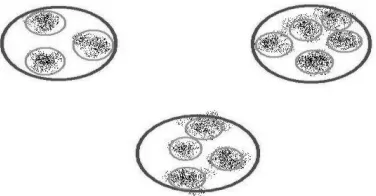
The data clustering [2] is processing of raw data to find clusters or groups of similar data. In each cluster, members have some similarity in type of data. The principles of data clustering are finding value of score in similarity, and assigning each member to be in the same group of other members that have similar or same score.
The data mining technique in finding data clusters is different from data classification in that user does not have to specify target feature for assigning each data record to the appropriate cluster. Data clustering is thus an unsupervised learning method. The clustering method relies on the similarity measurement to automatically from groups of relevant or similar data members as visually shown in figure. After the clustering process, user can apply some classification algorithm to extract data pattern in each cluster for a better understanding of cluster model.
[image:1.612.352.540.600.698.2]International Journal of Emerging Technology and Advanced Engineering
Website: www.ijetae.com (ISSN 2250-2459, ISO 9001:2008 Certified Journal, Volume 3, Issue 5, May 2013) K-means clustering algorithm is the most selected
technique to cluster data. K-means is a nonhierarchical clustering and use looping to group data into K groups. The K-means clustering start the iterative process by finding the initial centroid, or central point, of each group by randomly selecting representative data from raw data to be a centroid in each K data groups. Then assign each data to the closest group by calculating the Euclidean distance between each data record to each centroid to allocate the data record to the nearest group. After that each cluster will find new centroid to replace the initial one and repeat steps of Euclidean distance computation to group data members and send each member to group of the nearest centroid. The process will stop when each group has stable centroid and members do not change their groups.
C. C-means Clustering Methodology
Fuzzy c-means (FCM) [12,13] is a method of clustering which allows one piece of data to belong to two or more clusters. This method is frequently used in pattern recognition. It is based on minimization of the following objective function:
,
Where m is any real number greater than 1, uij is the
degree of membership of xi in the cluster j, xi is the ith of
d-dimensional measured data, cj is the d-dimension center of
the cluster, and ||*|| is any norm expressing the similarity between any measured data and the center. Fuzzy partitioning is carried out through an iterative optimization of the objective function shown above, with the update of membership uij and the cluster centers cj by:
,
This iteration will stop when
, where is a termination criterion between 0 and 1, whereas k are the iteration steps.
This procedure converges to a local minimum or a saddle point of Jm.
The algorithm is composed of the following steps:
1. Initialize U=[uij] matrix, U(0)
2. At k-step: calculate the centers vectors C(k)=[cj]
with U(k)
3. Update U(k) , U(k+1)
4. If || U(k+1) - U(k)||< then STOP; otherwise return to step 2.
II. RESEARCH METHODOLOGY
A. K-means Clustering Methodology
It provides a model that shows the processes of preparation of the suitable data, selection of good centroids, and achieving better clustering performance with their processing. In given model first step is preprocessing steps that cleansing raw data from Knowledge discovery database and select suitable features by Apriori-based algorithm. After that clustering subset of train data by random selection of data representatives to get initial centroids for clustering on all training data to provide good data cluster. With better initial centroids from sampled data and improved algorithm by concurrent processing, our model will get better results in processing.
The research processes follow the model. The model includes the data set selection from KDD Cup website[20] . These data has complicated and varied type of categories suitable for data mining task to find some knowledge patterns. These data sets will be selected for interesting subjects related to the research’s objective.
International Journal of Emerging Technology and Advanced Engineering
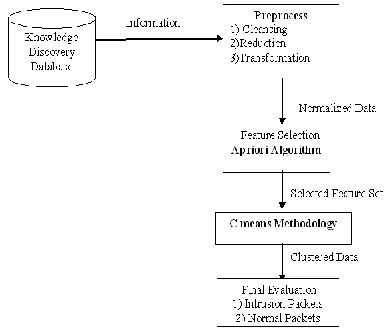
Website: www.ijetae.com (ISSN 2250-2459, ISO 9001:2008 Certified Journal, Volume 3, Issue 5, May 2013) The gained related feature data set will be clustered by
[image:3.612.69.271.223.495.2]K-means clustering technique and improved with the concurrent processing methodology. In k-means clustering, we will compare the result of clustering with clustering technique that got initial centroid from sampled data against the sequential data records without centroid selection technique.
Fig : Process diagram for k means
Data sets and Implementations
1 Large Data Set Selection
This research uses large data sets from KDD cup database. The above state diagram i.e K-means Algorithm process model that contain 6 selected features related to packets. These selected features are: PacketPort, PacketBaseIP, PacketIP, PacketProtocol, PacketType, PacketSize .
2 Data Preprocessing
The first process for data mining is data preprocessing that researchers will prepare the data sets for use in data mining processes.
Researchers have to set clear criteria to filter all data sets suitable to the research objectives. The first step in data preprocessing is the data cleansing process that gets rid of noise and outlier. Then data has been reduced and transformed into the format that is appropriate for data mining software to analyze and clustering.
3 Feature Selection with Apriori-based Algorithm In the continuing step of Processing model is feature
selection processing. The feature selection will use the association technique with Apriori-based algorithm to generate the sets of feature relation rules. With Apriori-based algorithm used to analyze and generate features that are related and affect to other features in the group, more effective action in association technique is required. We have to filter the rules that appropriate to research objective. In this research our aim is to finding features that affect performance of packets. So that all features from KDD Cup selection will be used to calculate the associate rules with Apriori-based to get related features for clustering.
Selection Criteria for k means :
1) The size of minimum packet is 30 and maximum is 5000 above this would be treat as a false packets.
2) The minimum port for sending the packets are 150 below ports would be discarded.
3) If rejected protocol = “udp domain ” then it would be treat as a rejected protocol
4) If the given port = {246, 220, 324} then it would be a normal packets .
5) The number of iterations performed =4.
6) The maximum intrusion is 1000 above that not count.
4 Clustering by K-means Clustering Methodology
International Journal of Emerging Technology and Advanced Engineering
[image:4.612.329.554.110.272.2]Website: www.ijetae.com (ISSN 2250-2459, ISO 9001:2008 Certified Journal, Volume 3, Issue 5, May 2013)
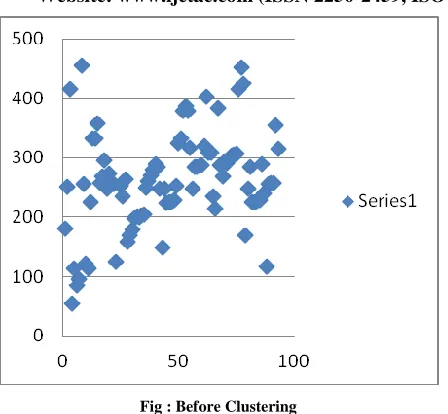
Fig : Before Clustering
When we applied K means algorithm to the given files, the rejected protocols are automatically rejected from the files because of apriori algorithm, at the end result comes in two packets like intrusion and normal packets . Table No.1 shows the amount of data sets after filtering with all criteria.
Table number 1
[image:4.612.59.283.127.334.2]Now, based on these figures we plot the graph of intrusion and the normal packets of the given datasets.
Fig 4.3 After applying K means Clustering
B. C-means Clustering Methodology
In fuzzy clustering (also referred to as soft clustering), data elements can belong to more than one cluster, and associated with each element is a set of membership levels. These indicate the strength of the association between that data element and a particular cluster. Fuzzy clustering is a process of assigning these membership levels, and then using them to assign data elements to one or more clusters.
It provides a Processing model that shows the processes of preparation the suitable data, selection the good centroids, and achieving better clustering performance with their processing. The processes include preprocessing steps that cleansing raw data from KDD Cup data and select suitable features by association analysis with Apriori-based algorithm. After that clustering subset of train data by random selection of data representatives to get initial center vectors for clustering on all training data to provide good data cluster. With better initial center vectors from sampled data and improved algorithm by concurrent processing, our model will get better results in and time processing.
The research processes follow the model. The model includes the data set selection from KDD Cup website . These data has complicated and varied type of categories suitable for data mining task to find some knowledge patterns. These data sets will be selected for interesting subjects related to the research’s objective.
The gained related feature data set will be clustered by C-means clustering technique and improved with the concurrent processing methodology. In C-means clustering, we will compare the result of clustering with clustering technique that got initial center vectors from sampled data against the sequential data records without center vectors selection technique.
File Size
(kb) 38
4 2 5 5 4 3 5 8 6 0 5 5 1 2 5 1 1 0 2 2 5 1 3 0 1 5 0 2 1 0 1 5 0 1 4 5 1 6 0 Intrusion
K 15
1 2
1 0 8
2 0 1 0 1 2 4 0 2 1 1 4 5 3 1 1 2 6 0 2 5 2 0 5 0
Normal 190
[image:4.612.42.290.420.590.2]International Journal of Emerging Technology and Advanced Engineering
Website: www.ijetae.com (ISSN 2250-2459, ISO 9001:2008 Certified Journal, Volume 3, Issue 5, May 2013) In the last process of model we will evaluate and
[image:5.612.73.265.206.374.2]compare results of clustering data. Clustering results are evaluated by comparing the intrusion and normal packets from clustering . All processes about C means are shown in figure .
Fig: Process diagram for C means
Data sets and Implementations
1 Large Data Set Selection
This research uses large data sets from KDD cup database .The above state diagram i.e K-means Algorithm process model that contain 6 selected features related to packets . These selected features are: PacketPort , PacketBaseIP , PacketIP, PacketProtocol, PacketType, PacketSize .
2 Data Preprocessing
The first process for data mining is data preprocessing that researchers will prepare the data sets for use in data mining processes. Researchers have to set clear criteria to filter all data sets suitable to the research objectives. The first step in data preprocessing is the data cleansing process that gets rid of noise and outlier. Then data has been reduced and transformed into the format that is appropriate for data mining software to analyze and clustering
3 Feature Selection with Apriori-based Algorithm
In the continuing step of Processing model is feature selection processing. The set of feature selection rules are generated by the association technique with Apriori-based algorithm.
With Apriori-based algorithm used to analyze and generate features that are related and affect to other features in the group, more effective action in association technique is required. We have to filter the rules that appropriate to research objective. In this research our aim is to finding features that affect performance of packets. So all features from KDD Cup selection will be used to calculate the associate rules with Apriori-based to get related features for clustering.
Feature Selection Criteria for C means :
1) The size of minimum packet is 30 and maximum is 5000 above this would be treat as a false packets. 2)The minimum port for sending the packets is 150
below ports would be discarded.
3)If rejected protocol = “udp domain ” then it would be treat as a rejected protocol
4)If the given port = {246, 220, 324} then it would be a normal packets .
5)The number of iterations performed =4
4 Clustering by C-means Clustering Methodology
The final process in the model is clustering selected data with the means clustering method. We implement the C-means clustering algorithm with the Erlang programming language. Finding the initial center vectors from the given packets first and then applying C means on same datasets. After doing these things we are getting these packets in two clusters like intrusion and normal packets.
Fig 4.5 : Before Clustering
[image:5.612.337.549.469.602.2]International Journal of Emerging Technology and Advanced Engineering
[image:6.612.329.559.128.354.2] [image:6.612.59.280.300.448.2]Website: www.ijetae.com (ISSN 2250-2459, ISO 9001:2008 Certified Journal, Volume 3, Issue 5, May 2013) Table number 2
File Size (kb) 3 8 4 2 5 5 4 3 5 8 6 0 5 5 1 2 5 1 1 0 2 2 5 1 3 0 1 5 0 2 1 0 1 5 0 1 4 5 1 6 0 Intr usio n C 1 0 8 1 0 5 1 2 5 1 1 0 1 4 0 1 2 0 1 1 5 3 2 0 3 4 6 3 8 5 3 1 0 3 2 0 5 2 0 3 3 5 5 6 0 3 5 0 Nor mal 9 7 5 7 1 1 0 1 0 8 1 3 0 1 4 5 1 3 7 2 8 0 3 2 5 4 2 0 3 0 9 3 7 0 4 7 5 3 6 0 6 8 5 3 6 0
Now, based on these figures we plot the graph of intrusion and the normal packets of the given datasets.
Fig : after applying C means Clustering
III. EXPERIMENTAL RESULTS
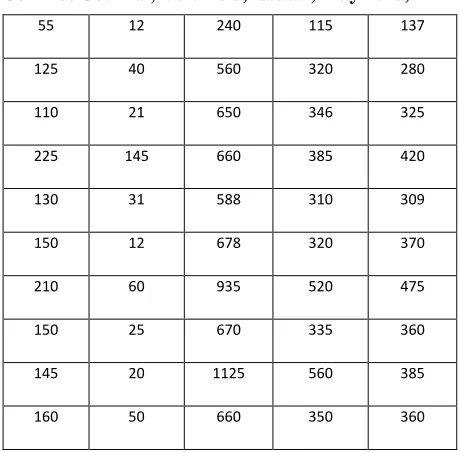
[image:6.612.334.554.399.538.2]The experimental results shows the difference between the K means and the C means clustering algorithms .Just refer the below table (table number 3 ) knows the differences between K means & C means.
Table number 3
File Size (KB) Intrusion K Normal (by using K means) Intrusion C Normal (by using C means)
38 15 190 108 97
42 12 150 105 57
55 10 225 125 110
43 8 210 110 108
58 20 250 140 130
60 10 255 120 145
55 12 240 115 137
125 40 560 320 280
110 21 650 346 325
225 145 660 385 420
130 31 588 310 309
150 12 678 320 370
210 60 935 520 475
150 25 670 335 360
145 20 1125 560 385
160 50 660 350 360
Now, based on these figures we plot the graph of intrusion and the normal packets of k means and c means together from the given datasets.
Fig : K-means Vs C-means
The experimental results show the difference between the K means and the C means clustering algorithms. With the help of these differences, knows the work culture of both.
IV. CONCLUSION
[image:6.612.57.286.542.730.2]International Journal of Emerging Technology and Advanced Engineering
Website: www.ijetae.com (ISSN 2250-2459, ISO 9001:2008 Certified Journal, Volume 3, Issue 5, May 2013) The preprocessing added the association rules obtained
from Apriori-based algorithm in feature selection to get better feature set. In the clustering process we used random data to generate initial centroids and vectors that works better for data sets. The performance can be measure on the number of intrusion packets in a less time. The experimental results show the work differences between the K means and the C means clustering algorithms and betterness .
REFERENCES
[1] Han J. and Kamber M.(2001). Data Mining : concept and techniques CA: Academic Press.
[2] Noppol Thangsupachai, Phichayasini Kitwatthanathawon, Supachanun Wanapu, and Nittaya Kerdprasop , on “ Clustering Large Datasets with Apriori-based Algorithm and Concurrent Processing” ,IMECS 2011, March 16-18 , 2011,Hong Kong. [3] S. Anitha Elavarasi, Dr. J. Akilandeswari, Dr. B. Sathiyabhama on
“A Survey on Partition Clustering Algorithms” IJECBS Vol. 1 Issue 1 January 2011 .
[4] Pradeep Rai & Shubha Singh,” A Survey of Clustering Techniques”,IJCA, Volume 7– No.12, October 2010.
[5] Lu,Lin Sch. of Inf. & Control Eng., Xi''an Univ. of Archit. & Technol Xi''an, China Liu, Pei-qi , on “Stduy on an improved apriori algorithm and its application in supermarket “Information Sciences and Interaction Sciences (ICIS), 2010 3rd International Conference , 23-25 June 2010
[6] Wu X. and Kumar V., The top ten algorithms in data mining. USA: CRC Press, 2009, p. 21, p. 93.
[7] Wang J., Data warehousing and mining : concepts, methodologies, tools, and applications. USA: Information Science Reference, 2009, pp. 303-335.
[8] Chen Zhang Sch. of Comput. Sci. & Technol., China Univ. of Min. & Technol., Xuzhou Shixiong Xia , on “K-means Clustering Algorithm with Improved Initial Center” Knowledge Discovery and Data Mining, 2009. WKDD 2009. 23-25 Jan. 2009
[9] Taniar D., Data mining and knowledge discovery technologies. USA: IGI Pub, 2008, pp. 118-142.
[10] Lawrence K.D., Kudyba S. and Klimberg R.K., Data mining methods and applications. USA: Auerbach Publications, 2008, pp. 83-104.
[11] Tan,Steinbach and Ghosh Kumar ,on ” Top Ten Data Mining Algorithms” Dec 2006.
[12] Wang,Weina Dept. of Appl. Math., Dalian Maritime Univ. Zhang, Yun-Jie; Li, Yi; Zhang,Xiaona on “The Global Fuzzy C-Means Clustering Algorithm Intelligent Control and Automation, 2006. WCICA 2006,
[13] Cebron, Nicolas Dept. of Comput. & Inf. Sci., Konstanz Univ. Berthold,MichaelR. on “Adaptive Fuzzy Clustering “ Fuzzy Information Processing Society, 2006. NAFIPS 2006, 3-6 June 2006 [14] Tan , Steinbach and Kumar , on ”Introduction to Data Mining” Apr
2004.
[15] Tapas Kanungo, Senior Member, IEEE, David M. Mount, Member, IEEE, Nathan S. Netanyahu, Member, IEEE, Christine D. Piatko, Ruth Silverman, and Angela Y. Wu, Senior Member, IEEE VOL. 24, NO. 7, JULY 2002
[16] Hung,Ming-Chuan Dept. of Inf. Eng., Feng Chia Univ.,Taichung,Taiwan Yang, Don-Lin L. on “An efficient Fuzzy C-Means clustering algorithm “ Data Mining, 2001. ICDM 2001, Proceedings IEEE International Conference , 2001
[17] R. Agrawal, R. Srikant, “Fast algorithms for mining association rules”, in: Proceedings of the 20th International Conference on Very Large Data Bases (VLDB), 1994, pp. 487–499.
[18] Data mining concept A.K. Pujari.
[19] www.faculty.uscupstate.edu/atzacheva/SHIM450/KMeansExample. doc