Journal of Chemical and Pharmaceutical Research, 2015, 7(6):42-54
Research Article
CODEN(USA) : JCPRC5
ISSN : 0975-7384
Formulation and evaluation of controlled release matrix tablet of Salbutamol
Sulphate using various cellulose polymers
V. Kamalakkannan*
1, P. Venkatraman
1, R. Sivaprakash
1, R. Sambath Kumar
1and K. S. G. Arul Kumaran
21Department of Pharmaceutics, J. K. K. Nataraja College of Pharmacy, Komarapalayam, Namakkal (Dt),
Tamilnadu, India
2Department of Pharmaceutics, K. M. C. H College of Pharmacy, Coimbatore, Tamilnadu, India
_____________________________________________________________________________________________
ABSTRACT
The objective of this study was to formulate and evaluate Salbutamol sulphate, controlled-release matrix tablets dosage form, for the treatment of Chronic Obstructive Pulmonary Disease (COPD), anti asthmatic and bronchodilator agent . The CR tablets were prepared by Wet granulation method using three polymers such as hydroxyl propyl methyl cellulose (HPMC), carboxyl methyl cellulose (CMC) and Methyl cellulose (MC) in varying ratios. Powder blends were evaluated compressibility index and angle of repose, shows satisfactory results. The compressed tablets were then evaluated for various physical tests like content uniformity, drug content uniformity, thickness, uniformity of weight, hardness, and drug content. The results of all these tests were found to be satisfactory. The in vitro dissolution study was carried out for 24 hours using type II dissolution apparatus. Among all the formulation, CMC VI was found to be 96.49% of drug release at the end of 8 hours. This finding reveals that above a particular concentration of CMC and HPMC are capable of providing controlled drug release.
Keywords: Salbutamol sulphate, hydroxyl propyl methyl cellulose, Methyl cellulose, carboxyl methyl cellulose and
matrix tablets.
_____________________________________________________________________________________________
INTRODUCTION
EXPERIMENTAL SECTION
Formulation of Matrix Tablets by Wet granulation
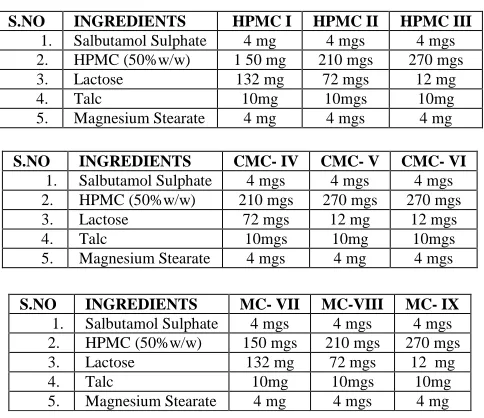
[image:2.595.186.428.200.409.2]The drug salbutamol sulphate, polymer and lactose were powdered well in a mortar. They were mixed by geometrical mixing. The granulating agent, alcohol: water (3:1) mixture was sprayed on to the powder mixture little by little and blended manually to get a coherent mass. The mass was passed through No.10 sieve to get the granules. The granules were dried in a hot air oven below 60°C. [10]The dry granules were passed through No.20 sieve and retained on No.85 sieve. The talc and magnesium stearate were added and mixed with the granules. The granules were compressed into tablets in single punch tablet machine.(Table 1)
Table 1: Formulation variables of matrix tablets
S.NO INGREDIENTS HPMC I HPMC II HPMC III
1. Salbutamol Sulphate 4 mg 4 mgs 4 mgs
2. HPMC (50%w/w) 1 50 mg 210 mgs 270 mgs
3. Lactose 132 mg 72 mgs 12 mg
4. Talc 10mg 10mgs 10mg
5. Magnesium Stearate 4 mg 4 mgs 4 mg
S.NO INGREDIENTS MC- VII MC-VIII MC- IX
1. Salbutamol Sulphate 4 mgs 4 mgs 4 mgs
2. HPMC (50%w/w) 150 mgs 210 mgs 270 mgs
3. Lactose 132 mg 72 mgs 12 mg
4. Talc 10mg 10mgs 10mg
5. Magnesium Stearate 4 mg 4 mgs 4 mg
Physico-Chemical Evaluation of Matrix Tablets[11-15]
Uniformity of Weight: Twenty tablets were selected at random individually weighed and the average weight was
calculated. The uniformity of weight was determined according to IP specification. As per I.P. not more than two of individual weights should deviate from average weight by more than 7.5% and none deviate more than twice that percentage (15%)14b.
Drug Content Uniformity: Ten tablets were selected at random from each batch. The drug content of each tablet
was determined as follows 28a. The tablet was crushed and put into 0.1N HCI. The volume was adjusted to 50ml using 0.1N HCI. Shaken well for 5 minutes and filtered. 5ml of the filtrate was taken and diluted to 100ml. The absorbance was measured at 276nm.
Hardness: Three tablets were taken from each batch and tested for hardness using Monsanto tablet hardness tester. Thickness: Three tablets were taken from each batch and thickness was measured using vernier caliper.
Invitro Drug Release Studies: Dissolution apparatus UPS (XXIII) model was used for carrying out in vitro drug
release studies on the prepared batches of tablets. 900ml of Hydrochloric acid buffer solution pH 1.2 was used. The paddle was rotated at 50rpm. After 2 hours the dissolution medium was changedpH7.2 phosphate buffer. The dissolution was continued fluid until the tablet completely eroded and dissolved. The temperature of the dissolution
fluid was maintained at 37°C ± 1°C throughout the study 17. 5ml samples were drawn at periodic intervals viz. 1st,
2nd, 3rd, 4th, 5th, 6th,, 7th, and 8th hours and it was made up to 10ml with buffer solution. 5ml of fresh dissolution
medium was replaced after each time the sample was drawn. The samples were analyzed spectrophotometrically at 276nm for the drug content against the respective buffer blank. The percentage of salbutamol sulphate released at various time intervals was calculated and plotted against time.
Kinetics of Drug Release: The order of drug release can be assessed by graphical treatment of the drug release
data.[16] A plot of percentage drug remaining versus time would be linear if the drug release follows zero order (i.e. concentration independent release).The linear equation for zero order drug release plot is
S.NO INGREDIENTS CMC- IV CMC- V CMC- VI
1. Salbutamol Sulphate 4 mgs 4 mgs 4 mgs
2. HPMC (50%w/w) 210 mgs 270 mgs 270 mgs
3. Lactose 72 mgs 12 mg 12 mgs
4. Talc 10mgs 10mg 10mgs
Ct = Cone, remaining at time t, C0= Original cone, t= time, K = release rate
A plot of log of percentage remaining drug versus time would be linear, if the drug release follows first order (i.e., cone dependent release)The linear equation for first order drug release plot is
Kt log C=logCo - ———— 2.302
Accelerated Stability Studies: The selected formulation HPMC-II, CMC-IV and MC-IX were stored at various
temperature conditions such as 29°c, 37°c, & 45°c .[17] The stored tablets were examined for 4 weeks for their stability.
RESULTS AND DISCUSSION
Uniformity of Weight: All the batches of tablets were found to pass the weight variation test. (table 2)The
percentage deviation of individual tablet weight from the average tablet weight was found to be within the I.P. limits (±7.5%).
Table 2: Uniformity of Weight
Batch Code Weight in mg
HPMC I1HPMC I20 298.95 mg
HPMC II1 -HPMC II20 299.1 5 mg
HPMC III1 -HPMC III 20 298.4 mg
CMC IV1 -CMC IV20 298.85 mg
CMC V1 -CMC V20 298.75 mg
CMC VI1-CMC VI20 299.5 mg
MC VII1-MC VII20 299.7 mg
MCVIII1-MC VIII20 299.85 mg
MC IX1 -MC IX20 299.8 mg
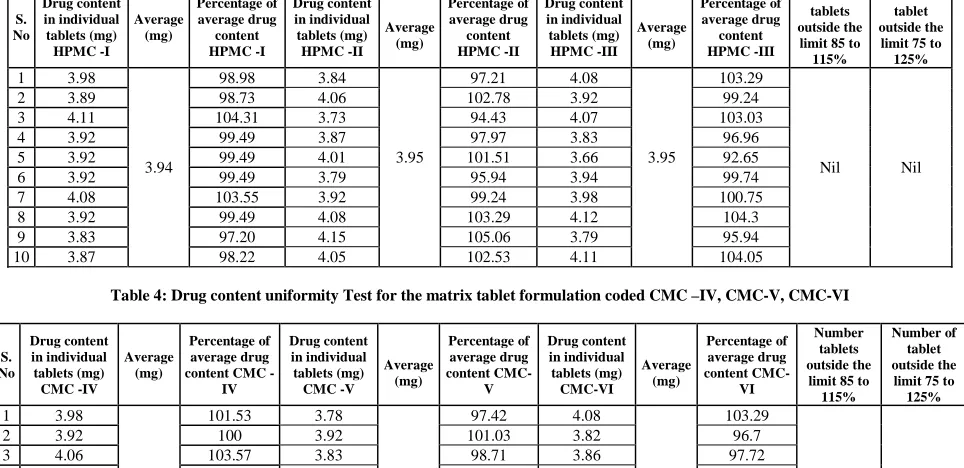
Table 3: Drug content uniformity Test for the matrix tablet formulation coded HPMC -I, HPMC-II, HPMC-III
S. No Drug content in individual tablets (mg) HPMC -I Average (mg) Percentage of average drug content HPMC -I Drug content in individual tablets (mg) HPMC -II Average (mg) Percentage of average drug content HPMC -II Drug content in individual tablets (mg) HPMC -III Average (mg) Percentage of average drug content HPMC -III Number tablets outside the
limit 85 to 115%
Number of tablet outside the
limit 75 to 125%
1 3.98
3.94
98.98 3.84 97.21 4.08 103.29
Nil Nil
2 3.89 98.73 4.06 102.78 3.92 99.24
3 4.11 104.31 3.73 94.43 4.07 103.03
4 3.92 99.49 3.87 97.97 3.83 96.96
5 3.92 99.49 4.01 3.95 101.51 3.66 3.95 92.65
6 3.92 99.49 3.79 95.94 3.94 99.74
7 4.08 103.55 3.92 99.24 3.98 100.75
8 3.92 99.49 4.08 103.29 4.12 104.3
9 3.83 97.20 4.15 105.06 3.79 95.94
[image:3.595.66.548.432.666.2]10 3.87 98.22 4.05 102.53 4.11 104.05
Table 4: Drug content uniformity Test for the matrix tablet formulation coded CMC –IV, CMC-V, CMC-VI S. No Drug content in individual tablets (mg) CMC -IV Average (mg) Percentage of average drug content CMC
-IV Drug content in individual tablets (mg) CMC -V Average (mg) Percentage of average drug content CMC-V Drug content in individual tablets (mg) CMC-VI Average (mg) Percentage of average drug content CMC-VI Number tablets outside the limit 85 to 115%
Number of tablet outside the limit 75 to 125%
1 3.98
3.92
101.53 3.78 97.42 4.08 103.29
Nil Nil
2 3.92 100 3.92 101.03 3.82 96.7
3 4.06 103.57 3.83 98.71 3.86 97.72
4 3.84 97.95 3.97 102.31 3.84 97.21
5 4.04 103.06 3.93 3.88 101.28 4.04 3.95 102.27
6 3.76 95.91 3.77 97.16 4.06 102.78
7 3.82 97.44 3.85 99.22 4.02 106.32
8 3.98 101.53 3.85 99.22 3.88 98.22
9 3.91 99.74 3.96 102.06 4.05 102.53
Drug Content Uniformity: The drug content uniformity was examined as per I.P specification. All the batches of
tablet were found to comply with uniformity of content test. (table 3,4,5)None of the individual drug content values was outside the 85 to 115% of the average drug content.
Table 5: Drug content uniformity Test for the matrix tablet formulation coded MC –VII, MC-VIII, MC-XI
S. No Drug content in individual tablets (mg) MC -VII Average (mg) Percentage of average drug content MC
-VII Drug content in individual tablets (mg) MC -VIII Average (mg) Percentage of average drug content CMC-VIII Drug content in individual tablets (mg) MC-XI Average (mg) Percentage of average drug content MC-XI Number tablets outside the limit 85 to 115%
Number of tablet outside the
limit 75 to 125%
1 4.05
3.96
102.27 4.08 102.25 3.82 97.2
Nil Nil
2 3.85 97.22 3.82 95.73 4.08 103.81
3 4.16 105.05 4.06 101.75 3.98 101.27
4 4.04 102.02 3.74 93.73 3.72 94.65
5 3.98 100.5 4.15 104.01 4.06 103.3
6 3.72 93.93 3.95 3.99 98.99 3.84 3.93 97.7
7 4.12 104.04 4.12 103.25 4.12 104.83
8 3.98 100.5 3.98 99.74 3.98 101.27
9 3.83 96.71 3.85 96.49 3.95 100.5
10 3.87 97.72 4.15 104.01 3.75 95.41
Hardness: Tablet require a certain amount of strength or hardness and resistance to friability to withstand
mechanical shocks of handling in manufacture, packaging and shipping. The device used for measuring the tablets is
'Monsanto tester114b.
Table 6: Hardness test of formulations
Batch Code Average hardness of tablets (in kg/cm2) Standard deviation
HPMC-I 2.53 ± 0.2776
HPMC II 2.53 ± 0.2776
HPMC-III 2.7 ±0.2817
CMC – IV 2.4 ±0.2812
CMC-V 2.2 ±0.2812
CMC –IV 2.2 ±0.2812
MC – VII 3.9 ±0.2997
MC – VIII 3.9 ±0.2997
MC – IX 3.8 ±0.2958
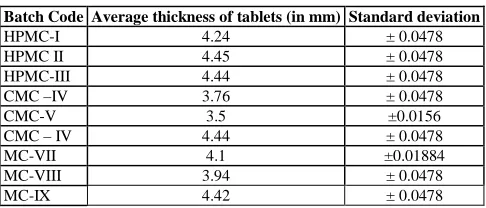
Thickness: Three tablets were taken from each batch and thickness was measured using verniercalipher. The
[image:4.595.185.428.513.617.2]observations are presented
Table 7 : Thickness of formuations
Batch Code Average thickness of tablets (in mm) Standard deviation
HPMC-I 4.24 ± 0.0478
HPMC II 4.45 ± 0.0478
HPMC-III 4.44 ± 0.0478
CMC –IV 3.76 ± 0.0478
CMC-V 3.5 ±0.0156
CMC – IV 4.44 ± 0.0478
MC-VII 4.1 ±0.01884
MC-VIII 3.94 ± 0.0478
MC-IX 4.42 ± 0.0478
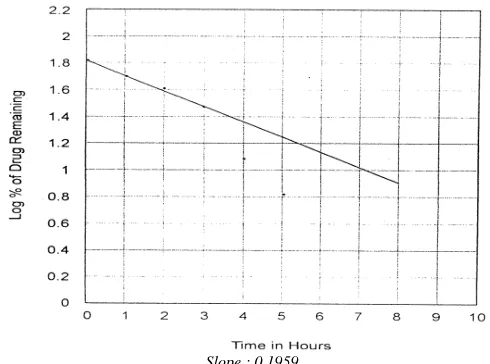
Invitro Drug Release Studies
Table 8: In-vitro release Date of Salbutamol Sulphate from Matrix tablets prepared from HPMC (50%
w/w).(Dissolution medium Hydrochloric acid buffer (pH1.2) for 1st2hrs and phosphate buffer (pH 7.2) thereafter)
Table 8
Time in hours
Cumulative amount of drug released in mg
Percentage of drug released
Percentage of drug remaining
Log percentage of drug remaining
1 1.43 35 63 1.806
2 1.97 49.4 50.4 1.7031
3 2.87 71 27 1.447
4 3.23 80 18 1.2786
5 3.5 89 9 0.9
6 3.6 92.4 7.4 0.874
7 3.71 92 6 0.844
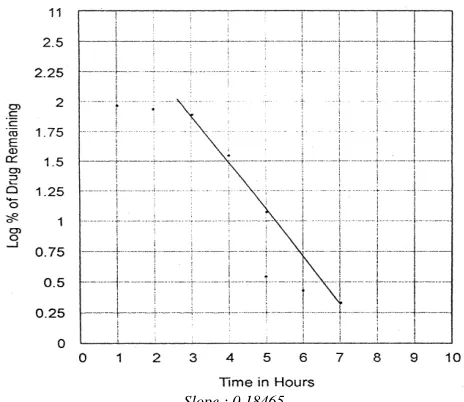
[image:5.595.181.428.210.395.2]8 3.74 93.4 6.24 0.7954
Fig. 1: Plot Showing Relation Between Log% Amount remaining to be Released vs. time
[image:5.595.150.461.433.534.2]Slope : 0.1506 Regression Coefficient : 0.9738
Table 9: In-vitro release Date of Salbutamol Sulphate from Matrix tablets prepared from HPMC(70% w/w).(Dissolution medium Hydrochloric acid buffer (pH1.2) for 1st2hrs and phosphate buffer (pH 7.2) thereafter) Batch Code :HPMC – II
Time in hours Cumulative amount of drug released in mg
Percentage of drug released
Percentage of drug remaining
Log percentage of drug remaining
1 1.25 31.44 68.44 1.8344
2 1.64 40.44 59.4 1.7742
3 2.15 53 45 1.6616
4 2.87 71 27 1.4469
5 3.41 85.4 14.4 1.1602
6 3.6 92.4 7.4 0.874
7 3.95 98 0.9 0
[image:5.595.180.425.560.742.2]8 3.94 98 0.4 0
Fig. 2: Plot Showing Relation Between Log% Amount remaining to be Released vs. time
Table 10: In-vitro release Date of Salbutamol Sulphate from Matrix tablets prepared from HPMC(90% w/w).(Dissolution medium Hydrochloric acid buffer (pH1.2) for 1st2hrs and phosphate buffer (pH 7.2) thereafter) Batch Code :HPMC – lll
Time in hours Cumulative amount of drug released in mg
Percentage of drug released
Percentage of drug remaining
Log percentage of drug remaining
1 0.45 11.14 88.69 1.948
2 0.72 14 81 1.9137
3 1.26 31.4 68.4 1.8355
4 1.8 44 54 1.7402
5 2.16 52 44 1.6626
6 2.88 70 26 1.447
7 3.24 80 17 1.2786
8 3.6 89 9 0.9
Fig. 3: Plot Showing Relation Between Log% Amount remaining to be Released vs time
Slope : 0.1316 Regression Coefficient : 0.9624
Fig. 4: Plot Showing Relation Between Log% Amount remaining to be Released vs time
[image:6.595.189.421.465.666.2]Table 11: In-vitro release Date of Salbutamol Sulphate from Matrix tablets prepared from CMC(50% w/w).(Dissolution medium Hydrochloric acid buffer (pH1.2) for 1st2hrs and phosphate buffer (pH 7.2) thereafter) Batch Code :CMC – IV
Time in hours Cumulative amount of drug released in mg
Percentage of drug released
Percentage of drug remaining
Log percentage of drug remaining
1 0.35 8 90 1.958
2 0.74 17 81 1.9137
3 1.25 31.4 68.4 1.8355
4 2.14 53 45 1.6626
5 3.41 85.4 14.4 1.1612
6 3.85 96.4 3.4 0.543
7 3.87 96 4 0.477
[image:7.595.181.430.355.565.2]8 3.91 97 1 0.3
Table 12: In-vitro release Date of Salbutamol Sulphate from Matrix tablets prepared from CMC(70% w/w).(Dissolution medium Hydrochloric acid buffer (pH1.2) for 1st2hrs and phosphate buffer (pH 7.2) thereafter) Batch Code :CMC - V
Time in hours Cumulative amount of drug released in mg
Percentage of drug released
Percentage of drug remaining
Log percentage of drug remaining
1 0.17 4.4 95.4 1.97
2 0.8 22.4 77.4 1.8892
3 1.25 40.4 59.4 1.7744
4 2.51 62 36 1.5681
5 3.23 80 18 1.2786
6 3.5 89 9 0.9
7 3.5 97.4 2.4 0.3978
8 3.93 98 1.4 0.175
Fig. 5: Plot Showing Relation Between Log% Amount remaining to be Released vs time
Slope : 0.1982 Regression Coefficient : 0.9698
Table 13: In-vitro release Date of Salbutamol Sulphate from Matrix tablets prepared from CMC(90% w/w).(Dissolution medium Hydrochloric acid buffer (pH1.2) for 1st2hrs and phosphate buffer (pH 7.2) thereafter) Batch Code :CMC -VI
Time in hours Cumulative amount of drug released in mg
Percentage of drug released
Percentage of drug remaining
Log percentage of drug remaining
1 0.17 4.4 95.4 1.97
2 0.53 13.4 86.4 1.9323
3 1.25 31.4 68.4 1.8355
4 1.7 44 54 1.7402
5 2.51 62 36 1.5681
6 3.05 76.4 23.4 1.37
7 3.41 85.4 14.4 1.1612
[image:7.595.151.461.603.702.2]Fig. 6: Plot Showing Relation Between Log% Amount remaining to be Released vs time
[image:8.595.186.427.454.638.2]Slope : 0.1373 Regression Coefficient : 0.9762
Table 14: In-vitro release Date of Salbutamol Sulphate from Matrix tablets prepared from MC(50% w/w).(Dissolution medium Hydrochloric acid buffer (pH1.2) for 1st2hrs and phosphate buffer (pH 7.2) thereafter) Batch Code :MC - VII
Time in hours Cumulative amount of drug released in mg
Percentage of drug released
Percentage of drug remaining
Log percentage of drug remaining
1 2.6 67.4 32.4 1.5118
2 3.7 94 4 0.6988
3 3.81 95.4 4.4 0.6531
4 3.84 96.24 3.74 0.573
5 3.86 96.74 3.24 0.5117
6 3.88 97.24 2.74 0.4392
7 3.9 97.74 2.24 0.352
8 3.91 97 1 0.3
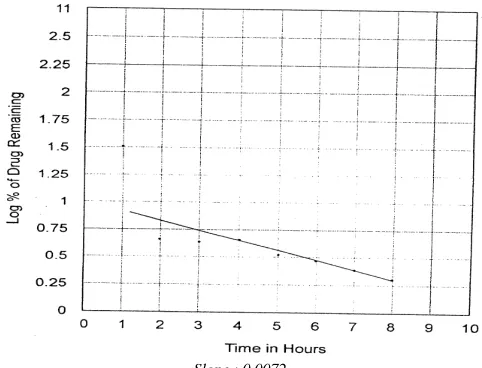
Fig. 7: Plot Showing Relation Between Log% Amount remaining to be Released vs time
Table 15: In-vitro release Date of Salbutamol Sulphate from Matrix tablets prepared from MC(70% w/w).(Dissolution medium Hydrochloric acid buffer (pH1.2) for 1st2hrs and phosphate buffer (pH 7.2) thereafter) Batch Code :MC – VIII
Time in hours Cumulative amount of drug released in mg
Percentage of drug released
Percentage of drug remaining
Log percentage of drug remaining
1 2.15 53 45 1.6626
2 3.23 80 18 1.2786
3 3.75 93 5 0.778
4 3.4 94 4 0.6988
5 3.81 95.4 4.4 0.601
6 3.83 95 3 0.6531
7 3.86 95.74 3.24 0.5117
8 3.88 96.25 2.74 0.4392
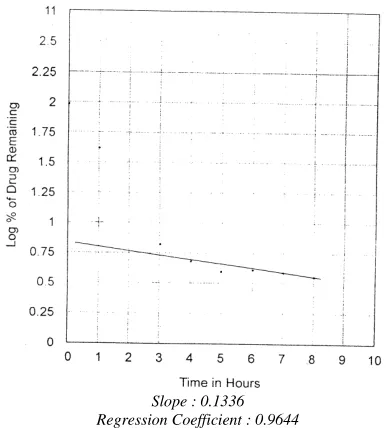
Fig. 8: Plot Showing Relation Between Log% Amount remaining to be Released vs time
[image:9.595.207.401.217.431.2]Slope : 0.1336 Regression Coefficient : 0.9644
Table 16: In-vitro release Date of Salbutamol Sulphate from Matrix tablets prepared from MC(90% w/w).(Dissolution medium Hydrochloric acid buffer (pH1.2) for 1st2hrs and phosphate buffer (pH 7,2) thereafter) Batch Code :MC - IX
Time in hours Cumulative amount of drug released in mg
Percentage of drug released
Percentage of drug remaining
Log percentage of drug Remaining
1 1.7 44 55 1.7403
2 2.87 71 28 1.4417
3 3.23 80 19 1.2787
4 3.5 89 10 1
5 3.86 95.75 3.25 0.5118
6 3.95 98 1 0
7 3.85 98 1 0
Fig. 9: Plot Showing Relation Between Log% Amount remaining to be Released vs time
Slope : 0.29041 Regression Coefficient : 0.8920
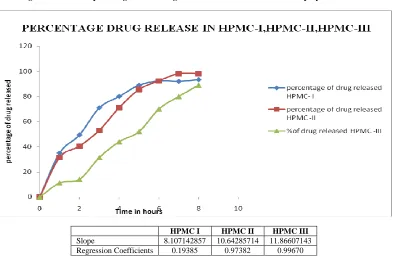
Fig 10: Plot showing relation between percentage amount drug released vs time from matrix tablets prepared from HPMC Batch (I-III)
HPMC I HPMC II HPMC III
Slope 8.107142857 10.64285714 11.86607143
Regression Coefficients 0.19385 0.97382 0.99670
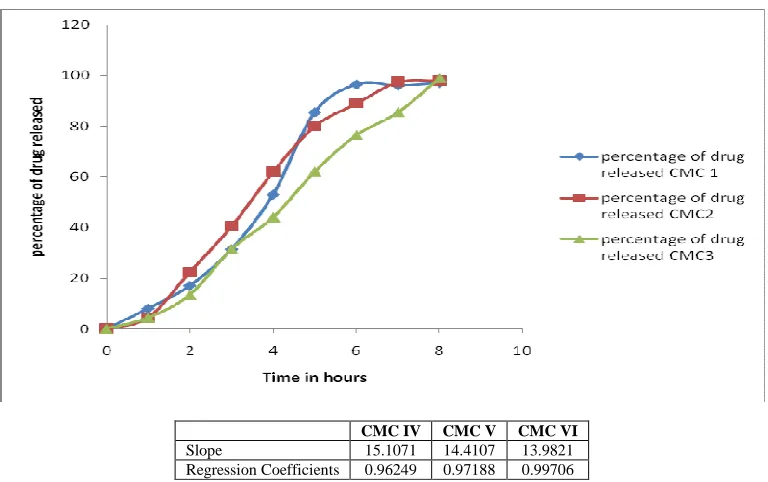
[image:10.595.112.506.310.570.2]Fig 11: Plot showing relation between percentage amount drug released vs time from matrix tablets prepared from CMC Batch (IV-VI)
CMC IV CMC V CMC VI
Slope 15.1071 14.4107 13.9821
Regression Coefficients 0.96249 0.97188 0.99706
Fig 12: Plot showing relation between percentage amount drug released vs time from matrix tablets prepared from MC Batch (VII-IX)
MC VII MC VIII MC IX
Slope 1.7083 4.4107 6.8303
Regression Coefficients 0.68042 0.78076 0.8776
[image:11.595.136.478.351.590.2]Table 17: Data of determination of order of drug release
Batch code Regression Coefficient of zero order plot Regression coefficient of first order plot Order of Drug release
HPMC I 0.91385 0.9738 First Order
HPMC II 0.97382 0.97098 Zero Order
HPMC III 0.99670 0.9624 Zero Order
CMC IV 0.96249 0.9762 First Order
CMC V 0.97188 0.9698 Zero Order
CMC VI 0.99706 0.96439 Zero Order
MC VII 0.68042 0.9038 First Order
MCVIII 0.78076 0.9644 First Order
[image:12.595.125.492.149.675.2]MC IX 0.8776 0.8920 First Order
Table 18: Batch Code HPMC II
S. No. Temp in C No. of weeks Drug concentration in mg Drug concentration in percentage
1 Initial 0 4 100
2 29oC
1 2 3 4 3.99 3.98 3.96 3.95 99.75 99.5 99 98.75
3 37oC
1 2 3 4 3.91 3.85 3.79 3.72 97.75 96.25 94.75 93
4 45oC
1 2 3 4 3.82 3.75 3.70 3.68 95.5 93.75 92.5 92
Table 19: Batch Code CMC – VI
S. No. Temp in C No. of weeks Drug concentration in mg Drug concentration in percentage
1 Initial 0 3.99 99.75
2 29oC
1 2 3 4 3.98 3.96 3.95 3.94 99.5 99 98.75 98.5
3 37oC
1 2 3 4 3.91 3.85 3.79 3.76 97.75 96.25 94.75 94
4 45oC
1 2 3 4 3.82 3.75 3.70 3.60 95.5 93.75 92.5 90
Table 20: Batch Code MC - IX
S. No. Temp in C No. of weeks Drug concentration in mg Drug concentration in percentage
1 Initial 0 3.95 98.75
2 29oC
1 2 3 4 3.94 3.9 3.87 3.8 98.5 97.5 96.75 95
3 37oC
1 2 3 4 3.81 3.79 3.66 3.6 95.25 94.75 91.5 90
4 45oC
1 2 3 4 3.59 3.58 3.56 3.52 89.7 89.5 89 88
ACCELERATED STABILITY STUDIES
CONCLUSION
From the above results and discussion, it is concluded that the sustained release matrix tablet of Salbutamol sulphate containing HPMC (Formulation coded HPMC-II) which are taken as ideal or optimized formulation of sustained release matrix tablet for 12 h release as it fulfils all the requirements for sustained release tablet and appears to be assessed further by conducting bioavailability studies in human volunteers and long term stability testing.
Acknowledgments
The authors are thankful to the principal, Staffs and management J. K. K. Nattraja College of Pharmacy for providing all facilities to carry out the remaining part of the research work.
REFERENCES
[1]N. Udupa, et. al., The Eastern pharmacist; Dec. 1987. 30 (360) P.No 129-132.
[2]G.M. Chauhan, Devanjalishah, et. al., The Eastern pharmacist; Jan. 1995, 38 (445) P.No 191-193.
[3]Alfred martin, James swarbricket. al. physical pharmacy. Third Edition, 1994, P.No. 352-362.
[4]Tahara,K.Yamamoto.K.et.al. European – journal of pharmaceutical sciences; 1996, 4 (1) P.No. 39-48
[5]Yie. W.Chien, Novel Drug DeliverysystemsecondEdition,1992, P.No.a).139-141 b) 2-37
[6]Sheskey PJ and Williams D.M. et. al. pharmaceutical Technology Mar. 1996 (20) P.No. 80, 82, 84, 86, 88,90,92.
[7]Srinivas; The Eastern pharmacist , Feb,2000, P.No. 109 - 111.
[8]N-Udupa, K.Nalini, et. al. Indian, Drug, Oct. 1991, 29 (6) P.No. 287-290.
[9]Gilberls Banker et. al. modern pharmaceutics second Edition 1990. P.No.647-649.
[10]Martindale, The Extra pharmacopoeia 28th Edition, 1982, P.No.29,30.
[11]Farid; Indian journal of pharmaceutical sciences Dec 1998 P. No: 375-378.
[12]Asgar All, S.N. Sharma, et. al. Eastern Pharmacist; Jan 1991, (445) P.No. 69-74.
[13]ArchanaGarg, V.C. Saksena. et. al. The Eastern pharmacist, June 1992, 35 (414) P.No.37-40.
[14]Abdel raheem; Pharmaceutical actahelvetiae Feb 1997, P.No.159-164
[15]S.K. Ghosal, K.Ruchman; et. al. The Eastern pharmacist. Nov 1995, 38 (447) P.No. 137-139.
[16]Kual. D. Venkataram. et. al. Indian - Journal of Pharmaceutical sciences 1994, 56 (1) P.No. 15-18.