Citation:
Wilkins, EL and Morris, M and Radley, D and Griffiths, C (2019) Methods of measuring associations between the Retail Food Environment and weight status: importance of classifications and metrics. SSM - Population Health. ISSN 2352-8273 DOI: https://doi.org/10.1016/j.ssmph.2019.100404 Link to Leeds Beckett Repository record:
http://eprints.leedsbeckett.ac.uk/5866/
Document Version: Article
Creative Commons: Attribution-Noncommercial-No Derivative Works 4.0
The aim of the Leeds Beckett Repository is to provide open access to our research, as required by funder policies and permitted by publishers and copyright law.
The Leeds Beckett repository holds a wide range of publications, each of which has been checked for copyright and the relevant embargo period has been applied by the Research Services team.
We operate on a standard take-down policy. If you are the author or publisher of an output and you would like it removed from the repository, please contact us and we will investigate on a case-by-case basis.
1
Methods of measuring associations between the Retail
Food Environment and weight status: importance of
classifications and metrics
Emma Wilkins1*, Michelle Morris2, Duncan Radley1, Claire Griffiths1.
1Carnegie School of Sport, Leeds Beckett University, Leeds, UK
2 Leeds Institute for Data Analytics, School of Medicine, University of Leeds, Leeds, UK.
*Corresponding author: [email protected]; Leeds Beckett University, Headingley Campus, Headingley, Leeds, LS6 3QS
Running Title: Importance of retail food environment measures
Funding: This research did not receive any specific grant from funding agencies in the public, commercial, or not-for-profit sectors.
Disclosure: The authors declared no conflict of interest.
Contributions: EW, MM, DR and CG were responsible for study conception and design. EW coordinated the review and acted as the primary reviewer. All other authors contributed
as secondary reviewers. EW led the writing of the manuscript. All other authors provided
critical feedback to shape the manuscript.
Acknowledgements: We would like to acknowledge that The Yorkshire Health Study was funded by the NIHR CLAHRC Yorkshire and Humber (www.clahrc-yh.nihr.ac.uk). The views
expressed are those of the author(s), and not necessarily those of the NHS, the NIHR or the
Department of Health and Social Care. We would also like to thank Ordnance Survey for
2
Methods of measuring associations between the Retail
Food Environment and weight status: importance of
classifications and metrics
Abstract
Despite considerable research, evidence supporting associations between the ‘Retail Food
Environment’ (RFE) and obesity remains mixed. Differences in the methods used to
measure the RFE may explain this heterogeneity. Using data on a large (n = 10,111) sample
of adults from the Yorkshire Health Study (UK), we modelled cross-sectional associations
between the RFE and weight status using (i) multiple definitions of ‘Fast Food’,
‘Convenience’ and ‘Supermarkets’ and (ii) multiple RFE metrics, identified in a prior
systematic review to be common in the literature. Both the choice of outlet definition and the
choice of RFE metric substantively impacted observed associations with weight status.
Findings differed in relation to statistical significance, effect sizes, and directions of
association. This study provides novel evidence that the diversity of RFE measurement
methods is contributing to heterogeneous study findings and conflicting policy messages.
Greater attention is needed when selecting and communicating RFE measures in research.
Key Words: Community Nutrition Environment; Foodscape; GIS; Food Access; Obesogenic Environment; Methodology; United Kingdom.
Introduction
The ‘Retail Food Environment’ (RFE) and its potential link with obesity has been the subject
of considerable research for over a decade [1-3]. Interventions to create less ‘obesogenic’
RFEs have received notable policy interest across many western countries, with numerous
3 ‘unhealthy’ food outlets can open [4-6]. The RFE comprises the availability and composition
(e.g. relative mix) of food retailing within local environments and is thought to influence
obesity by making ‘unhealthy’ foods more accessible and/or restricting access to ‘healthy’
foods. It may also influence obesity-related behaviours through more complex mechanisms,
such as driving desire for foods, normalising behaviours, or establishing habits [7]. However,
in spite of considerable research and numerous systematic reviews [3, 8-12], international
evidence supporting associations between the RFE and obesity is mixed. Null associations
predominate in relation to the links between the RFE and obesity – making up around
75-80% of the literature [13]. However, a notable number of studies have found statistically
significant associations of meaningful magnitude [14-16]. For example, Burgoine, Forouhi
[17] found that UK adults in the highest quartile of fast food exposure had a 0.9 units higher
BMI than those in the lowest quartile. For an obese male of average height (BMI = 30kg·m-2,
height = 178cm), a loss of 0.9 BMI units would equate to a weight loss of 2.9 kg, or ~3%
body weight. This is a considerable difference, approaching the 5% considered to be
clinically meaningful for weight-loss interventions by the National Institute for Health and
Care Excellence; the UK body responsible for health care guidance [18].
One likely cause of the heterogeneity in outcomes is the diversity of methods used to
measure the RFE. The majority (~ two thirds) of international research [19, 20], and
numerous policy tools [21, 22] use spatial measures to quantify the RFE. A previous review
defined five ‘dimensions of methodological diversity’ across which spatial methods for
measuring the RFE can differ: (i) choice of RFE data, (ii) data extraction methods, (iii) food
outlet classifications, (iv) geocoding methods and (v) RFE measures [23]. Following from
this, a systematic review of studies assessing associations between the spatially measured
RFE and weight status in Western countries [13] (the ‘Methods Review’) quantified, for the
first time, RFE measurement methods across each of these dimensions, and showed that
methods are highly varied. For example, while areal and buffer metrics (e.g. the count of
4 specific measures were used, at most, 15 times (count per area within 800m - 1,600m
Euclidian buffers), and commonly no more than once.
Differences in measurement methods are likely to substantively impact study findings, and
the corresponding policy messages. While most researchers acknowledge these differences,
they still go on to make comparisons and draw conclusions across studies employing
disparate methods. Little is known about the implications of using different spatial
measurement methods, making interpretation and collation of the evidence challenging.
Indeed, in spite of the high numbers of studies in this field, meta-analysis of the evidence
has so far been precluded, with authors frequently citing the diversity of methods as a
substantial hurdle to be overcome [3, 10, 24]. Ultimately, this is impeding translation of
evidence into policy.
One aspect of methodological diversity that is not well understood is the choice of food outlet
definitions. However, the Methods Review [13] found considerable variation in outlet
definitions. For example, fast food outlets were sometimes defined narrowly as comprising
only chain outlets, or in other cases defined broadly to include not only chain and non-chain
‘traditional’ fast food outlets but also establishments such as cafes and sandwich shops.
Little is known about whether and to what extent differences in the definitions of commonly
used outlet constructs impacts observed associations with weight status.
Another methodological aspect warranting investigation is the choice of RFE metric. This
aspect was found to be the area of greatest methodological diversity in the Methods Review
[13]. Studies have used, for example, metrics of outlet count, count per population, count per
area, presence/absence and various ‘relative’ metrics such as the ratio of fast food outlets to
total outlets. There is some evidence from numerous countries including the US, Canada,
Australia and the UK that differing RFE metrics lead to substantively different associations
between the RFE and weight-related outcomes [25-31]. However, all existing studies
investigate a limited selection of RFE metrics, which are not always relevant to existing
5 kernel density metrics; types of metric that are rarely used in the literature. Thus, it remains
unclear how the range of common RFE metrics compare. Further, many of these studies
[25, 29, 31] do not standardise RFE measures to allow direct comparison of effect sizes
across measures with different units (e.g. count versus count per km2). Therefore, it is not
possible to draw conclusions from these studies regarding the relative strength of
associations.
This study sought to replicate common methods for measuring the RFE around the home, as
identified in the Methods Review [13], and to compare associations between the RFE and
weight status when employing:
(i) different definitions of outlet constructs and
(ii) differing RFE metrics.
Replication of common measurement methods ensured the findings of this present study
were as relevant as possible to existing literature.
Methodology
Study Sample
Data from the Yorkshire Health Study (YHS) were used to model associations between the
RFE and weight status. The YHS is a longitudinal health survey of adult residents of the
Yorkshire and Humberside region of the UK. It originally focussed on recruiting residents of
South Yorkshire, but was later expanded to cover the whole of the Yorkshire and Humber
region (Figure 1). Participants were invited by their medical practice to complete an online or
paper-based survey on demographics, health conditions, behaviours, and health-care usage
(response rate: 15.9%, further information at Supplement 1 and elsewhere [32]). At the time
of this study, two waves of measures were available: 2010–2012 and 2013-2015. Wave 1
6 approximately 3 years later. The second wave sample additionally included 11,675 new
participants.
To improve robustness of the data (in particular to spot inconsistencies in time-invariant
variables between waves), the sample was restricted to only those with repeated measures
(n = 10,876), allowing validation of time-invariant measures such as gender (details below).
However, all analyses were cross-sectional, using wave 1 data only. Longitudinal analyses
were not performed, because the follow-up period was short, and the sample of insufficient
size to detect differences in the trajectory of weight over time. This also replicates the
majority (74%) of prior research, which also uses a cross-sectional design [13], allowing
better generalisability to the extant literature.
Ethical approval for the original study was obtained from the Leeds East NHS Research
Ethics (ref: 09/H1306/97). Ethical approval for the re-use of the YHS data in the present
study was granted by the Local Research Ethics Committee at Leeds Beckett University.
Individual-level variables
From the YHS data, we used postcode of residence to calculate RFE exposures, and
self-reported height and weight to derive outcomes of Body Mass Index (BMI, kg·m-2) and
obesity classification (obese: BMI ≥ 30kg·m-2; non-obese: BMI < 30kg·m-2). Self-reported
age (years), gender (male/female), ethnicity (white/non-white) and highest education level
(‘less than high-school’, ‘high-school’, ‘college’, or ‘university’, see Supplement 2) were used
as covariates. Education level was used as a proxy for individual socioeconomic status
(SES). These covariates were selected because they have been shown to be associated
with weight status [33-35], and were found to be commonly controlled for the Methods
Review (age: 90.3% of studies, gender: 89.4%, individual SES: 77.0%, ethnicity: 74.3%).
Cleaning of YHS data
The range and distribution of the YHS data was checked for anomalies. We identified a
7 height at baseline and follow-up. Thus, the sample was restricted to participants with
repeated measures (n = 10,876). This allowed use of the follow-up measures to exclude
participants with unfeasible changes of gender (n = 30), age (n = 61), and height (n = 290).
Participants with missing baseline weight data (n = 277), aged <18yrs at baseline (n = 66) or
located outside the study area (n = 1) were also excluded. The final sample comprised
10,111 participants. Cleaning of the data did not notably change the sample demographics
(Supplement 3).
Geocoding home locations
Participant home locations were geocoded to postcode centroids using ArcGIS v10.3.1 and
a postcode lookup compiled from the Office for National Statistics postcode directory for the
Yorkshire and Humber region [36]. The postcodes were full unit postcodes, whichcontain an
average of 15 addresses, with a maximum of 100 [37]. More precise home addresses were
not available. The match rate was 100%.
Retail Food Environment Measurement
This study sought to use the findings from the Methods Review [13] to replicate RFE
measurement methods common in the literature. To supplement the description below,
detailed rationale for the choice of methods, including data from the Methods Review on the
prevalence of methods within the wider RFE-obesity literature can be found at Supplement
4.
Retail Food Environment data
The Points of Interest (POI) dataset for 2011 [38] was used to map food outlets. POI is
produced by Ordnance Survey, the national mapping agency for Great Britain, and contains
the locations of a wide range of businesses and facilities. POI data were selected in
preference to other RFE data for several reasons. First, it is a validated dataset, with very
good spatial accuracy (all food outlets geocoded to points within building footprints), and
8 data were also available for the study period, which was not the case for other commonly
used RFE data (e.g. food business data from local authorities). It is also frequently used in
UK RFE research [40-46].
Food outlets were extracted from the POI dataset using proprietary classifications within the
POI data. These included the POI classifications of ‘restaurants’, ‘supermarkets’,
‘convenience stores and independent supermarkets’, ‘cafes, snack bars and tea rooms’ and
‘fast food and takeaway outlets’ as well as more specialist outlets such as ‘butchers’ and
‘bakeries’ (complete list at Supplement 5).
Food outlets were mapped in ArcGIS v10.3.1 using the eastings and northings data within
the POI dataset. Outlets falling within buffers relevant to this study (see below) were
extracted, resulting in 5,037 food outlets. Each outlet was then rigorously screened using a
combination of automated and manual screening (details at Supplement 5) to remove 472
duplicates, 70 non-food outlets (e.g. wholesalers, private caterers, and distribution centres),
and 26 outlets that had permanently closed prior to 2011. Several inaccuracies in easting
and northing coordinates were identified and corrected (n = 21), and a further eight outlets
missing from the POI data were added. This resulted in a final sample of 4,497 food outlets.
Food outlet classification
Each food outlet was classified using a combination of (i) outlet name, (ii) proprietary
classification, (iii) historic Google Street View images and (v) other information available
online. This ‘desk-based’ method of classifying outlets has been previously shown to have
good agreement (83%) with field-based food outlet classifications [47]. Outlets were
assigned to at least one of the following classifications: ‘fast food’, ‘convenience’,
‘supermarket’, ‘restaurant’, ‘fruit & vegetable store’ and ‘miscellaneous’ as defined in Table
1. These classifications were used to construct RFE exposures and covariates as described
9 The classifications ‘fast food’, ‘convenience’ and ‘supermarket’ were further divided into
narrow, moderate and broad scopes (Table 1), reflecting definitions commonly employed in
the RFE literature [13]. Images of outlets falling within these classifications are shown at
Supplement 6.
Aim 1: Investigating outlet definitions
The first aim of this study was to investigate the impact of using different definitions of outlet
constructs. We focussed on the most common constructs of ‘fast food outlets’,
‘supermarkets’ and ‘convenience stores’ (employed in 73.5%, 67.0% and 49.6% of studies
respectively), which have notable heterogeneity in definitions. For this aim, the RFE was
measured as counts of outlets within buffers, using network and Euclidian (circular) buffers
around participant postcodes of residence, spanning 3,200m, 1,600m, 800m and 400m.
These measures are among the most prevalent in RFE literature [13].
Network buffers used the oldest street network data available online from Ordnance Survey
Open Roads (October 2016), including all roads except motorways. While this post-dates the
POI and YHS data by 5 years, the street network is unlikely to have changed substantively
during this period. Network buffers were generated using the Network Analyst Service Area
tool in ArcGIS using generalized polygons with 100m trim. Counts of narrow, moderate and
broad definitions of ‘Fast Food’, ‘Convenience’ and ‘Supermarkets’ within the buffers were
derived using the ‘points in polygon’ tool. Counts of other outlets (including ‘Restaurants’,
‘Fruit & Veg’ stores and ‘Miscellaneous’ outlets) within buffers were also calculated for use
as covariates.
Aim 2: Investigating RFE metrics
The second aim of this study was to investigate the impact of using different metrics to
measure the RFE. To reduce the complexity of the results, this aspect focussed specifically
on measures of ‘Fast Food’ within 800m and 1,600m buffers, which were found in the first
10 (73.5% of studies). Network buffers were used because these allowed associations for raw
counts and counts per area to be disentangled. ‘Fast Food’ outlets were defined using the
moderate definition, which was found to be most prevalent in the literature (50.9% of studies
[13]). Based on the Methods Review, we selected the following metrics for investigation:
1. Count of ‘Fast Food’ outlets;
2. Count of ‘Fast Food’ outlets per square kilometre;
3. Count of ‘Fast Food’ outlets per 1,000 population;
4. Presence/absence of any ‘Fast Food’ outlets (binary variable);
5. The relative availability of outlet types, including:
a. ‘Relative 1’: Counts of (‘Fast Food’)/(Total Food Outlets);
b. ‘Relative 2’: Counts of (‘Fast Food’)/(‘Fast Food’ + ‘Restaurants’);
c. ‘Relative 3’: Counts of (‘Fast Food’ + ‘Convenience’)/(‘Supermarkets’ + ‘Fruit
& Veg Stores’).
‘Convenience’ stores were defined using the ‘broad’ definition and ‘Supermarkets’ using the
‘moderate’ definition as defined in Table 1. ‘Total Food Outlets’ was the count of all food
outlets, including ‘Fruit & Veg’ and ‘Miscellaneous’.
Other environmental data
Several other sources of environmental data were used in this study (detailed information at
Supplement 1). Firstly, the English Indices of Multiple Deprivation (IMD) for LSOAs [48] was
used to control for area-level deprivation in our models. IMD is a government statistic which
provides an indication of relative deprivation across England. The most recent IMD rankings
(2015) were used because they were derived from measures predominantly collected in
2012/13 [49], thus presenting the best possible temporal match to the YHS data. The 2011
Census Rural Urban Classifications for England at the LSOA level [50] was also used to
control for urbanicity. Each participant was assigned the IMD ranking and the urban/rural
11 Finally, census data on the numbers of residents living within output areas across the study
region in 2011 was obtained from the Office for National Statistics [51] in order to calculate
the number of food outlets per 1,000 people. The populations within network buffers were
estimated as the weighted sum of the populations living within output areas overlapping
each buffer, with weightings corresponding to proportion of the output area overlapping the
buffer. For example, if a buffer overlapped 40% of ‘output area A’ and 70% of ‘output area
B’, the population of the buffer would be estimated as (0.4 × PA)+ (0.7 × PB) where Pi is the
population of output area i.
Statistical analyses
A series of regressions were run, which replicated models commonly used in the literature
(Supplement 4). First, linear regressions were run to examine associations between each
measure of the RFE and BMI (treated as a continuous variable). Corresponding logistic
regressions were then run with the binary outcome of obesity (BMI ≥ 30kg·m−2 versus
otherwise). In total 160 separate models were run:
• 132 models investigating the impact of construct definitions:
o ‘Fast Food’ and ‘Convenience’ exposures: 16 models for each of the three
outlet scopes and constructs respectively, the 16 models corresponding to all
permutations of buffer size (3,200m, 1,600m, 800m, 400m), buffer type
(Euclidian and network) and outcome (BMI and obesity).
o ‘Supermarket’ exposures: 12 models for each of the three outlet scopes, the
12 models corresponding to all permutations of buffer size (3,200m, 1,600m,
800m), buffer type (Euclidian and network) and outcome (BMI and obesity).
• 28 models investigating the impact of RFE metrics:
o 4 models for each of the 7 metrics, the 4 models corresponding to two buffer
12 To allow for non-linear associations between RFE measures and BMI/obesity, RFE
measures were modelled as quartiles where possible. This also allowed direct comparison of
effect sizes for metrics with different units of measurement (e.g. counts versus counts per
km2). Cut points were selected with the aim of having equal numbers of participants per
quartile. However, due to the discretised nature of food outlet exposures, some quartiles
were collapsed (Supplement 7). In particular, for the smallest buffer sizes, exposures were
measured as presence/absence. Counts of ‘Supermarkets’ within 400m buffers were not
modelled due to insufficient variation (further details at Supplement 7).
Each measure of the RFE (i.e. each outlet definition, metric, and buffer size and type) was
modelled separately, controlling for age (continuous), gender (binary), education (4 levels),
ethnicity (white/non-white), neighbourhood deprivation (5 levels) and urbanicity (urban/rural).
These variables were selected as they were found to be commonly controlled for in the
Methods Review (Supplement 4). Models investigating the impact of outlet definitions
additionally controlled for the count of all other outlets within buffers (modelled as quartiles).
Just over half of all studies that provided clear descriptions of statistical methods in our
systematic review [13] included other outlets as covariates in models. Conversely, models
investigating the impact of metric choice, did not control for other outlets, because inclusion of other outlets would lead to double-counting of the denominator for the relative metrics.
All statistical analyses were performed using R (version 3.2.3). The threshold for statistical
significance was p<0.05. Model fit was compared using Akaike Information Criterion (AIC)
values and adherence to model assumptions was checked using diagnostic plots and
generalised variance inflation factors standardised by degrees of freedom (GVIF1/(2Df)). We
tested the sensitivity of our results to various alternative model parameterisations (treatment
of RFE exposures as continuous and inclusion/exclusion of ‘other outlets’ as a covariate)
and found no substantive differences in our main findings, although effect sizes and patterns
13
Results
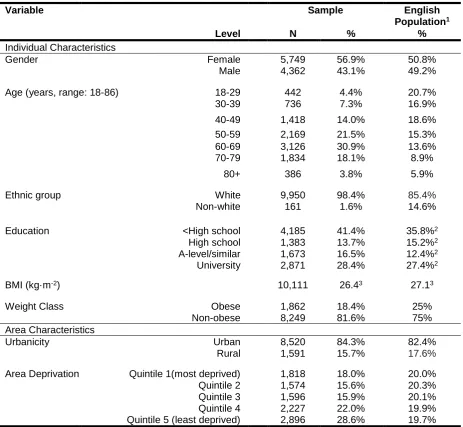
Descriptive statistics
Descriptive statistics for the 10,111 YHS participants included in analyses are shown in
Table 2. Compared to the English population in 2011, the YHS sample was older, with a
higher proportion of white ethnicities and a small overrepresentation of females and people
at the extremities of the education spectrum. Mean BMI was lower and there were fewer
people classified as obese than among the general English population.
The majority (n = 9,205) of participants resided in South Yorkshire, which is an English
metropolitan county spanning 1,552 km², with a population of 1.3 million [52]. A number of
participants resided in the wider Yorkshire and Humber Region (n = 77) and neighbouring
parts of Derbyshire (n = 829). Relative to England as a whole, participants tended to live in
less deprived neighbourhoods (Table 2). There was nevertheless a good representation of
the spectrum of deprivation within England, with participants living in LSOAs ranging from
the 118th to the 32,309th most deprived (there being 32,844 LSOAs in England). Similar to
the English population, the majority of participants resided in urban areas (population
≥10,000). The study area was, however, relatively unusual in that urban areas were
predominantly designated as ‘minor conurbation’; collections of small towns and urban
spaces that form a continuous urban area (n = 7,750; 91.0%). In contrast, across England
only 3.6% of urban LSOAs have this designation.
Supplement 7 shows the distribution of RFE measures (e.g. food outlet counts) within
buffers, together with correlations between measures. Most measures of the RFE exhibited
a skewness to the right.
Aim 1: Investigating outlet definitions
Table 3 presents findings from all 132 models investigating the impact of construct
definitions. The table summarises (i) whether models found statistically significant
14 by the models. It also shows the percentage agreement between the findings of models
differing only in construct scope. Substantive conclusions took into account effect sizes and
trends across quartiles in addition to p-values, and were classified as: ‘large
positive/negative association’, ‘small positive/negative association’, ‘positive/negative
U-shaped association’, and ‘null’ (see footnote of Table 3 for definitions). Further details
regarding the classification of study findings can be found at Supplement 8.
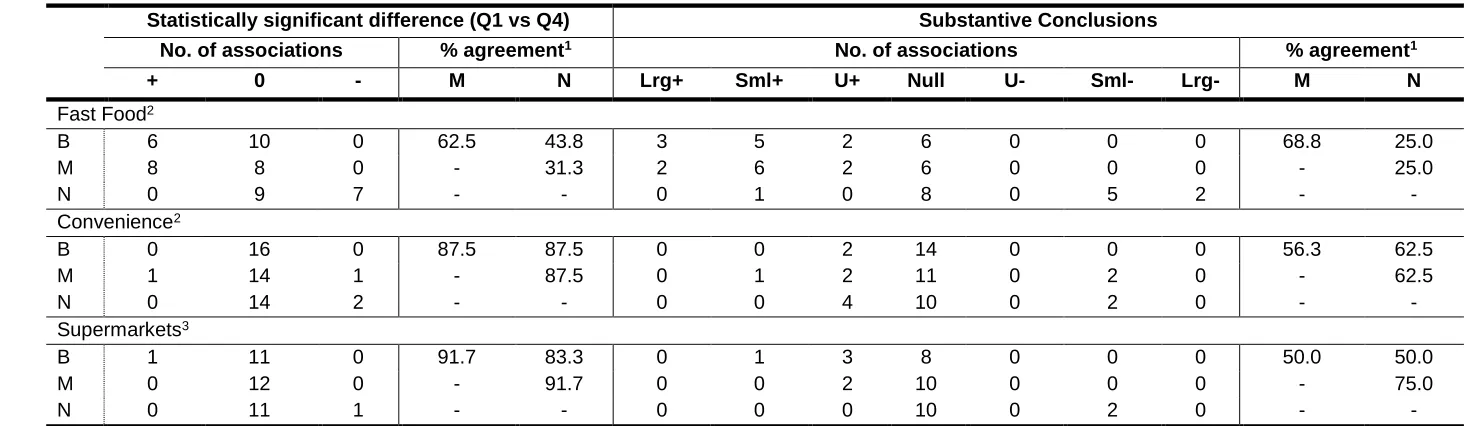
Findings from models employing differing definitions for each outlet construct varied notably,
both in terms of whether a statistically significant difference was observed, and in terms of
the substantive conclusions drawn from the models. Agreement between the statistical
significance of findings was particularly low for ‘Fast Food’ (31.3% - 62.5% of models
agreed), especially when contrasting narrow definitions to moderate and broad. Agreement
between statistically significant findings from models employing different definitions of
‘Supermarkets’ and ‘Convenience’ was generally good (all >80%). However, agreement
decreased when considering substantive findings (50% - 75%), suggesting that while
definitions of ‘Supermarkets’ and ‘Convenience’ did not markedly affect statistical
significance, they did impact inferences drawn from the data.
For all three constructs (‘Fast Food’, ‘Convenience’ and ‘Supermarkets’), AIC values did not
differ markedly across the outlet scopes nor favour any particular scope (Supplement 8). The
precision of point estimates (as indicated by 95% confidence intervals) also did not seem to
be influenced by outlet scope, except in the smallest buffer sizes, where estimates for
narrow definitions of ‘Fast Food’ and ‘Supermarkets’ were notably less precise.
Figure 2 shows example associations between BMI and counts of ‘Fast Food’,
‘Convenience’ and ‘Supermarkets’ within 800-3200m network buffers, according to the three
15
Aim 2: Investigating RFE metrics
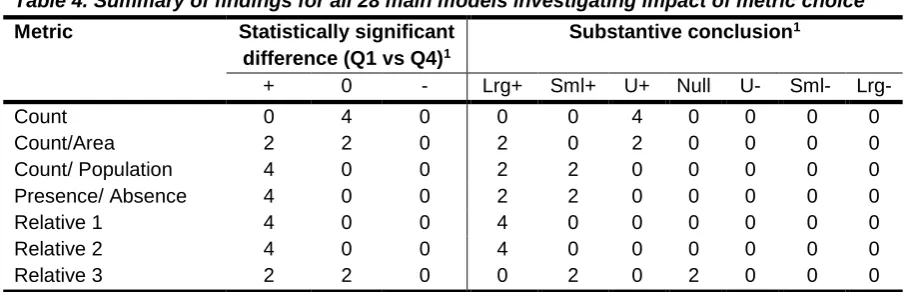
Table 4 summarises findings from the models investigating RFE metrics, with Figure 3
illustrating associations between measures of ‘Fast Food’/’Unhealthy Food’ exposure and
BMI for 800m and 1600m buffers respectively. Results for models with obesity as an
outcome are shown at Supplement 9, and were substantively the same. Patterns of
associations and effect sizes varied substantially. For example, the metrics Relative 1 (‘Fast
Food’/total outlets) and Relative 2 (‘Fast Food’/ ‘Fast Food’ + ‘Restaurants’) consistently had
the largest effect sizes, and exhibited dose-response relationships with weight status, with
effect sizes trending upwards with increasing exposure. Conversely, for the count of ‘Fast
Food’ outlets, all models revealed an inverted U-shaped association, wherein middle
quartiles of exposure had statistically significantly higher BMI/obesity odds than the lowest
quartile, but the highest and lowest quartiles were not different. The precision of point
estimates (indicated by 95% confidence intervals) did not seem to be influenced by metric
choice, except in 1,600m buffers where the absolute count of ‘Fast Food’ was more precise
than other metrics. Across the metrics, Relative 1 and Relative 2 generally had the lowest
AIC values (Supplement 9) and thus the best model fit.
Discussion
This study considers, for the first time, the impact of using different definitions for common
outlet constructs when applied to a single dataset. It also expands upon emerging research
into the choice of RFE metric by providing a comprehensive assessment of a range of
metrics often used internationally in the literature. While it is unsurprising that we found
measurement methods to influence findings to some degree, importantly we showed that the
impact on findings was of material importance; influencing both statistical significance and
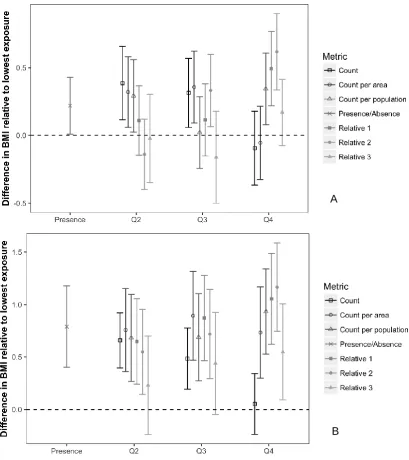
substantive conclusions. Indeed, Figure 4 demonstrates the extent to which findings differed
when employing different measurement methods in this study. For each outlet type, models
16 RFE are highly diverse [13] and this diversity undoubtedly contributes to the conflicting
evidence base and confusing policy messages.
The definitions used to define outlet constructs were shown to impact findings; particularly
for ‘Fast Food’, where associations for narrowly defined ‘Fast Food’ outlets were notably
different from moderate and broad definitions. This discrepancy is perhaps not surprising,
given that the narrow definition omitted all non-chain hot food takeaways, which serve very
similar food to chain fast food outlets, and were considerably more numerous that chain fast
food outlets. Discrepancies in findings across definitions of ‘Supermarkets’ and
‘Convenience’ can also be explained in that these terms may encompass a range of outlets
with different food offerings. Indeed, studies involving in-store audits have shown
supermarkets and small food stores to have variable ‘healthfulness’ (encompassing
measures such as healthy food availability, variety, price and promotions) [53, 54].
The importance of outlet definitions is often overlooked. The Methods Review upon which
this study is based [13] identified that nearly half of all studies do not provide a clear
definition for outlet constructs. Of those that did, over one quarter used a narrow definition
similar to that used in the present study. Narrow definitions of fast food outlets produced
markedly different results from moderate and broad scopes. Clear reporting of outlet
definitions is therefore crucial to enable correct interpretation and translation of research into
practice. Unsurprisingly, most existing systematic reviews do not differentiate between
different definitions of common outlet constructs [3, 8, 9, 19]. However, this may be hiding
important associations.
There is currently little evidence to guide definition of food outlet constructs for the purposes
of understanding RFE-obesity relationships. Moving forward, it is suggested that researchers
use constructs that have policy-relevance, so that study findings are directly translatable to
policy. For example, ‘hot food takeaways’ as defined within UK planning law is a distinct
17 can locate). Thus, within the UK context ‘hot food takeaways’ may present a preferred
construct to measure.
Previous research has shown the specific metric used to measure the RFE can influence
study findings [25-30]. However, these studies have so far only investigated a limited range
of metrics, which are not always relevant to existing literature. The present study is the first
to investigate the impact of five of the most common types of area-based metric (count,
count per area, count per population, presence/absence and relative metrics), as identified a
prior systematic review [13], allowing direct comparison across these key metrics. It showed
that these metrics can lead to substantively different findings, even across conceptually
similar metrics such as count and count per area. Prior systematic reviews have also tended
to group multiple metrics together [e.g. 3, 9, 10], which may obscure important associations.
Many papers also often interpret different metrics synonymously as indicating ‘access’
[55-58] or ‘availability’ [59-61]. However, this may give rise to over-simplistic messages to
policymakers. Indeed, assuming RFE-obesity associations are causal (which is by no means
definitive), our findings suggest that the specific aspect of the RFE that is regulated (e.g. the
absolute number of outlets versus the relative availability of outlet types) would impact the
effectiveness of interventions. Greater attention needs to be paid to RFE metrics moving
forward.
The present study explored in detail three different types of relative metric. Relative metrics
are increasingly being used in the RFE literature because previous research has suggested
they may lead to stronger and more consistent associations with weight-related outcomes
than ‘absolute’ measures such as counts [25-30]. However, no previous research has
compared multiple relative metrics to the range of absolute metrics commonly used in the
literature. The present findings largely support previous studies that relative metrics give rise
to larger effect sizes. The main models for ‘Relative 1’ (ratio of ‘Fast Food’ to total food
outlets) and ‘Relative 2’ (ratio of ‘Fast Food’ to ‘Fast Food’ + restaurants) consistently had
18 status, and had the best model fit. However, the present results also highlight the importance
of the specific relative metric used; with associations for the ‘Relative 3’ metric (ratio of ‘Fast
Food’ + ‘Convenience’ to ‘Supermarkets’ + ‘Fruit & Veg’) leading to smaller effect sizes and
less consistent and clear associations with weight status. Thus, different relative metrics
should not be interpreted synonymously.
The discrepancy in findings across metrics might be explained in that different metrics
capture different dimensions of the RFE, acting through diverse causal pathways to drive
obesity. It is often suggested that the RFE shapes obesity-related behaviours by facilitating
or hindering direct access to foods. However, the RFE may also act through other pathways,
such as stimulating desire for foods, normalising food behaviours, or building food habits [7].
Measures of count per area or population may, for example, best capture the accessibility
dimension. Conversely, the raw count of outlets (which measures absolute exposure) may
better capture the desire dimension, and the relative availability of outlets (which might
signal that eating a certain type of food is common or prevalent) may best capture the
normalisation dimension. If this theory is correct, multiple measures would be necessary to
adequately capture the RFE. The specific measures used would need to be considered in
the context of the research question and the appropriate statistical frameworks and
principles applied. While this study is focussed on spatial measures of the RFE it is also
worth noting that there are also other non-spatial dimensions to the RFE, which may
influence food purchasing behaviours, such as cost, opening hours, food quality and variety,
and the degree to which outlets accommodate social or cultural requirements [62].
An alternative explanation is that different metrics may be more strongly/weakly correlated
with confounders of the RFE-obesity relationship, and thus models of RFE-obesity
associations may be confounded to differing degrees, leading to differing patterns of
association. In support of this theory, we found a notable number of inverted U-shaped
relationships, particularly for measures of ‘Fast Food’ count. These U-shaped relationships
19 negatively correlated with weight status. At high ‘Fast Food’ counts, the propensity of the
latent variable to reduce weight status may dominate over the propensity of ‘Fast Food’
count to increase weight status, leading to a U-shaped relationship. A potential latent
variable is street connectivity, which has been found to be associated with increased
physical activity in several reviews and meta-analyses [63-65]. Street connectivity is higher
in urban areas and thus positively correlated with ‘Fast Food’ count, and may over-ride the
influence of the RFE at high ‘Fast Food’ counts. Dividing the number of ‘Fast Food’ outlets
by the number of total outlets would indirectly control for street connectivity, which might
explain why the unexpected U-shaped relationship was replaced by a positive
dose-response relationship for the ratio of ‘Fast Food’ to total outlets. Further research
incorporating measures of potential environmental confounders is needed to corroborate this
theory.
It is clear from the present study that different measures of the RFE should not be
interpreted synonymously. However, given the diversity of measures used within the
literature, this presents problems for the evaluation and collation of research. Moving
forward, it is suggested that researchers use multiple RFE measures (i.e. buffer sizes and
metrics), ideally from a standardised set. A standardised set of metrics could be developed
and agreed upon by a consortium of international experts, through consideration of existing
measures and their theoretical underpinnings. It could include a range of standardised
metrics (e.g. proximity, raw count, count relative to total outlets, presence/absence) and
(where relevant) buffer sizes (e.g. 400m, 800m, 1600m etc.) and types (e.g. network
distances). Within these confines, researchers would then be able to select a range of
metrics most suited to their research context. This would allow better comparability across
studies, because overlap between studies in relation to the specific measures used would be
more likely. It would also allow multiple aspects of the RFE to be captured and allow authors
to draw more robust conclusions based on the findings from multiple measures rather than
20 contexts, such as that proposed by the Association of Public Health Epidemiologists in
Ontario [66] for the reporting of public health statistics by public health units in Ontario.
These could be used as a basis for the development of a more generalised set of standard
measures.
This study has several strengths. First, results from a comprehensive systematic review
were used to replicate and compare measures frequently used in RFE-obesity research. It is
the first study to investigate the impact of using different definitions for outlet constructs, and
also expands previous research into the impacts of metric choice, by considering the five
most common types of area-based metric. The study used a large dataset from the YHS,
and employed extensive data cleaning processes in respect of both YHS and POI data to
ensure both datasets were as robust as possible. While this study uses a UK cohort, the
methods investigated are used internationally, and therefore the main finding of this study –
that different measurement methods used commonly across the international literature can
lead to substantively different findings - has international relevance.
Limitations are that the YHS data were self-reported. Thus BMI is likely to be
under-estimated; although self-reported data are still be useful for observing relationships in
epidemiological research [67]. The data cleaning process also identified a number of
anomalies in the YHS data, such as changes in gender across waves. This casts doubt on
the reliability of variables that could not be verified across waves. The YHS sample also
differed from the English population across a number of characteristics. Of particular note,
participants predominantly lived in urban areas designated as ‘minor conurbations’, which is
a relatively unusual area designation in England. Relatedly, like the majority of RFE-obesity
research, this study focussed solely on the home environment and neglected the numerous
other environments that people are exposed to [68, 69]. That said, given the focus of this
study on the impact of methods, rather than inferences about the true associations between
21 key finding of this study – that associations between the RFE and weight status depend on
the measures used likely transcend population groups and environments.
Due to the discretised nature of food outlet counts, quartiles of exposure were not perfectly
balanced and it was sometimes necessary to collapse quartiles to form a single category,
which limits direct comparison of effect sizes. Stratification of exposures into quartiles also
made comparison of associations more challenging, as each regression produced a
parameter estimate for each quartile. Nevertheless, this parameterisation of the exposure
was preferred over alternatives, such as the treatment of exposures as continuous linear
variables, because it allowed for non-linear associations (which this study showed to be
common), and also permitted better (albeit imperfect) comparability of effect sizes across
metrics with differing units of measurement.
It was not the objective of this study to investigate causal relations between the RFE and
weight status. This study used cross-sectional analyses, replicating common measurement
and statistical methods used in the literature, which may not necessarily be causally correct.
Therefore, the relationships observed between the RFE and obesity cannot be interpreted as
indicating causal associations. This study also does not provide evidence for the ‘best’ or
‘correct’ measures to use if seeking to understand causal associations. The observation that
one measure gives rise to larger effect sizes does not mean that it is necessarily causally
related to obesity. Furthermore, agreement between measures seemed to vary across buffer
sizes and model specifications. Thus, the present findings are context specific and even in a
predictive framework, we cannot conclude that any particular measure will be ‘best’ across
all contexts.
Conclusion
This study highlights the important impact methodological decisions have on findings, and on
the corresponding messages communicated to policymakers. Despite over a decade of
22 and this study provides evidence that methodological diversity is contributing to this mixed
evidence base. Different measures of the RFE cannot be interpreted synonymously.
However, the range of measures used in the literature is vast, presenting problems for the
collation and interpretation of research. Moving forward, researchers should, at the very
least, provide a clear and complete description of the measurement methods used. As there
is little evidence to guide development of construct definitions, it is recommended that
researchers either use definitions that are policy-relevant, as these will be more easily
translatable into practice, or use definitions supported by well-articulated theory, so that clear
hypotheses can be tested. It is also suggested that researchers use multiple RFE metrics,
ideally from a standardised set of theory-informed metrics, to support comparability between
23
Figures
24 Figure 2. Associations between counts of ‘Fast Food’ (A), ‘Convenience’ (B) and ‘Supermarkets (C) and BMI within 800m, 1600m, and 3200m network buffers.
All models control for age, gender, ethnicity, education, urbanicity, area-level deprivation and count of all other food outlets within buffer. Values shown are beta coefficients representing the difference in BMI (kg·m-2) between quartile 1 (reference category) and quartiles 2-4, and associated 95%
A
B
25
confidence intervals. Point estimates are missing for some quartiles because these were collapsed with quartile 1 due to insufficient variation in outlet counts.
Figure 3. Difference in BMI associated with increasing RFE exposure measures within 800m (A) and 1600m (B) network buffers.
All models controlled for age, gender, ethnicity, education, urbanicity and area-level deprivation. Relative 1: fast food outlets/total outlets. Relative 2: fast food outlets/(fast food outlets + restaurants). Relative 3: (fast food outlets + convenience)/(supermarkets + fruit & veg stores). Values shown are beta coefficients representing the difference in BMI (kg·m-2) between levels of exposure, relative to the lowest exposure (reference category), and associated 95% confidence intervals.
A
[image:26.595.91.501.132.593.2]26 Figure 4. The most conflicting findings identified in this study in relation to the association between measures of Fast Food (A), Convenience (B), and Supermarket (C) exposures and BMI.
Values shown are beta coefficients representing the difference in BMI (kg·m-2) between quartile 1
(reference category) and quartiles 2-4 and associated 95% confidence intervals. Point estimates are
A
B
[image:27.595.76.475.69.677.2]27
missing for some quartiles because these were collapsed with quartile 1 due to insufficient variation in outlet counts.
[image:28.595.67.516.178.674.2]Tables
Table 1. Food outlet classifications
Classification Definition Examples
Fast Food - Narrow
Major chain outlets only. Comprised only of: McDonald’s; Burger
King; KFC; Domino’s; Dixie Chicken; Wimpy; Chicken Cottage; Papa John’s; Southern Fried Chicken (SFC); Five Guys; Harry Ramsdens; Subway; Little Chef.
Fast Food - Moderate
‘Narrow’ outlets, plus non-chain traditional fast food and takeaways with no/limited seating and no waitress service.
Outlets serving burgers, kebabs, fried chicken, fish and chips, pizza, Indian and Chinese.
Fast Food - Broad
‘Moderate’ outlets, plus takeaway cafes, retail bakeries and chain coffee shops.
Subway, Starbucks, Costa Coffee, Greggs Bakery, Cooplands, Millie’s Cookies, Shakeaway
Convenience - Narrow
Small convenience stores and newsagents, selling minimal or no fresh goods. Includes off-licenses and petrol station stores.
Recognisable franchises include small-sized Mace, Londis, Costcutter, McColl’s.
Convenience - Moderate
‘Narrow’ outlets, plus medium convenience stores selling a wider, but still limited range of fresh fruits and vegetables and frozen goods.
Recognisable franchises include medium-sized Nisa Local, Premier, Spar, McColl’s, Londis, Costcutter. Convenience –
Broad.
‘Moderate’ outlets, plus grocery stores small enough to be exempt from the opening hour restrictions of the Sunday Trading Act 1994 (i.e. < 3,000 square feet).
Tesco Express/Metro, Sainsbury’s Local, Co-operative (small stores), M&S Simply Food (small stores), large Nisa Local, Premier and Spar.
Supermarket - Narrow
Large chain supermarkets only. Often have long opening hours (e.g. 6am - 11pm or 24hrs) and a wide range of facilities e.g. clothes/homeware departments.
Tesco, Morrisons, Sainsbury’s, Asda or large Waitrose
Supermarket - Moderate
‘Narrow’ outlets, plus medium supermarkets with shorter opening hours and less extensive range of products and facilities. Large enough to fall under Sunday Trading Act.
Co-operative (large stores), M&S Simply Food (large stores), Waitrose (medium stores), Budgens, Aldi, Lidl, Iceland.
Supermarket - Broad
‘Moderate’ outlets, plus small grocery stores, as defined for ‘Convenience – broad’ above.
See ‘Convenience – broad’.
Restaurants Outlets serving evening meals and providing
waited table service or a buffet.
Pizza Express, Nandos, Zizzi’s, La Tasca, Toby Carvery.
Fruit and Veg Stores.
Market stalls or outlets primarily retailing fruits and vegetables; including farm shops.
‘Bob’s Fruit and Veg’, ‘Hall’s Green Grocers’
Miscellaneous All other outlets – including cafes, pubs not serving food and speciality stores such as butchers and fishmongers.
28 Table 2. Sample Characteristics
Variable
Level
Sample English
Population1
N % %
Individual Characteristics
Gender Female 5,749 56.9% 50.8%
Male 4,362 43.1% 49.2%
Age (years, range: 18-86) 18-29 442 4.4% 20.7%
30-39 736 7.3% 16.9%
40-49 1,418 14.0% 18.6%
50-59 2,169 21.5% 15.3%
60-69 3,126 30.9% 13.6%
70-79 1,834 18.1% 8.9%
80+ 386 3.8% 5.9%
Ethnic group White 9,950 98.4% 85.4%
Non-white 161 1.6% 14.6%
Education <High school 4,185 41.4% 35.8%2
High school 1,383 13.7% 15.2%2
A-level/similar 1,673 16.5% 12.4%2
University 2,871 28.4% 27.4%2
BMI (kg·m-2) 10,111 26.43 27.13
Weight Class Obese 1,862 18.4% 25%
Non-obese 8,249 81.6% 75%
Area Characteristics
Urbanicity Urban 8,520 84.3% 82.4%
Rural 1,591 15.7% 17.6%
Area Deprivation Quintile 1(most deprived) 1,818 18.0% 20.0%
Quintile 2 1,574 15.6% 20.3%
Quintile 3 1,596 15.9% 20.1%
Quintile 4 2,227 22.0% 19.9%
Quintile 5 (least deprived) 2,896 28.6% 19.7%
N = number of participants.
1Obesity and BMI data from the Health Survey for England 2011. All other data from the 2011 Census
for England.
2A further 9.3% of the UK population had a qualification classified as ‘other/apprenticeship’
30 Table 3. Summary of findings for all 132 main models investigating the impact of outlet definition
Statistically significant difference (Q1 vs Q4) Substantive Conclusions
No. of associations % agreement1 No. of associations % agreement1
+ 0 - M N Lrg+ Sml+ U+ Null U- Sml- Lrg- M N
Fast Food2
B 6 10 0 62.5 43.8 3 5 2 6 0 0 0 68.8 25.0
M 8 8 0 - 31.3 2 6 2 6 0 0 0 - 25.0
N 0 9 7 - - 0 1 0 8 0 5 2 - -
Convenience2
B 0 16 0 87.5 87.5 0 0 2 14 0 0 0 56.3 62.5
M 1 14 1 - 87.5 0 1 2 11 0 2 0 - 62.5
N 0 14 2 - - 0 0 4 10 0 2 0 - -
Supermarkets3
B 1 11 0 91.7 83.3 0 1 3 8 0 0 0 50.0 50.0
M 0 12 0 - 91.7 0 0 2 10 0 0 0 - 75.0
N 0 11 1 - - 0 0 0 10 0 2 0 - -
Key: +/-: statistically significant positive/negative difference between quartile 1 (Q1) and quartile 4 (Q4). 0: no statistically significant difference between Q1
and Q4. B: broad. M: moderate. N: narrow. Lrg+: large positive association (quartile 4 statistically significantly higher than quartile 1, with effect size ≥ 0.5 BMI points or ≥ 1.3 odds ratio). Lrg-: ‘large negative association’ (as for ‘large positive’, but in the negative direction). Sml+/-: ‘small positive/negative association’ (quartile 4 statistically significantly different from quartile 1, or very close to statistical significance, but not meeting the criteria to be classified as ‘large’), U+/-: ‘positive/negative U-shaped association’ (quartile 4 not statistically significantly different from quartile 1, but quartile 2 and/or 3 are). Null: no quartiles statistically significantly different from quartile 1.
1 Percentage agreement between findings from models differing in the definition scope, but being otherwise identical.
2 Results from 16 models respectively modelling exposures of outlet counts within 3,200m, 1,600m, 800m Euclidian and network buffers and
presence/absence of outlets within 400m Euclidian and network buffers (8 exposures), against the respective outcomes of BMI and obesity (2 outcomes).
3 Results from 12 models respectively modelling exposures of Supermarket counts within 3,200m & 1,600m Euclidian and network buffers and
31 1
Table 4. Summary of findings for all 28 main models investigating impact of metric choice 2
Metric Statistically significant
difference (Q1 vs Q4)1
Substantive conclusion1
+ 0 - Lrg+ Sml+ U+ Null U- Sml- Lrg-
Count 0 4 0 0 0 4 0 0 0 0
Count/Area 2 2 0 2 0 2 0 0 0 0
Count/ Population 4 0 0 2 2 0 0 0 0 0
Presence/ Absence 4 0 0 2 2 0 0 0 0 0
Relative 1 4 0 0 4 0 0 0 0 0 0
Relative 2 4 0 0 4 0 0 0 0 0 0
Relative 3 2 2 0 0 2 0 2 0 0 0
Key: +/-: statistically significant positive/negative difference between quartile 1 (Q1) and quartile 4
(Q4). 0: no statistically significant difference between Q1 and Q4. Lrg+: large positive association (quartile 4 statistically significantly higher than quartile 1, with effect size ≥ 0.5 BMI points or ≥ 1.3 odds ratio). Lrg-: ‘large negative association’ (as for ‘large positive’, but in the negative direction).
Sml+/-: ‘small positive/negative association’ (quartile 4 statistically significantly different from
quartile 1, or very close to statistical significance, but not meeting the criteria to be classified as ‘large’), U+/-: ‘positive/negative U-shaped association’ (quartile 4 not statistically significantly different from quartile 1, but quartile 2 and/or 3 are). Null: no quartiles statistically significantly different from quartile 1.
1 Results are from 4 models for each exposure, which respectively corresponded to 2 buffer sizes
(1,600m and 800m) and two outcomes (BMI and obesity).
3
4
5
6
32
References
1
1. Burdette, H.L. and R.C. Whitaker, Neighborhood playgrounds, fast food restaurants, 2
and crime: relationships to overweight in low-income preschool children. Preventive 3
medicine, 2004. 38(1): p. 57-63. 4
2. Maddock, J., The relationship between obesity and the prevalence of fast food 5
restaurants: state-level analysis. American journal of health promotion, 2004. 19(2): 6
p. 137-143. 7
3. Cobb, L.K., et al., The relationship of the local food environment with obesity: A 8
systematic review of methods, study quality, and results. Obesity, 2015. 23(7): p. 9
1331-1344. 10
4. Local Government Association, Tipping the scales. Case studies on the use of 11
planning powers to limit hot food takeaways. 2016, Local Government Association: 12
London. 13
5. Nykiforuk, C.I.J., et al., Adoption and diffusion of zoning bylaws banning fast food 14
drive-through services across Canadian municipalities. BMC Public Health, 2018. 15
18(1): p. 1-12. 16
6. Diller, P.A. and S. Graff, Regulating food retail for obesity prevention: how far can 17
cities go? The Journal of Law, Medicine & Ethics, 2011. 39(s1): p. 89-93. 18
7. Clary, C., S.A. Matthews, and Y. Kestens, Between exposure, access and use: 19
Reconsidering foodscape influences on dietary behaviours. Health & Place, 2017. 20
44: p. 1-7. 21
8. Feng, J., et al., The built environment and obesity: a systematic review of the 22
epidemiologic evidence. Health & Place, 2010. 16(2): p. 175-190. 23
9. Gamba, R.J., et al., Measuring the food environment and its effects on obesity in the 24
United States: a systematic review of methods and results. Journal of community 25
health, 2015. 40(3): p. 464-475. 26
10. Williams, J., et al., A systematic review of the influence of the retail food environment 27
around schools on obesity‐related outcomes. obesity reviews, 2014. 15(5): p. 359-28
374. 29
11. Casey, R., et al., Determinants of childhood obesity: what can we learn from built 30
environment studies? Food Quality and Preference, 2014. 31: p. 164-172. 31
12. Fleischhacker, S., et al., A systematic review of fast food access studies. Obesity 32
Reviews, 2011. 12(5): p. e460-e471. 33
13. Authors, Hidden for Peer Review. Health & Place, Accepted. 34
14. Stark, J.H., et al., Neighbourhood food environments and body mass index among 35
New York City adults. Journal of Epidemiology and Community Health, 2013. 67(9): 36
p. 736-742. 37
15. Dubowitz, T., et al., The Women's Health Initiative: The food environment, 38
neighborhood socioeconomic status, BMI, and blood pressure. Obesity, 2012. 20(4): 39
p. 862-871. 40
16. Burgoine, T., et al., Examining the interaction of fast-food outlet exposure and 41
income on diet and obesity: evidence from 51,361 UK Biobank participants. Int J 42
Behav Nutr Phys Act, 2018. 15(1): p. 71. 43
17. Burgoine, T., et al., Does neighborhood fast-food outlet exposure amplify inequalities 44
in diet and obesity? A cross-sectional study. American Journal of Clinical Nutrition, 45
2016. 103(6): p. 1540-1547. 46
18. National Institute for Care Excellence. Weight management: lifestyle services for 47
overweight or obese adults. 2014 [cited 2018 8 February]; Available from: 48
https://www.nice.org.uk/guidance/ph53/resources/weight-management-lifestyle-49
services-for-overweight-or-obese-adults-pdf-1996416726469. 50
19. Caspi, C.E., et al., The local food environment and diet: a systematic review. Health 51
33 20. Lytle, L.A. and R.L. Sokol, Measures of the food environment: a systematic review of 1
the field, 2007–2015. Health & Place, 2017. 44: p. 18-34. 2
21. Public Health England. Obesity and the environment. Density of fast food outlets. 3
2016 [cited 2017 13 April]; Available from:
4
https://www.noo.org.uk/securefiles/170413_1349//FastFoodmap_FINAL.pdf. 5
22. Public Health England. Strategies for encouraging healthier ‘out of home’ food 6
provision: a toolkit for local councils working with small food businesses. 2017 [cited 7
2017 20 June]; Available from:
8 https://www.gov.uk/government/uploads/system/uploads/attachment_data/file/60491 9 2/Encouraging_healthier_out_of_home_food_provision_toolkit_for_local_councils.pdf 10 . 11
23. Wilkins, E.L., et al., Using Geographic Information Systems to measure retail food 12
environments: discussion of methodological considerations and a proposed reporting 13
checklist (Geo-FERN). Health & Place, 2017. 44: p. 110-117. 14
24. Black, C., G. Moon, and J. Baird, Dietary inequalities: What is the evidence for the 15
effect of the neighbourhood food environment? Health & Place, 2014. 27: p. 229-242. 16
25. Clary, C.M., et al., Should we use absolute or relative measures when assessing 17
foodscape exposure in relation to fruit and vegetable intake? Evidence from a wide-18
scale Canadian study. Preventive medicine, 2015. 71: p. 83-87. 19
26. Polsky, J.Y., et al., Absolute and relative densities of fast-food versus other 20
restaurants in relation to weight status: Does restaurant mix matter? Preventive 21
Medicine, 2016. 82: p. 28-34 22
27. Feng, X., et al., Modest ratios of fast food outlets to supermarkets and green grocers 23
are associated with higher body mass index: Longitudinal analysis of a sample of 24
15,229 Australians aged 45 years and older in the Australian National Liveability 25
Study. Health & Place, 2018. 49: p. 101-110. 26
28. Clary, C., et al., The local food environment and fruit and vegetable intake: A 27
geographically weighted regression approach in the ORiEL study. American journal 28
of epidemiology, 2016. 184(11): p. 837-846. 29
29. Shier, V., R. An, and R. Sturm, Is there a robust relationship between neighbourhood 30
food environment and childhood obesity in the USA? Public Health, 2012. 126(9): p. 31
723-730. 32
30. Mason, K.E., R.J. Bentley, and A.M. Kavanagh, Fruit and vegetable purchasing and 33
the relative density of healthy and unhealthy food stores – evidence from an 34
Australian multilevel study. Journal of Epidemiology and Community Health, 2013. 35
67(3): p. 231-236. 36
31. Thornton, L.E., et al., Does the choice of neighbourhood supermarket access 37
measure influence associations with individual-level fruit and vegetable 38
consumption? A case study from Glasgow. International Journal Of Health 39
Geographics, 2012. 11(29): p. 1-12. 40
32. Green, M.A., et al., Cohort profile: the Yorkshire Health Study. International journal of 41
epidemiology, 2014. 45(3): p. 707-712. 42
33. Health & Social Care Information Centre. Health Survey for England 2016 Adult 43
overweight and obesity. 2017 [cited 2018 17 August]; Available from: 44
http://healthsurvey.hscic.gov.uk/media/63745/HSE2016-Adult-obe.pdf. 45
34. Braveman, P.A., et al., Socioeconomic disparities in health in the United States: what 46
the patterns tell us. American journal of public health, 2010. 100(S1): p. S186-S196. 47
35. Wang, Y. and M.A. Beydoun, The obesity epidemic in the United States—gender, 48
age, socioeconomic, racial/ethnic, and geographic characteristics: a systematic 49
review and meta-regression analysis. Epidemiologic reviews, 2007. 29(1): p. 6-28. 50
36. Ball, C. Yorkshire & The Humber Postcodes, May 2018 Release. 2018 [cited 2018 51
16 June]; Available from: https://www.doogal.co.uk/PostcodeDownloads.php. 52
37. Ordnance Survey. Postcode Unit. 2017 [cited 2017 30 October]; Available from: 53