_____________________________________________________________________________________________________ *Corresponding author: E-mail: [email protected];
3(3): 1-10, 2019; Article no.AJRAF.49889
ISSN: 2581-7418
Effect of Deforestation on Rural Household Income
in Selected Forest Dependent Commuinities in
Odeda Local Council Area of Ogun State, Nigeria
A. E. Osoba
1, T. A. Atanda
1*and T. S. Bola
21Department of Forestry and Wildlife Management, Federal University of Agriculture, Abeokuta,
Nigeria. 2
Department of Forestry and Wood Technology, Federal University of Technology, Akure, Nigeria.
Authors’ contributions
This work was carried out in collaboration among all authors. All authors read and approved the final manuscript.
Article Information
DOI: 10.9734/AJRAF/2019/v3i330042 Editor(s): (1)Dr. Cengiz Yucedag, Professor, Department of Landscape Architecture, Mehmet Akif Ersoy University, Turkey. Reviewers: (1) João Luiz de Moraes Hoefel, Centro Universitário Unifaat, Brazil. (2)Mahmoud Abdelhamid Dawood, Kafrelsheikh University, Egypt. (3)Manoel Fernando Demétrio, Brazil. Complete Peer review History:http://www.sdiarticle3.com/review-history/49889
Received 18 April 2019 Accepted 28 June 2019 Published 05 July 2019
ABSTRACT
This study was carried out to examine deforestation and rural household income with a view to ensuring conservation. A multistage sampling procedure with a 3-stage design was used for this study. Questionnaire was used to elicit information from 120 respondents in Odeda local council area of Ogun State, Nigeria. Data collected were analyzed using descriptive and inferential statistics. The Foster-Greer-Thorbecke indices of poverty metrics was used to determine the poverty line of households. Smith’s saliency was used to determine the livelihood activities in selected communities. The result showed that respondents were gender sensitive, majority (58.3%) were male and (41.7%) female. On age, 41 – 50 (45.8%) years recorded the highest. The mean age was 50 years. Most of the respondents were married (68.6%) while majority, (52.5%) have low literacy level attaining only secondary education. Household size 1 - 5 recorded the highest, (76.7%) of the total population. Mean household size was 5. The study area was dominated by Yoruba (77.5%). Major occupation income recorded a mean of N17, 000 Naira while minor occupation income recorded a mean of N4308.37 Naira. Poverty line of N122, 700 Naira was
determined with poverty incidence (P0) of (21.67%). The poverty gap (P1), (5.09%) indicating that an average respondent requires N6, 245.43 Naira to reach the poverty line. The poverty severity
(P2) was (0.02) showing that the respondents were not poor because the value is far from 1. Socio
economic factors promoting deforestation were identified among the respondents with marital status as the only significant variable (P<0.05) and a negatively coefficient value of -2.281. Conclusively, deforestation was identified with livelihood activities of the people such as hunting, farming and trading of forest products. Therefore, it is recommended that forestry extension programmes should be intensified in rural communities to minimize deforestation activities and promote eco-consciousness among the local people.
Keywords: Communities; deforestation; forest; income; livelihood and rural household.
1. INTRODUCTION
Forests and agriculture are an integral part of the farming systems where farmers depend upon them for their livelihood [1]. The importance of forests as providers of livelihoods and poverty “safety nets” has received growing attention over the past few decades. Forest resources are the major means of livelihood for the rural populace as majority depends on it for livestock farming, inputs for agriculture and supply for timber and non-timber forest products [2]. The forest is often perceived as a stock resource, a free good, with the land as something freely available for conversion to other uses without recognition of the consequences on its role of provision of environmental services. Hence many forest ecosystems have been degraded into less diverse and stable ones [3]. Deforestation is defined as a direct, human-induced conversion of forested land to non-forested land [4]. Forest
degradation occurs when the ecosystem
functions of the forest are degraded but where the area remains forested rather cleared [5]. Deforestation is a conventional environmental challenge substantially affecting the resilience and distribution of forests across different boundaries. It is simply defined as the loss of tree cover usually as a result of forests being cleared for agriculture and other land uses [6].
In Nigeria, forests provide goods such as timber and other non-timber products (e.g. bamboo, chew stick, game) which help most communities to meet the requirements for rural economy [7]. Meanwhile, the forests of Nigeria contribute substantially to the national gross domestic product (GDP) and sustenance of the livelihood of the people. This may be the reason why the trend of deforestation across the country seems to be very high. According to [8], forestry contributions to Nigeria’s GDP vary from time to time. [8] also reported that forest contribution to GDP in the country are 0.92% in 1981, 0.89% in
1982, 0.97% in 1983, 1.00% in 1984, and 0.91% in 1985. Further observation of [8] shows that forestry contributions to GDP of the country were 0.99% in 1986, 1.01% in 1987, 0.96% in 1988, 0.68% in 1989 and 0.45% for the year 1990.
The deforestation and degradation of Nigeria forest resources is indisputable. According to [9], between 1980 and 1990, the annual rate of deforestation averaged 3.5% and the forest area declined from 14.9 million ha.to 10.1 million ha which translates to the loss of 350,000 to 400,000 ha of forest land per annum for the
country. The study carried by Forestry
Osoba et al.;AJRAF, 3(3): 1-10, 2019; Article no.AJRAF.49889
reported by [11]. The process usually induces adverse effects on the social condition of weaker sectors of society and leads to the progressive impoverishment of ecosystems [12]. Some types of deforestation and forest degradation result in costs to society that amply exceeds benefits. There is enough evidence that Nigeria is facing an environmental crisis on account of heavy deforestation. For several years, there has been remorseless destruction which must be put under control to avoid some bad consequences associated with deforestation. Nobody knows exactly how much of its tropical forest have already been destroyed and continue to be razed each year. Data is often imprecise and subject to differing interpretations. Population growth and expansion which are the major causes of deforestation usually results to decrease in per capita income thus savings and rate of capital formation remain low, reduction in per capita income, rise in general price level leading to sharp rise in cost of living. No improvement in agricultural and industrial technology, shortage of essential commodities, low standard of living, mass unemployment etc. This underscores the importance of this study with the following objectives: To describe the socio-economic profile of respondents, to identify the causes of deforestation, to identify the livelihood activities in the communities, to identify the socio-economic factors promoting deforestation and to determine the poverty status of the respondents.
2. MATERIALS AND METHODS
2.1 The Study Area
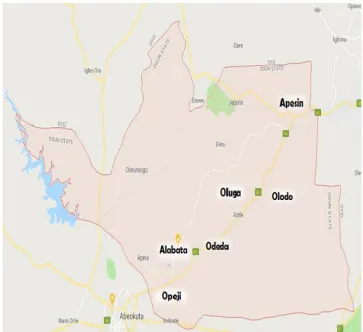
The study was carried out in Odeda local government area (Fig. 1), which shares boundary with Abeokuta North local government area of Ogun State. Odeda local government is one of the twenty Local Governments in Ogun State, Nigeria. The headquarters is 10km from Abeokuta (State capital) at Odeda Township. The council area has an extensive landmass
mostly grassland with an area of 99,615 km2 and
a population of 222,097 people [13]. Odeda local government is divided into three zones and each zone is sub-divided into settlement/villages. The Local Government Area enjoys tropical climate and enjoy double maximum of rainfall from April to July and September to October. Average
temperature is about 32oC and humidity can
be as high as 95%. The people of Odeda LGA are predominantly farmers who engage in small scale farming.
2.2 Data Collection
Data were collected from a total of 120 respondents with the aid of a semi-structured questionnaire using multi-stage sampling design from three zones in Odeda local council area of Ogun state. The zones were Odeda, Ilugun and Opeji. Twenty respondents were selected in each of the six villages across the three existing zones. The respondents cut across farmers, hunters and knowledgeable members of the community. Information sought include, age of respondent, occupation, income from major and
minor occupation, family size, religion,
educational qualification, information on causes of deforestation, consequence of deforestation on rural household income and socio-economic factors promoting deforestation. The distribution of the respondents is presented in Table 1.
2.3 Data Analysis
Data collected were analyzed using descriptive and inferential statistics, Smiths saliency, regression analysis and Foster-Greer-Thorbecke indices. Descriptive statistics such as table, frequency distribution and percentages was used to analyze socio-economic characteristics of respondents and the causes of deforestation, Smith’s saliency was used to determine the livelihood activities of respondents in the selected communities while regression analysis was used determine the socio-economic factors promoting deforestation. Foster-Greer-Thorbecke indices was used to determine the poverty status of the respondents.
2.3.1 Smiths’s saliency
Smith’s saliency (or Smith’s) accounts for frequency of mention [14]. Free-list data reveal information about the items people list and the people who list them. The data inherently demonstrate a kind of cultural agreement [14].
Salience = Inverted rank/ Total rank
Inverted rank = Number of time a species is mentioned
Total rank = Total species mentioned
2.3.2 The Foster-Greer-Thorbecke indices
{FGT2}, puts higher weight on the poverty of the poorest individuals, making it a combined measure of poverty and income inequality and a popular choice within development economics. The individual indices within the family are derived by substituting different values of the parameter α into the following equati
∝= 1
( )∝
• Where; z is the poverty line
• Two types of poverty lines will be used in
this study;
• An absolute poverty line defined as the
equivalent of USD1 (i.e. N360) income per head per day; and
• A relative poverty line defined by two
third of the mean per capita household income among all the study respondents.
• N is the number of people in the
economy
Fig. 1. Map of Ogun State showing the study area
}, puts higher weight on the poverty of the individuals, making it a combined measure of poverty and income inequality and a popular choice within development economics. The individual indices within the family are derived by substituting different values of the parameter α into the following equation.
z is the poverty line
Two types of poverty lines will be used in
An absolute poverty line defined as the equivalent of USD1 (i.e. N360) income
A relative poverty line defined by two-third of the mean per capita household income among all the study respondents. N is the number of people in the
• H is the number of poor (those with
income at or below z),
• yi is the income of each individual i.
• q = the number of respondents below t
poverty line.
• α = FGT parameter, which takes the
values 0.1 and 2, with different
implications.
• α = 0, measures poverty incidence, the
proportion of those that are
impoverished.
• α = 1, measures poverty gap, giving
more weight to the poorest.
• α = 2, measures severity of poverty
• N = total number of respondents; Yi =
Per capita household income.
If alpha is low then the FGT metric weighs all the individuals with incomes below z roughly the same. The higher the value α, the greater the weight placed on the poorest individuals, the higher the FGT statistic, the more poverty there is in an economy.
Fig. 1. Map of Ogun State showing the study area
H is the number of poor (those with
is the income of each individual i. q = the number of respondents below the
α = FGT parameter, which takes the
values 0.1 and 2, with different
α = 0, measures poverty incidence, the
proportion of those that are
α = 1, measures poverty gap, giving more weight to the poorest.
measures severity of poverty N = total number of respondents; Yi = Per capita household income.
Osoba et al.;AJRAF, 3(3): 1-10, 2019; Article no.AJRAF.49889
Table 1. Showing sampling plan for the research work
Zone Villages No of respondents
A (Odeda) Odeda
Oluga
20 20
B (Ilugun) Apesin
Olodo
20 20
C (Opeji) Opeji
Alabata
20 20
Total six villages 120
Source: Field survey, 2019
3. RESULTS AND DISCUSSION
3.1 Socio-economic Characteristics of Respondents
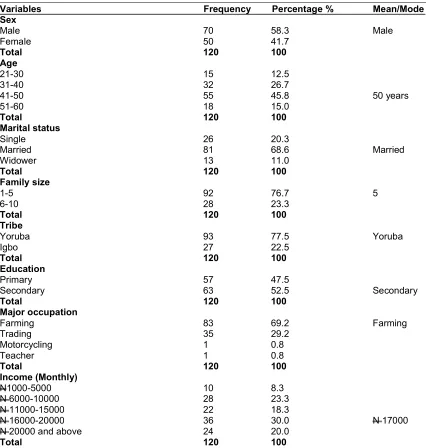
Table 2 indicates the socio-economic
characteristics of respondents in the study area. It shows that 58.3% were male while 41.7% were females. This is a clear indication of higher participation of male in forest income generating activities compared to females but both contributes immensely to deforestation. This agrees with the findings of [15] which reported that women prefer to engage in domestic chores near homestead rather than exploiting forest resources. The table further reveals that majority (45.8%) are between 41-50. A mean age of 50 years was reported for respondents. This implies that most of the respondents are gradually approaching the threshold of inactive years of their life and would still have time and energy for forest income generating activities which also poses to be a socio-economic factor promoting deforestation in Odeda local council of Ogun state. According to [16], older age group of over 60 years in these activities indicates the passage of knowledge to younger ones and also adaptability to such activities as regular and reliable source of income. The table further revealed that most of the respondents were married 68.6% while 20.3% and 11% were singles and widowers respectively. However, 76.7% of the respondents had between 1-5 persons per household while 23.3% had between 6-10 persons per household. A mean household size of 5 was obtained for respondents in the study area. The implication of this large household size is that more people will have to depend more on forest income
generating activities. This has negative
implication for household food security in the area due to land use intensification and resource
depletion from increased forest income
generation drive. The table further shows that
majority (77.5%) of the respondents in the study area belong to Yoruba tribe. This is actually due to the fact that the survey was carried out in a Yoruba dominated area. Table 2 further revealed that a larger part of the respondents had low literacy level with majority (52.5%) attaining only secondary school level of education. This often makes them engage in deforestation activities as noted by [16] which reported that formal education improves sustainable management of forest resources. [17] also identified low literacy level among the populace as one of the factors promoting deforestation which is a consequence effect on land use and biodiversity at large. Furthermore, this also agrees with the findings of [18] that farmers with more than four years of education found it easier to adopt new farm technologies thereby creating less negative impact on deforestation of the environment for agricultural/other activities. Table 2 also revealed that majority (69.2%) are farmers while 30% of the respondents had monthly income within the range of N16000 - N20000 Naira which shows that most of the respondents are low income earners. This prompts them to exploit the forest more often in a bid to supplement their income. This agrees with the findings of [19] which reported that the sales of non-timber forest products (NTFPs) contribute as much as a quarter of total household income in rural settlements.
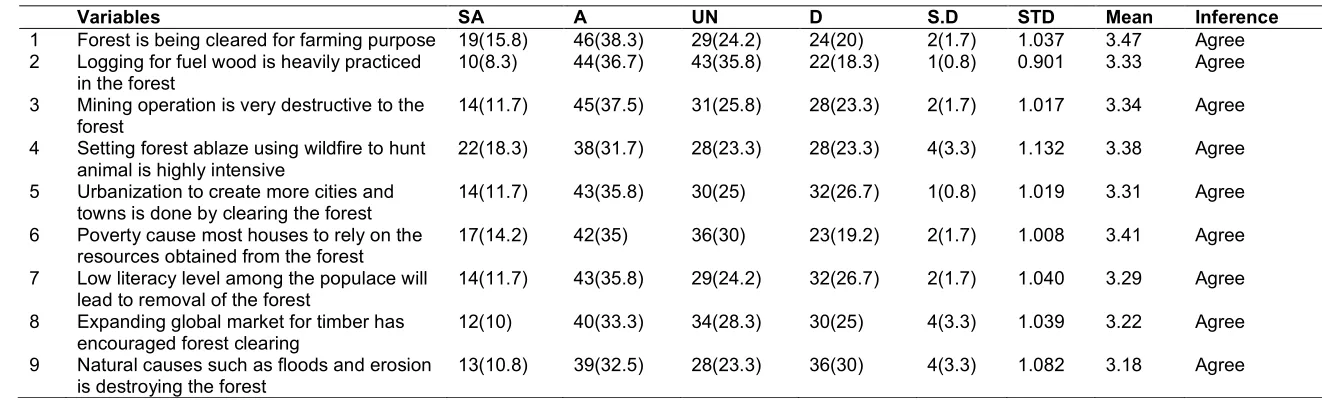
3.2 Causes of Deforestation
particularly Nigeria is directly linked to the current level of environmental pollution and degradation in the continent. The poor and the illiterate are often more interested in issues related to their daily survival than environmental management; this lack of interest and awareness often lead to more reckless environmental behavior which in turn breeds more environmental problems and leads to a vicious cycle of poverty. [21] also
noted that the process of deforestation is conventionally associated with direct causes or factors such as agricultural/pasture expansion and forest products consumption and export.
This perspective was buttressed by [22] who acknowledge that bush fires, indiscriminate
logging and conversion of forest to
farmland as the predominant causes of deforestation.
Table 2. Socio-economic characteristics of the respondents
Variables Frequency Percentage % Mean/Mode Sex
Male 70 58.3 Male
Female 50 41.7
Total 120 100
Age
21-30 15 12.5
31-40 32 26.7
41-50 55 45.8 50 years
51-60 18 15.0
Total 120 100
Marital status
Single 26 20.3
Married 81 68.6 Married
Widower 13 11.0
Total 120 100
Family size
1-5 92 76.7 5
6-10 28 23.3
Total 120 100
Tribe
Yoruba 93 77.5 Yoruba
Igbo 27 22.5
Total 120 100
Education
Primary 57 47.5
Secondary 63 52.5 Secondary
Total 120 100
Major occupation
Farming 83 69.2 Farming
Trading 35 29.2
Motorcycling 1 0.8
Teacher 1 0.8
Total 120 100
Income (Monthly)
N1000-5000 10 8.3
N 6000-10000 28 23.3
N 11000-15000 22 18.3
N 16000-20000 36 30.0 N 17000
N 20000 and above 24 20.0
Total 120 100
Osoba et al.;AJRAF, 3(3): 1-10, 2019; Article no.AJRAF.49889
7
Table 3. Respondents perception on the causes of deforestation
Variables SA A UN D S.D STD Mean Inference
1 Forest is being cleared for farming purpose 19(15.8) 46(38.3) 29(24.2) 24(20) 2(1.7) 1.037 3.47 Agree
2 Logging for fuel wood is heavily practiced
in the forest
10(8.3) 44(36.7) 43(35.8) 22(18.3) 1(0.8) 0.901 3.33 Agree
3 Mining operation is very destructive to the
forest
14(11.7) 45(37.5) 31(25.8) 28(23.3) 2(1.7) 1.017 3.34 Agree
4 Setting forest ablaze using wildfire to hunt
animal is highly intensive
22(18.3) 38(31.7) 28(23.3) 28(23.3) 4(3.3) 1.132 3.38 Agree
5 Urbanization to create more cities and
towns is done by clearing the forest
14(11.7) 43(35.8) 30(25) 32(26.7) 1(0.8) 1.019 3.31 Agree
6 Poverty cause most houses to rely on the
resources obtained from the forest
17(14.2) 42(35) 36(30) 23(19.2) 2(1.7) 1.008 3.41 Agree
7 Low literacy level among the populace will
lead to removal of the forest
14(11.7) 43(35.8) 29(24.2) 32(26.7) 2(1.7) 1.040 3.29 Agree
8 Expanding global market for timber has
encouraged forest clearing
12(10) 40(33.3) 34(28.3) 30(25) 4(3.3) 1.039 3.22 Agree
9 Natural causes such as floods and erosion
is destroying the forest
13(10.8) 39(32.5) 28(23.3) 36(30) 4(3.3) 1.082 3.18 Agree
Table 4. Smith’s salient value of respondents in the study area
Variables Frequency Percentage Saliency value
Firewood collection 16 13.3 0.1333
Lumbering 4 3.3 0.0333
Charcoal production 28 23.3 0.2333
Handicraft 27 22.5 0.2250
Fuel wood 18 15.0 0.1500
Hunting 18 15.0 0.1500
Herbal medicine 9 7.05 0.0705
Source: Field survey, 2019
Table 5. Poverty incidence, depth and severity among the respondents in all the areas
Locations Alabata Apesin Odeda Olodo Oluga Opeji Pooled
Poverty line 87120 125640 134280 126720 123840 138600 122700
Poverty incidence 10% 30.1% 25% 10% 40% 2.0% 21.67%
Poverty depth 10% 33.3% 10% 1.4% 34.4% 27.2% 5.094%
Poverty severity 0.053 0.16 0.016 0.001 0.124 0.182 0.027
Source: Field survey, 2019
3.3 Livelihood Activities in the
Community
Smith’s salient value was used to reveal the information about the livelihood activities listed by the respondents in the study area. Table 4 revealed that the respondents were involved in various livelihood activities which were specific to certain areas of study in the study area. According to ranking, it was observed that most
engaged in charcoal production (23.3%),
handicraft (22.5%), fuelwood (15%), hunting (15%) and firewood collection (13.3%). This is in line with [23] which reports that access to forest products is relatively uncomplicated and that goods and services from the forest are vital for the livelihoods and resilience of the poorest households, acting as safety nets in difficult times.
3.4 Poverty Incidence, Depth and Severity
The incidence, depth and severity of poverty among the respondents (Alabata, Apesin, Odeda, Olodo, Oluga, and Opeji, Pooled) were
determined using Foster, Greer-Thorbeck
method and the results are presented in Table 5. According to the results in Table 5, it was
observed that incidence of poverty (Po) estimated
21.67%. This implied that 21.67% (34 respondents) fell below the poverty line of N122700 Naira, while 78.33%% were above the poverty line. Also, with respects to depth of
poverty, P1, an average person requires 5.09%
of N122700 Naira to reach the poverty line.
More so, in relation to severity of poverty, P2 =
0.027.This indicates that the people were not severely poor because the value for poverty severity is far from 1. However, they were
resource poor farmers relying more on
subsistence farming for survival with heavy dependence on the fragile ecosystem. It was reported by [24] that a strong linkage exists between the economy and environment. Thus,
industrialization of the 21st century shows the
relationship between environment and the economy. The revolution brought transformation but with consequences on the environment. Therefore poverty status of the respondents was determined to identify its contribution to deforestation in the study area.
3.5 Socio-economic Factors Promoting Deforestation
The result in Table 6 shows there was relationship between socio-economic factors promoting deforestation and the marital status of the respondents; F (1, 118) = 5.204, p = 0.024.
The measure of R2 was 0.042 which means the
respondents marital status accounted for 4.2% of
the variation in the factors promoting
Osoba et al.;AJRAF, 3(3): 1-10, 2019; Article no.AJRAF.49889
Table 6. Regression of the determinants of the socio-economic factors promoting deforestation
Model df Mean square
F Sig R-square
Unstandardized coefficients
Standardized coefficients
t
B Std. Error
Marital status
1 2.914 5.204 0.024 0.042 -0.285 0.125 -0.206 -2.281*
118 0.560 119
*Significant at 5% (P<0.05) Source: Field survey, 2019
corroborates with (UNEP [25]) which reported that demographic change is the major driver of land cover change: its primary and most direct impact is through opening new land for
agricultural, settlement and infrastructural
development. The role of increased population growth and density and urbanization are major factors currently exerting immense pressure on forest resources in rural communities in developing countries.
4. CONCLUSION
This study revealed that poorer households on the lowest rung of the income ladder depend more heavily on non-timber forest products than wealthier families. This is so because poorer rural families are resource constrained and thus cannot take advantage of more profitable income generating opportunities, thereby leading to resource overdependence. This situation results in resource overexploitation and ultimately,
deforestation and degradation with dire
consequences for society. Therefore, Forestry extension programmes should be designed to increase the knowledge base of rural household land owners and managers to plan and
implement advanced natural resource
management.
ACKNOWLEDGEMENT
I acknowledge the moral and academic support of my mentors Dr. J.A Soaga, Dr. K.M Ogunjobi and Dr. M.A Yisau, their advice and constructive criticism has been the hallmark to the production end of this research. I also appreciate the contributions of my colleague Mr. Osoba, Mr. Bola and the rural communities of Odeda local government of Ogun State.
COMPETING INTERESTS
Authors have declared that no competing interests exist.
REFERENCES
1. Acharya KP, Dangi RB. Case studies on
measuring and assessing forest
degradation. Forest Degradation in Nepal, Review of Data and Methods; 2009.
2. Belcher B, Achdiawan R, Dewi S.
Forest-based livelihoods strategies conditioned by market remoteness and forest proximity in Jharkhand, India. World Development. 2015;66:269–279.
3. Aruofor RO. An economic appraisal of
pricing policy and tariff systems for
Gmelina arborea pulpwood and saw-log in
Nigeria. An unpublished M.sc thesis submitted to the Department of Forest Resources Management, University of Ibadan; 1999.
4. United National Framework Convention on
Climate Change. Report of the Conference of parties on its fifteenth session, held in Copenhagen from 7 - 13 December, 2011. Part two: Action taken by Conference of Parties at its fifteenth session. Decisions adopted by the Conference of the Parties. 2011;87.
5. Anonymous. Global forest resources
assessment main report. FAO Forestry Paper 140. Rome, Italy; 2010.
6. Gorte RW, Sheikh PA. Deforestation and
Climate Change, Congressional Research Service; 2010.
Available:http://www.fas.org/sgp/crs/misc/ R41144.pdf
(Retrieved 25/04/2018)
7. Ayanwuyi E, Oladosu O, Ogunlade I,
Kuponiyi F. Rural women perception of effects of deforestation on their economic activities in Ogbomoso area of Oyo state,
Nigeria. Pakistan Journal of Social
Sciences. 2007;4(3):474-479.
8. Central bank of Nigeria (CBN), 2006. CBN
9. Federal Ministry of Environment (FMEv). Nigeria approved national forest policy. Federal Government of Nigeria; 2006.
10. FORMECU/EMP. Assessment of Vegetal
and Land use Changes in Nigeria. Submitted by Geometrics International Inc, Ontario, Canada; 1998.
11. FAO. Global Forest Resources
Assessment, 2015. Rome, Italy.
12. Uyanga J. The plantation economy in the
Calabar region: a preliminary analysis. In Calabar and Environs: Geographic Studies (Inyang PEB, Usoro EJ, Abasiekong EM, Sule RAO, eds). Dept. of Geography, University of Calabar; 2012.
13. FOS, (2006). Annual Abstract of Statistics.
Federal Office of Statistics, Lagos, Nigeria edition. Smith JJ. Using ANTHROPAC 3.5 and a spreadsheet to compute a freelist salience index. Cultural Anthropology Methods Newsletter. 1993;5(3):1-3.
14. Weller SC, Romney AK. Systematic data
collection. Sage Publications, New Delhi; 1988.
15. Food and Agriculture Organization.
“Criteria and Indicators for Sustainable wood fuels”, in FAO Forestry, Paper 160, Electronic Publishing Policy and Support Branch, Viale Delle Terme di Caracalla, I-00100 Rome, Italy. 2009;5, 10 and 11.
16. Soaga JA. Socioeconomic Implications of
paradigm shifts in Ogun State Forestry. 2008;120-138.
17. Atanda TA. Economic incentives as a tool
for reducing deforestation in Egba Division of Ogun State, Nigeria. J. Appl. Sci. Environ. Manage. 2018;22(10):1685–1688.
18. Phillips JM. Farmer education and farmer
efficiency: A meta analysis. Economic Development and Cultural Change. 2011; 43(1):1496165.
19. Mallay B. Farmers’ tree management
strategies in a changing rural economy and factors influencing decisions on tree growing in Nepal. International Tree Crop Journal. 2000;10:247–266.
20. Adebayo AA. Federal University of
Technology, Yola 8th Inaugural Lecture:
Climate: Resource and Resistance to Agriculture. 2010;48:15-22.
21. Mahapatra K, Kant S. (2003) Tropical
Deforestation: A multinomial logistic
model and some country-specific policy prescriptions. Journal of Forest Policy and Economics. Elsevier. 2005;7:1-8.
22. Insaidoo TFG, Ros-Tonen MAF,
Hoogenbosch L, Acheampong E.
Addressing Forest Degradation and
Timber Deficits in Ghana, ETFRN News 53: April 2012.
23. FAO. Global Forest Resources
Assessment 2010 – Key Findings. Food and Agriculture Organization of the United Nations. Rome, Italy; 2010.
24. Soaga JA, Olorunfemi O, Makinde I.
Global economic crisis and market trend in local timber in Ogun State, Nigeria: The climate change advantage. In. Climate variability and change pattern: Impact, science, innovation and policy. Nigerian
Meteorological Society 30th annual
conference proceedings, 21st- 24th,
November, 2016.
25. United Nations Environmental Programme
(UNEP, 2006) Africa Environmental
Outlook 2: Our Environment, or Wealth. (Retrieved on 26th November, 2012) Available:http://www.unep.org/DEWA/Afric a/docs/en/AEO2_Our_Environ_Our_Wealt h.pdf
_________________________________________________________________________________
© 2019 Osoba et al.; This is an Open Access article distributed under the terms of the Creative Commons Attribution License
(http://creativecommons.org/licenses/by/4.0), which permits unrestricted use, distribution, and reproduction in any medium,
provided the original work is properly cited.
Peer-review history: