Morris, MA and Wilkins, E and Timmins, KA and Bryant, M and Birkin, M and Griffiths, C (2018)
Can big data solve a big problem? Reporting the obesity data landscape in line with the Foresight
obesity system map. International Journal of Obesity, 42. pp. 1963-1976. ISSN 1476-5497 DOI:
https://doi.org/10.1038/s41366-018-0184-0
Link to Leeds Beckett Repository record:
http://eprints.leedsbeckett.ac.uk/5389/
Document Version:
Article
Creative Commons: Attribution-Noncommercial 4.0
The aim of the Leeds Beckett Repository is to provide open access to our research, as required by
funder policies and permitted by publishers and copyright law.
The Leeds Beckett repository holds a wide range of publications, each of which has been
checked for copyright and the relevant embargo period has been applied by the Research Services
team.
We operate on a standard take-down policy.
If you are the author or publisher of an output
and you would like it removed from the repository, please
contact us
and we will investigate on a
case-by-case basis.
https://doi.org/10.1038/s41366-018-0184-0
A R T I C L E
Epidemiology and Population Health
Can big data solve a big problem? Reporting the obesity data
landscape in line with the Foresight obesity system map
Michelle A. Morris
1●Emma Wilkins
2●Kate A. Timmins
3●Maria Bryant
4●Mark Birkin
5●Claire Grif
fi
ths
2Received: 6 October 2017 / Revised: 7 March 2018 / Accepted: 9 April 2018 © The Author(s) 2018. This article is published with open access
Abstract
Background
Obesity research at a population level is multifaceted and complex. This has been characterised in the UK by
the Foresight obesity systems map, identifying over 100 variables, across seven domain areas which are thought to in
fl
uence
energy balance, and subsequent obesity. Availability of data to consider the whole obesity system is traditionally lacking.
However, in an era of big data, new possibilities are emerging. Understanding what data are available can be the
fi
rst
challenge, followed by an inconsistency in data reporting to enable adequate use in the obesity context. In this study we map
data sources against the Foresight obesity system map domains and nodes and develop a framework to report big data for
obesity research. Opportunities and challenges associated with this new data approach to whole systems obesity research are
discussed.
Methods
Expert opinion from the ESRC Strategic Network for Obesity was harnessed in order to develop a data source
reporting framework for obesity research. The framework was then tested on a range of data sources. In order to assess
availability of data sources relevant to obesity research, a data mapping exercise against the Foresight obesity systems map
domains and nodes was carried out.
Results
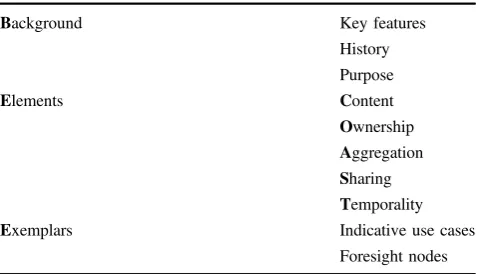
A reporting framework was developed to recommend the reporting of key information in line with these headings:
Background; Elements; Exemplars; Content; Ownership; Aggregation; Sharing; Temporality (COAST). The new
BEE-COAST framework was successfully applied to eight exemplar data sources from the UK. 80% coverage of the Foresight
obesity systems map is possible using a wide range of big data sources. The remaining 20% were primarily biological
measurements often captured by more traditional laboratory based research.
Conclusions
Big data offer great potential across many domains of obesity research and need to be leveraged in conjunction
with traditional data for societal bene
fi
t and health promotion.
Introduction
The basic drivers of obesity are simple (more energy
con-sumed than expended); however, the aetiology is complex.
It is now widely accepted that multiple factors, including
physiological, social and environmental, act synergistically
to drive obesity. These factors are often described as the
‘
obesogenic
’
environment (an environment that hinders
suf
fi
cient physical activity and promotes excessive intake of
food, thereby making obesity more likely). This may
explain the limited success
–
at a population level
–
of
traditional approaches to obesity prevention and
manage-ment, which have tended to focus on behavioural,
educa-tional and pharmacological factors. For this reason, many
researchers and policymakers are now advocating for
‘
whole systems
’
approaches to obesity prevention and
management,
which
promote
integrated
systems
to
These authors contributed equally: Michelle A. Morris and EmmaWilkins contributed equally asfirst author and Mark Birkin and Claire Griffiths contributed equally as last author.
* Michelle A. Morris [email protected]
1 Leeds Institute for Data Analytics and School of Medicine, University of Leeds, Leeds LS2 9JT, UK
2 School of Sport, Leeds Beckett University, Leeds LS6 3QQ, UK
3 School of Sport and Exercise Science, College of Social Science, University of Lincoln, Lincoln LN6 7TS, UK
4 Leeds Institute of Clinical Trials Research, University of Leeds,
Leeds LS2 9JT, UK
5 Leeds Institute for Data Analytics and School of Geography,
University of Leeds, Leeds LS2 9JT, UK
Electronic supplementary materialThe online version of this article
(https://doi.org/10.1038/s41366-018-0184-0) contains supplementary material, which is available to authorised users.
123456789
0();,:
123456789
address obesity, rather than focusing on risk factors in
isolation [1
–
3].
In 2007, the Foresight Report
—
the most comprehensive
UK investigation into obesity and its causes [1]
—
described
obesity as a
“
complex web of societal and biological factors
that have, in recent decades, exposed our inherent human
vulnerability to weight gain
”
. The investigation produced an
obesity system map, with energy balance at its centre.
Around this, over 100 variables are split into seven domains
that are thought to directly or indirectly in
fl
uence energy
balance.
Knowing that individual (e.g., genetics, age, gender and
ethnicity), social (income, education, area deprivation) and
area factors (e.g., access to fast food, street connectivity)
contribute towards obesity is useful [4
–
6] and has identi
fi
ed
key areas to target prevention and/or treatment. However,
the key is understanding the interplay between these factors,
which is currently lacking. The complex, nonlinear and
unpredictable relationships of how systems interact will
offer insight into the development and evaluation of
sys-tems based approaches, moving away from siloed thinking
[7]. Data required to
fi
ll gaps in traditional resources and to
enable research using a whole systems approach are
inherently dif
fi
cult to collect, especially on a large scale. For
this reason, new and emerging data sources are increasingly
gaining attention.
Internationally, a broader understanding of risk factors
for obesity and increasing awareness of the social
deter-minants have led to recognition of the need for more
comprehensive, cross sectoral strategies to tackle obesity
[8].
The preceding paper in this series [9] reviewed how
‘
found
’
data sources, often referred to as
‘
big data
’
, have
been utilised in the literature to better understand obesity.
Data on our activity, behaviour and location, from sources
as diverse as smart motorways, social media, store loyalty
cards and consumer organisations, have been shown to offer
fruitful research opportunities, contributing in ways where
traditionally sourced research data perhaps could not.
This second paper from the Economic and Social
Research Council (ESRC) Strategic Network for Obesity
builds on this description of how
‘
big
’
or
‘
found
’
data has
been used to date, and considers the future potential of these
data to enhance a
‘
whole systems
’
understanding of obesity.
Identifying new types of data becoming available and
mapping these onto the domains de
fi
ned in the Foresight
Obesity System Map should reveal the extent to which such
data may be capable of addressing the whole system.
One challenge that potentially precludes the use of big
data to their full potential is a lack of awareness and
understanding around what data exist. Aspects of these new
big data sources, such as the volume, variety, velocity and
veracity are often challenging to conceptualise and capture.
It is therefore also crucial that ways are found to
commu-nicate the potential (and limitations) of new, as yet
untap-ped, data sources, across disciplines and sectors, to facilitate
the move towards a whole systems approach to obesity.
In this paper, we aimed to:
1. Develop a framework in which to effectively report
big data for use under a whole systems obesity lens.
2. Use the new framework to report indicative exemplar
data types in line with the Foresight obesity system
map domain areas.
3. Identify big data sources for use in whole systems
obesity research and map these against the Foresight
obesity systems map.
4. Discuss key challenges associated with using new and
large data sources to analyse obesity from a whole
systems perspective.
Methods
This paper is one output from a collaborative network of
academic researchers, industry partners, charity
repre-sentatives and members from the public sector. We
con-vened 40 members and hosted 5 network meetings between
2015 and 2017 Editorial is
2018IJO00672R. During these
meetings, members shared: experiences of using big data
for obesity research, knowledge of suitable data sources,
and expert opinion on how to optimise this wealth of data.
For the purpose of this paper, big data were de
fi
ned
syno-nymously with
‘
non-traditional
’
data; in other words, any
data not collected speci
fi
cally for academic research
purposes.
Synthesis of expert opinion on optimising data,
culmi-nated in the development of a reporting framework. The
purpose of this framework was to outline a structure for
reporting the features of big data in obesity research,
although its application may be valid outside the obesity
research area.
The reporting framework was then applied to eight
exemplar data sets, to demonstrate its usefulness in
com-municating important data details. The foresight obesity
systems map was indexed with domain and node identi
fi
ers
(presented in the supplementary material). We use
indica-tive use cases to present the relevant foresight nodes within
the exemplar reporting.
as a resource in understanding the obesity system. The list
of data sets was thus a convenience sample, based on data
sets that were familiar to network members. The mapping
exercise was supplemented with one more traditional and
comprehensive dataset, the UK Biobank cohort, to highlight
how combination of different types of data might be used
together.
For other application areas (i.e., not obesity) this exercise
could be repeated with reference to another domain speci
fi
c
theoretical framework.
Results
BEE-COAST framework
ESRC Strategic network for obesity members agreed that,
for all new data sources, it is essential to provide some
background (
B
) on the history and purpose of how and why
the data are generated, including key features of the data.
This is especially important when data are used in a context
for which they were not initially collected. Detailed
description of the Elements (
E
) of the data that are required
for others to fully understand their potential application.
These Elements encompass detailed Content (
C
),
Owner-ship (
O
), level of aggregation, for example individual,
neighbourhood, regional or national (
A
), conditions related
to Sharing (
S
) and Temporality (
T
) of the data. Finally,
these datasets should be illustrated using Exemplars (
E
) to
include the format of the data and indicative use cases
(Table
1).
Reporting data sources
Eight exemplar data sources were included in this review as
providing valuable data for use in a whole systems obesity
research: (i) Ordnance Survey Points of Interest data; (ii)
Food Standards Agency food hygiene data; (iii)
super-market loyalty card data; (iv) physical activity applications/
wearables; (v) new technologies to record diet; (vi) Acxiom
data; (vii) Cameo data from Callcredit and (viii) YouGov
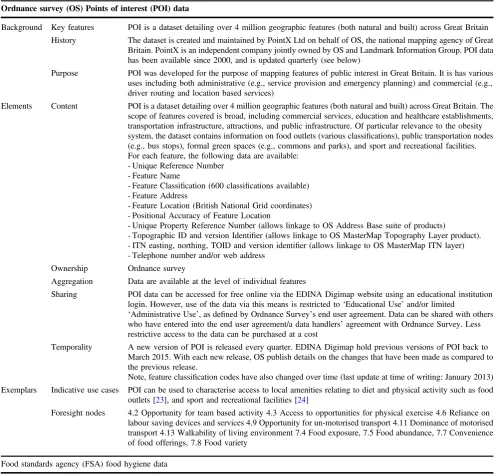
data. The features of these datasets are summarised in
Table
2
in accordance with the BEE-COAST reporting
framework. Collectively, the exemplar data sets were found
to map to 56 Foresight nodes, covering all 7 Foresight
domains.
Mapping data sources to Foresight domains and
nodes
The list of data sources and how these map onto the
Fore-sight nodes can be seen in Table
3. Overall, 86/108 of the
Foresight nodes are covered by at least one big dataset.
When traditional cohort data is also included (UK Biobank),
this increases to 89/108 nodes.
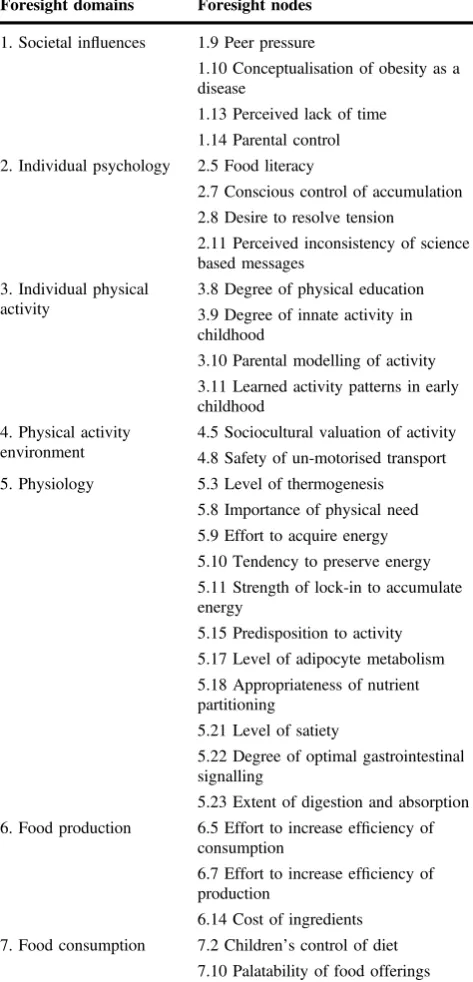
Absence of mapping to Foresight domains and
nodes
Table
4
highlights the areas in which big data are, to the
best of our knowledge, not readily available to map against
Foresight domains and nodes. We believe that information
relating to many of these nodes would typically be
gener-ated by research studies, which often recruit, relatively
speaking, small number of participants. Whilst participant
numbers may be small, the number of data points may be
large. Some of the nodes would likely require qualitative
research to capture relevant data.
Discussion
The aim of this paper was to explore the potential role of
so-called
‘
big data
’
in a whole systems approach to obesity. By
mapping a small but varied selection of emerging data types
onto the Foresight obesity system map, it is apparent that
big data span 80% of nodes, and therefore could prove
important in providing the breadth and depth of
physiolo-gical, social, and environmental information needed to
simultaneously examine inter-related risk factors for obesity
in different populations and across multiple levels. Through
this mapping exercise we highlight the wide variety of data
which could be better exploited alongside existing research
or for new, interdisciplinary, obesity research questions.
[image:4.595.51.291.576.713.2]Data which span the whole of the obesity system are
dif
fi
cult and time-consuming to collect, particularly on a
large scale. Big data have been heralded as a potential
solution to this problem, with such data being generated
—
largely passively
—
at an ever-increasing rate and across a
range of contexts. This is the
fi
rst time the potential for big
data has been evaluated in a whole systems context. Our
data audit has shown the potential value of big data within
Table 1 BEE-COAST frameworkBackground Key features
History
Purpose
Elements Content
Ownership
Aggregation
Sharing
Temporality
Exemplars Indicative use cases
Table 2 Example data sources reported in the BEE-COAST framework
Ordnance survey (OS) Points of interest (POI) data
Background Key features POI is a dataset detailing over 4 million geographic features (both natural and built) across Great Britain
History The dataset is created and maintained by PointX Ltd on behalf of OS, the national mapping agency of Great Britain. PointX is an independent company jointly owned by OS and Landmark Information Group. POI data has been available since 2000, and is updated quarterly (see below)
Purpose POI was developed for the purpose of mapping features of public interest in Great Britain. It is has various uses including both administrative (e.g., service provision and emergency planning) and commercial (e.g., driver routing and location based services)
Elements Content POI is a dataset detailing over 4 million geographic features (both natural and built) across Great Britain. The scope of features covered is broad, including commercial services, education and healthcare establishments, transportation infrastructure, attractions, and public infrastructure. Of particular relevance to the obesity system, the dataset contains information on food outlets (various classifications), public transportation nodes (e.g., bus stops), formal green spaces (e.g., commons and parks), and sport and recreational facilities. For each feature, the following data are available:
- Unique Reference Number - Feature Name
- Feature Classification (600 classifications available) - Feature Address
- Feature Location (British National Grid coordinates) - Positional Accuracy of Feature Location
- Unique Property Reference Number (allows linkage to OS Address Base suite of products)
- Topographic ID and version Identifier (allows linkage to OS MasterMap Topography Layer product). - ITN easting, northing, TOID and version identifier (allows linkage to OS MasterMap ITN layer) - Telephone number and/or web address
Ownership Ordnance survey
Aggregation Data are available at the level of individual features
Sharing POI data can be accessed for free online via the EDINA Digimap website using an educational institution login. However, use of the data via this means is restricted to‘Educational Use’and/or limited
‘Administrative Use’, as defined by Ordnance Survey’s end user agreement. Data can be shared with others who have entered into the end user agreement/a data handlers’agreement with Ordnance Survey. Less restrictive access to the data can be purchased at a cost
Temporality A new version of POI is released every quarter. EDINA Digimap hold previous versions of POI back to March 2015. With each new release, OS publish details on the changes that have been made as compared to the previous release.
Note, feature classification codes have also changed over time (last update at time of writing: January 2013) Exemplars Indicative use cases POI can be used to characterise access to local amenities relating to diet and physical activity such as food
outlets [23], and sport and recreational facilities [24]
Foresight nodes 4.2 Opportunity for team based activity 4.3 Access to opportunities for physical exercise 4.6 Reliance on labour saving devices and services 4.9 Opportunity for un-motorised transport 4.11 Dominance of motorised transport 4.13 Walkability of living environment 7.4 Food exposure, 7.5 Food abundance, 7.7 Convenience of food offerings, 7.8 Food variety
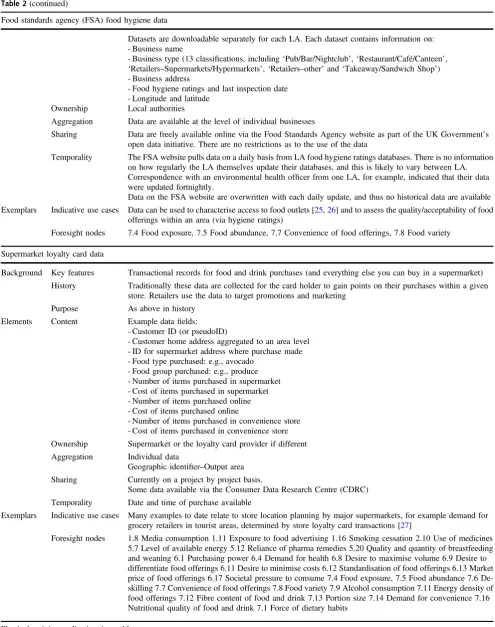
Food standards agency (FSA) food hygiene data
Background Key features FSA data contains locational, functional (i.e., business type) and hygiene rankings information on food businesses in the UK
History Under UK law any business intending to conduct‘food operations’(including selling, cooking food, storing, handling, preparing or distributing food) must register their business with the environmental health department of their Local Authority (LA). This is then used by the environmental health team to conduct food hygiene inspections and enforce food law.
The register is updated by a LA when a business registers its intention to conduct food operations, and businesses are removed when registered businesses inform a LA of their intention to terminate food operations. Data are also updated when environmental health officers conduct food hygiene inspections. The frequency of such inspection will depend on the initial food hygiene rating assigned to the business
Purpose As above in history
Table 2(continued)
Food standards agency (FSA) food hygiene data
Datasets are downloadable separately for each LA. Each dataset contains information on: - Business name
- Business type (13 classifications, including‘Pub/Bar/Nightclub’,‘Restaurant/Café/Canteen’,
‘Retailers–Supermarkets/Hypermarkets’,‘Retailers–other’and‘Takeaway/Sandwich Shop’) - Business address
- Food hygiene ratings and last inspection date - Longitude and latitude
Ownership Local authorities
Aggregation Data are available at the level of individual businesses
Sharing Data are freely available online via the Food Standards Agency website as part of the UK Government’s open data initiative. There are no restrictions as to the use of the data
Temporality The FSA website pulls data on a daily basis from LA food hygiene ratings databases. There is no information on how regularly the LA themselves update their databases, and this is likely to vary between LA. Correspondence with an environmental health officer from one LA, for example, indicated that their data were updated fortnightly.
Data on the FSA website are overwritten with each daily update, and thus no historical data are available
Exemplars Indicative use cases Data can be used to characterise access to food outlets [25,26] and to assess the quality/acceptability of food offerings within an area (via hygiene ratings)
Foresight nodes 7.4 Food exposure, 7.5 Food abundance, 7.7 Convenience of food offerings, 7.8 Food variety
Supermarket loyalty card data
Background Key features Transactional records for food and drink purchases (and everything else you can buy in a supermarket)
History Traditionally these data are collected for the card holder to gain points on their purchases within a given store. Retailers use the data to target promotions and marketing
Purpose As above in history
Elements Content Example datafields: - Customer ID (or pseudoID)
- Customer home address aggregated to an area level - ID for supermarket address where purchase made - Food type purchased: e.g., avocado
- Food group purchased: e.g., produce - Number of items purchased in supermarket - Cost of items purchased in supermarket - Number of items purchased online - Cost of items purchased online
- Number of items purchased in convenience store - Cost of items purchased in convenience store
Ownership Supermarket or the loyalty card provider if different
Aggregation Individual data
Geographic identifier–Output area Sharing Currently on a project by project basis.
Some data available via the Consumer Data Research Centre (CDRC)
Temporality Date and time of purchase available
Exemplars Indicative use cases Many examples to date relate to store location planning by major supermarkets, for example demand for grocery retailers in tourist areas, determined by store loyalty card transactions [27]
Foresight nodes 1.8 Media consumption 1.11 Exposure to food advertising 1.16 Smoking cessation 2.10 Use of medicines 5.7 Level of available energy 5.12 Reliance of pharma remedies 5.20 Quality and quantity of breastfeeding and weaning 6.1 Purchasing power 6.4 Demand for health 6.8 Desire to maximise volume 6.9 Desire to differentiate food offerings 6.11 Desire to minimise costs 6.12 Standardisation of food offerings 6.13 Market price of food offerings 6.17 Societal pressure to consume 7.4 Food exposure, 7.5 Food abundance 7.6 De-skilling 7.7 Convenience of food offerings 7.8 Food variety 7.9 Alcohol consumption 7.11 Energy density of food offerings 7.12 Fibre content of food and drink 7.13 Portion size 7.14 Demand for convenience 7.16 Nutritional quality of food and drink 7.1 Force of dietary habits
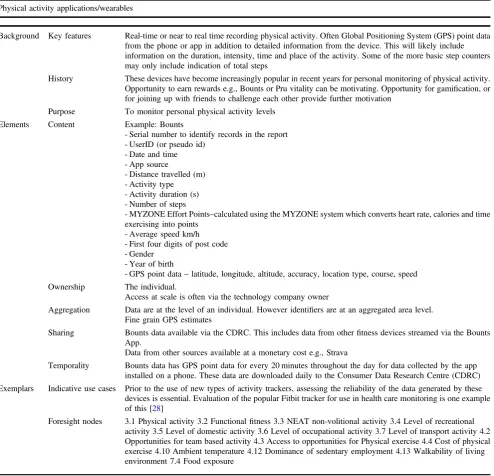
Table 2(continued)
Physical activity applications/wearables
Background Key features Real-time or near to real time recording physical activity. Often Global Positioning System (GPS) point data from the phone or app in addition to detailed information from the device. This will likely include information on the duration, intensity, time and place of the activity. Some of the more basic step counters may only include indication of total steps
History These devices have become increasingly popular in recent years for personal monitoring of physical activity. Opportunity to earn rewards e.g., Bounts or Pru vitality can be motivating. Opportunity for gamification, or for joining up with friends to challenge each other provide further motivation
Purpose To monitor personal physical activity levels
Elements Content Example: Bounts
- Serial number to identify records in the report - UserID (or pseudo id)
- Date and time - App source
- Distance travelled (m) - Activity type - Activity duration (s) - Number of steps
- MYZONE Effort Points–calculated using the MYZONE system which converts heart rate, calories and time exercising into points
- Average speed km/h - First four digits of post code - Gender
- Year of birth
- GPS point data–latitude, longitude, altitude, accuracy, location type, course, speed
Ownership The individual.
Access at scale is often via the technology company owner
Aggregation Data are at the level of an individual. However identifiers are at an aggregated area level. Fine grain GPS estimates
Sharing Bounts data available via the CDRC. This includes data from otherfitness devices streamed via the Bounts App.
Data from other sources available at a monetary cost e.g., Strava
Temporality Bounts data has GPS point data for every 20 minutes throughout the day for data collected by the app installed on a phone. These data are downloaded daily to the Consumer Data Research Centre (CDRC)
Exemplars Indicative use cases Prior to the use of new types of activity trackers, assessing the reliability of the data generated by these devices is essential. Evaluation of the popular Fitbit tracker for use in health care monitoring is one example of this [28]
Foresight nodes 3.1 Physical activity 3.2 Functionalfitness 3.3 NEAT non-volitional activity 3.4 Level of recreational activity 3.5 Level of domestic activity 3.6 Level of occupational activity 3.7 Level of transport activity 4.2 Opportunities for team based activity 4.3 Access to opportunities for Physical exercise 4.4 Cost of physical exercise 4.10 Ambient temperature 4.12 Dominance of sedentary employment 4.13 Walkability of living environment 7.4 Food exposure
Web-based or smartphone apps to record diet
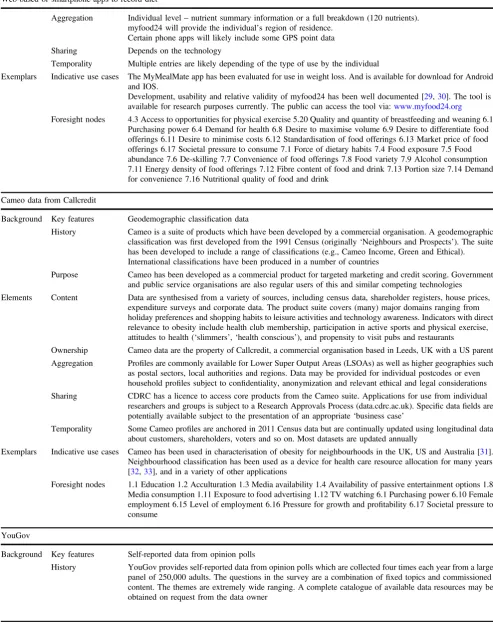
Background Key features Using new technologies to record diet offer two new key features: opportunity to select from a wide range of food and beverage products and a timely in depth nutrient breakdown of foods recorded as consumed
History Traditionally recording of diet has been done through paper based questionnaires and diaries which are burdensome for participants to complete and for researched to code in nutrient composition software. Nutrient composition software typically only include nutrient breakdown for ~3200 foods, whereas tools like myfood24 offer nutrient composition of ~45000 food at the push of a button
Purpose New technologies enable timely recording of diet for personal use and for research purposes
Elements Content Self-reported dietary consumption including elements such as: meal slot, time of day, branded and/or generic items, scanned unique product codes (UPC;‘bar codes’), portion size, own recipes, photos of meals, nutrient composition of foods
Table 2(continued)
Web-based or smartphone apps to record diet
Aggregation Individual level–nutrient summary information or a full breakdown (120 nutrients). myfood24 will provide the individual’s region of residence.
Certain phone apps will likely include some GPS point data
Sharing Depends on the technology
Temporality Multiple entries are likely depending of the type of use by the individual
Exemplars Indicative use cases The MyMealMate app has been evaluated for use in weight loss. And is available for download for Android and IOS.
Development, usability and relative validity of myfood24 has been well documented [29,30]. The tool is available for research purposes currently. The public can access the tool via:www.myfood24.org
Foresight nodes 4.3 Access to opportunities for physical exercise 5.20 Quality and quantity of breastfeeding and weaning 6.1 Purchasing power 6.4 Demand for health 6.8 Desire to maximise volume 6.9 Desire to differentiate food offerings 6.11 Desire to minimise costs 6.12 Standardisation of food offerings 6.13 Market price of food offerings 6.17 Societal pressure to consume 7.1 Force of dietary habits 7.4 Food exposure 7.5 Food abundance 7.6 De-skilling 7.7 Convenience of food offerings 7.8 Food variety 7.9 Alcohol consumption 7.11 Energy density of food offerings 7.12 Fibre content of food and drink 7.13 Portion size 7.14 Demand for convenience 7.16 Nutritional quality of food and drink
Cameo data from Callcredit
Background Key features Geodemographic classification data
History Cameo is a suite of products which have been developed by a commercial organisation. A geodemographic classification wasfirst developed from the 1991 Census (originally‘Neighbours and Prospects’). The suite has been developed to include a range of classifications (e.g., Cameo Income, Green and Ethical). International classifications have been produced in a number of countries
Purpose Cameo has been developed as a commercial product for targeted marketing and credit scoring. Government and public service organisations are also regular users of this and similar competing technologies
Elements Content Data are synthesised from a variety of sources, including census data, shareholder registers, house prices, expenditure surveys and corporate data. The product suite covers (many) major domains ranging from holiday preferences and shopping habits to leisure activities and technology awareness. Indicators with direct relevance to obesity include health club membership, participation in active sports and physical exercise, attitudes to health (‘slimmers’,‘health conscious’), and propensity to visit pubs and restaurants
Ownership Cameo data are the property of Callcredit, a commercial organisation based in Leeds, UK with a US parent
Aggregation Profiles are commonly available for Lower Super Output Areas (LSOAs) as well as higher geographies such as postal sectors, local authorities and regions. Data may be provided for individual postcodes or even household profiles subject to confidentiality, anonymization and relevant ethical and legal considerations Sharing CDRC has a licence to access core products from the Cameo suite. Applications for use from individual researchers and groups is subject to a Research Approvals Process (data.cdrc.ac.uk). Specific datafields are potentially available subject to the presentation of an appropriate‘business case’
Temporality Some Cameo profiles are anchored in 2011 Census data but are continually updated using longitudinal data about customers, shareholders, voters and so on. Most datasets are updated annually
Exemplars Indicative use cases Cameo has been used in characterisation of obesity for neighbourhoods in the UK, US and Australia [31]. Neighbourhood classification has been used as a device for health care resource allocation for many years [32,33], and in a variety of other applications
Foresight nodes 1.1 Education 1.2 Acculturation 1.3 Media availability 1.4 Availability of passive entertainment options 1.8 Media consumption 1.11 Exposure to food advertising 1.12 TV watching 6.1 Purchasing power 6.10 Female employment 6.15 Level of employment 6.16 Pressure for growth and profitability 6.17 Societal pressure to consume
YouGov
Background Key features Self-reported data from opinion polls
this
fi
eld. Furthermore, value does not only arise from the
advances in research, but
fi
nancially through reduction in
[image:9.595.49.552.59.665.2]cost of primary data collection, which can result in both
researcher and participant burden.
Table 2(continued)
YouGov
Purpose Data were originally collected as a basis for political polls (under the organisation’s original name of Gallup). Commercial and social questions have been developed more recently
Elements Content Data spans many thematic areas including consumers, digital, politics, public services, brand profiles,
financial services and sports
Ownership Data are generated and maintained by YouGov on a commercial basis
Aggregation Data are available as cross-classified individual responses which are coded down to a geography of 400+ local authority areas. Demographics are coded by broad categories e.g., gender, age (five groups), social class (six groups)
Sharing The CDRC has a licence for data in three key areas of mobility, retail and sustainability. The variables relevant to health include product consumption (e.g., meat, vegetables, alcohol, carbonated drinks, confectionery and snacks); eating habits (self-classified) and concerns about food (e.g., salt, sugar, fats, gluten). Commissioned tables can potentially be generated at a modest but commercial rate
Temporality Data are updated quarterly.
Exemplars Indicative use cases YouGov data have been regularly used [34]. Current work is considering the relationship between supermarket accessibility and electronic delivery of groceries, in which individual level choices are a useful feature.
Foresight nodes 1.1 Education 1.5 Sociocultural valuation of food 2.9 Demand for indulgence/compensation 3.7 Level of transport activity 4.6 Reliance on labour saving devices and services 6.2 Pressure to improve access to food offerings 6.3 Pressure to cater for acquired tastes 6.4 Demand for health 7.1 Force of dietary habits 7.3 Tendency to graze 7.4 Food exposure 7.5 Food abundance 7.6 De-skilling 7.7 Convenience of food offerings 7.8 Food variety 7.9 Alcohol consumption 7.11 Energy density of food offerings 7.12 Fibre content of food and drink 7.13 Portion size 7.14 Demand for convenience 7.16 Nutritional quality of food and drink
Acxiom
Background Key features Self-reported data from voluntary consumption surveys
History Acxiom is a very large poll collected in the order of one million returns every year. The data are primarily sourced from product guarantees and media (e.g., newspaper) inserts
Purpose Data are from market research and widely used in marketing, advertising and also within local government
Elements Content Data includes basic demographics (age, gender, household composition) but also income and expenditure attributes. Relevant to obesity, it includes consumption profiles and lifestyle attitudes including sports and leisure pursuits. The content of irregular commissioned tables ranges from interest in holidays in Yorkshire to purchase of pet foods
Ownership Acxiom is a private company which is now part of the VNU multi-media transnational corporation. The majority of the data owned by Acxiom are only accessible through commercial licence
Aggregation Data are at individual level, coded to unit postcodes and classified by demographics and other self-reported categories for activity, behaviour and consumption variables
Sharing Income and household composition profiles for unit postcodes (1.2 million streets) are licensed for the use of CDRC and its partners. Data relate to calendar year 2014
Temporality Data have been collected since at least 2005, with many variables captured on a recurrent basis. Composition of the sample varies from year to year according to responsiveness of consumers and their exposure to the questionnaires
Exemplars Indicative use cases Exploration of the Acxiom data in the context of household migration has been undertaken by Thomas (2014) [35]. Use of the data in the context of retail consumption in times of austerity and the“credit crunch” have been considered by Thompson (2013) [36] and Clarke (2015) [37]. These academic studies have explored and reweighted for skews and variable quality of the individual returns
Whilst the broad coverage of big data across the obesity
system map offers exciting possibilities for research, it is
important to acknowledge that big data are not the complete
solution to a whole systems approach. The remaining 20%
of nodes on the Foresight obesity system map were not
directly featured in our data mapping exercise
–
for
exam-ple, genetic and physiological variables relating to appetite
control, metabolic rate and predisposition to obesity. Many
of these unmapped nodes represent data that are commonly
collected in traditional research, and recent large-scale
initiatives (e.g., UK Biobank [10,
15] and other ongoing
longitudinal cohort studies [11
–
13]) will continue to
con-tribute important large-scale data. This suggests that big
data should be used to supplement and enhance traditional
datasets. Indeed, this paper does not advocate for the use of
big data in place of traditional data, but rather to
comple-ment traditional data and of course be considered in the
context of the research [14].
An important aim of this paper was to develop and
demonstrate a framework (BEE-COAST) for reporting big
data that describes emerging data through a whole systems
obesity lens. The framework was shown to successfully
summarise and communicate the important features of a
number of data sources, including vital information about
ownership and sharing, as well as content. It is suggested
that this framework should be used to report big data
sources used in research. It is also proposed that this
fra-mework could be used to develop a reference list of big data
sources as a resource for future research, akin to published
data resources pro
fi
les. Its application may also be valid
outside the obesity research area.
While the BEE-COAST framework goes some way to
elucidating the available
‘
big data
’
for obesity research,
further data sources still need to be made available to
increase coverage of the Foresight obesity system map.
Increased multidisciplinary may facilitate this. For example,
while our data audit did not highlight much data relating to
food production, data are certainly being captured across
this domain, for example by satellites, the instrumentation
of farms, and data driven control within the manufacturing
process. Such sources are not necessarily evident or
accessible to a research community around obesity.
Inter-disciplinary networks such as the ESRC
’
s Strategic
Net-work for Obesity, and repositories such as the CDRC,
provide
a
long-term
opportunity
to
ameliorate
this
dif
fi
culty.
[image:12.595.51.288.75.567.2]We have seen that variables as diverse as physical
activity behaviours, built environment features, food
con-sumption and choice are all richly captured by emerging
sources of data. However, in spite of the existence of these
data, we may not yet be in a position to utilise them to their
full potential due to restrictions around data access and
linkage. While individual-level data exists (e.g., relating to
physical activity behaviours), at times these data cannot be
released at an individualised level due to con
fi
dentiality and
anonymity restrictions. Individual-level linkage is only
possible with explicit consent. This has implications for
data linkage, as data are often released (and thus must be
linked) at a neighbourhood level, or larger, rather than at the
individual level. Such area-level linkage is less than ideal,
as potentially important within-neighbourhood variability is
lost, and analyses are subject to bias (e.g., the ecological
fallacy). Innovative approaches to data sharing and linkage
Table 4 Unmapped Foresight obesity system map domains and nodesForesight domains Foresight nodes
1. Societal influences 1.9 Peer pressure
1.10 Conceptualisation of obesity as a disease
1.13 Perceived lack of time
1.14 Parental control
2. Individual psychology 2.5 Food literacy
2.7 Conscious control of accumulation
2.8 Desire to resolve tension
2.11 Perceived inconsistency of science based messages
3. Individual physical activity
3.8 Degree of physical education
3.9 Degree of innate activity in childhood
3.10 Parental modelling of activity
3.11 Learned activity patterns in early childhood
4. Physical activity environment
4.5 Sociocultural valuation of activity
4.8 Safety of un-motorised transport
5. Physiology 5.3 Level of thermogenesis
5.8 Importance of physical need
5.9 Effort to acquire energy
5.10 Tendency to preserve energy
5.11 Strength of lock-in to accumulate energy
5.15 Predisposition to activity
5.17 Level of adipocyte metabolism
5.18 Appropriateness of nutrient partitioning
5.21 Level of satiety
5.22 Degree of optimal gastrointestinal signalling
5.23 Extent of digestion and absorption
6. Food production 6.5 Effort to increase efficiency of consumption
6.7 Effort to increase efficiency of production
6.14 Cost of ingredients
7. Food consumption 7.2 Children’s control of diet
are needed. As an example, UK Biobank [15] overcomes
this problem by releasing individual-level addresses for
linkage with other datasets prior to the release of the main
cohort data. In this model, the researcher can link the
addresses with any secondary datasets, and then return this
linked data to UK Biobank to be joined with the cohort data.
Finally, the cohort data and linked secondary data are
released back to the researcher, with the participant
addresses removed. This process was possible because
participants explicitly consented to take part in the UK
Biobank study, which includes health data linkage. It is
important to note that we have not explored the
fi
ner details
of how such data sources might be linked and harmonised
for research purposes.
Where data linkage is often feasible and legal, whether it
is ethical to perform such linkages is a wider consideration
[16,
17]. For example; users of
fi
tness tracking devices may
have consented within their terms and conditions to sharing
of their data with trusted partners. However, could they
reasonably have expected that these partners would
com-bine these physical activity records with food purchase
transactions and their health outcomes? In many cases the
bene
fi
t to society from such research may be argued to
outweigh the risk of identi
fi
cation of the individual, but
does that mean we should link data in this way, and would
it, or should it, be permitted by research ethics committees
responsible for granting ethical approval for research? The
role of the ethics committee is essential to protecting the
interests of the public and the research community. Should
ethical standards not be maintained there is a risk of public
outcry, which could prohibit future research of this type.
Worse still would be for individual-level information to leak
outside the research communities, for example to insurance
companies, who might penalise their customers.
In relation to data access, the ownership of data is
another key issue. Supermarkets may be keen to share data
with academic researchers if there is hope of serious
insights into store planning or optimisation of marketing
spend. Whether they are also keen to share data to
under-stand negative health consequences from retail sales is a
somewhat different proposition. The ability to document the
ownership of data sources is not always straightforward. For
example; Food Standards Agency (FSA) data may be
hos-ted and accessed via a local authority, but whether local
authorities or the FSA are the data owner is debatable. This
is likely the case for other data sources accessed via a third
party.
These issues around access, linkage and ethics are
echoed in the literature: most of the studies published to
date that have attempted to utilise
‘
found
’
data describe
challenges relating to these concerns [9]. It is encouraging
however, that solutions to these challenges have been
found, illustrated by the publication of such studies. Sharing
best practice between research teams and organisations,
relating to these challenges, presents opportunity to
pro-gress with a new type of research more pragmatically and
ef
fi
ciently.
In this paper we have considered how the Foresight
obesity system map might be more fully populated through
extraction of big data sources. However, the transformative
effects of big data are potentially much more wide-ranging.
A primary example of this is in the
fi
eld of Randomised
Controlled Trials (RCTs), where there is a growing feeling
that a combination of new datasets at scale, perhaps ranging
from patient data, hospital outcomes and prescriptions to
lifestyle, activity, eating and food purchases might be
combined to create a massive population base for future
trials. Such an approach could be cost ef
fi
cient in targeting
participants, it would allow substantial samples to be
identi
fi
ed for even the rarest conditions, and potentially
admit variations between focused sub-groups e.g., within a
speci
fi
c age range or ethnic category. Again, the ability of
trials to utilise such data is largely dependent upon the
availability and accessibility of individual level data.
Innovative approaches to research questions are required
in changing political landscapes and big data presents
valuable possibilities. While RCTs are heralded as the gold
standard in study design they are not applicable to all
research questions. Many research questions relating to
obesogenic factors (e.g., social and built environmental
variables) are better suited to observational rather than
experimental. This challenge is compounded in that big data
is generally inherently observational rather than
experi-mental. Thus we may need to look to alternative study
designs combined with alternative and innovative methods
of analysis. In particular, big data presents valuable
possi-bilities for natural experiments to compare the experience of
similar groups under different environmental conditions or
subject to different interventions e.g., in different regions
[18
–
21]. Spatiotemporal patterns can be investigated at
scale for the
fi
rst time without the challenges associated
with longitudinal cohort study design and follow-up.
combining multiple data sources. The use of big data does
not preclude the need for validation of
fi
ndings, whether
that is through use data generated from a
‘
gold standard
’
or
using better understood traditional data sources. Multiple
big data sources, combined with traditional datasets offer
opportunities for cross-validation, which is especially
important when
fi
ndings result from hypothesis generation.
Given the many strengths of big data, we may need to
accept these limitations as a necessary compromise.
How-ever, newly developing machine learning methods, and new
strategies for causal inference with observational data may
be part of a solution to these challenges [22].
In conclusion, big data offer great potential across many
domains of obesity research and need to be leveraged for
societal bene
fi
t and health promotion. While obesity
research and policy have evolved towards a
‘
whole
sys-tems
’
paradigm since the publication of the Foresight
Report, they still tend to focus only on small parts of the
obesity system in isolation, and fail to consider the
inter-relationships between different factors. Use of big data
could facilitate understanding of the wider determinants of
obesity and their interrelations across multiple levels. In
turn, this would permit evidence-informed allocation of
funds and ultimately optimise return on investment during a
period of
fi
nancial constraint. This is particularly timely in
light of the Government
’
s childhood obesity policy
pub-lished this year, which, in spite of identifying 14 speci
fi
c
levers for change, found a best-case summary of existing
evidence-base to be
‘
equivocal
’
.
Acknowledgements The ESRC Strategic Network for Obesity was funded via Economic and Social Research Council grant number ES/ N00941X/1. The authors would like to thank all of the network investigators (www.cdrc.ac.uk/research/obesity/investigators/) and members (www.cdrc.ac.uk/research/obesity/network-members/) for their participation in network meetings and discussion which con-tributed to the development of this paper.
Compliance with ethical standards
Conflict of interest Dr MM is inventor and shareholder at Dietary Assessment Ltd. The remaining authors declares that they have no conflict of interest.
Open Access This article is licensed under a Creative Commons Attribution 4.0 International License, which permits use, sharing, adaptation, distribution and reproduction in any medium or format, as long as you give appropriate credit to the original author(s) and the source, provide a link to the Creative Commons license, and indicate if changes were made. The images or other third party material in this article are included in the article’s Creative Commons license, unless indicated otherwise in a credit line to the material. If material is not included in the article’s Creative Commons license and your intended use is not permitted by statutory regulation or exceeds the permitted use, you will need to obtain permission directly from the copyright holder. To view a copy of this license, visithttp://creativecommons. org/licenses/by/4.0/.
References
1. Foresight. Tackling obesities: future choices–Project report. Government Office for Science, 2007.
2. Egger G, Swinburn B. An“ecological”approach to the obesity pandemic. BMJ. 1997; 315:477–80.
3. Lobstein T, Baur L, Uauy R, TaskForce IIO. Obesity in children and young people: a crisis in public health. Obes Rev. 2004;5 (Suppl 1):4–104.
4. Smith D, Cummins S, Clark C, Stansfeld S. Does the local food environment around schools affect diet? Longitudinal associations in adolescents attending secondary schools in East London. BMC Public Health. 2013;13:70.
5. Thornton LE, Crawford DA, Ball K. Neighbourhood-socioeconomic variation in women’s diet: the role of nutrition environments. Eur J Clin Nutr. 2010;64:1423–32.
6. Razak F, Anand S, Vuksan V, Davis B, Jacobs R, Teo KK, et al. Ethnic differences in the relationships between obesity and glucose-metabolic abnormalities: a cross-sectional population-based study. Int J Obes. 2005;29:656–67.
7. Rutter H, Savona N, Glonti K, Bibby J, Cummins S, Finegood DT, et al. The need for a complex systems model of evidence for public health. Lancet. 2017;390:2602-2604.
8. Atkinson J-A, Page A, Wells R, Milat A, Wilson A. A modelling tool for policy analysis to support the design of efficient and effective policy responses for complex public health problems. Implement Sci. 2015;10:26.
9. Timmins KA, Green MA, Radley D, Morris MA, Pearce J. How has big data contributed to obesity research? A review of the literature. Int J Obes 2018.https://doi.org/10.1038/s41366-018-0153-7. 10. Hewitt J, Walters M, Padmanabhan S, Dawson J. Cohort profile of
the UK Biobank: diagnosis and characteristics of cerebrovascular disease. BMJ Open. 2016;6:e009161.
11. UK Biobank. Biobank: improving the health of future generations. 2017. http://www.ukbiobank.ac.uk/2012/03/uk-biobank-reaches-recruitment-goal/
12. Cade JE, Burley VJ, Alwan NA, Hutchinson J, Hancock N, Morris MA, et al. Cohort Profile: The UK Women’s Cohort Study (UKWCS). Int J Epidemiol. 2017;46:e11.
13. Wadsworth M, Kuh D, Richards M, Hardy R. Cohort Profile: The 1946 National Birth Cohort (MRC National Survey of Health and Development). Int J Epidemiol. 2006;35:49–54.
14. Boyd A, Golding J, Macleod J, Lawlor DA, Fraser A, Henderson J, et al. Cohort Profile: the‘children of the 90s’--the index off-spring of the Avon Longitudinal Study of Parents and Children. Int J Epidemiol. 2013;42:111–27.
15. Connelly R, Playfor C, Gayle V, Dibben C. The role of admin-istrative data in the big data revolution in social science research. Soc Sci Res. 2015;59:1–12.
16. Vayena E, Salathe M, Madoff LC, Brownstein JS. Ethical chal-lenges of big data in public health. PLoS Comput Biol. 2015;11: e1003904.
17. Lazler D, Radford J. Data ex Machina: introduction to big data. Annual Rev. 2017; 43:19–39.
18. Colchero MA, Popkin BM, Rivera JA, Ng SW. Beverage pur-chases from stores in Mexico under the excise tax on sugar sweetened beverages: observational study. BMJ. 2016;352:h6704. 19. Silver LD, Ng SW, Ryan-Ibarra S, Taillie LS, Induni M, Miles DR, et al. Changes in prices, sales, consumer spending, and beverage consumption one year after a tax on sugar-sweetened beverages in Berkeley, California, US: A before-and-after study. PLoS Med. 2017;14:e1002283.
21. Ahern AL, Olson AD, Aston LM, Jebb SA. Weight Watchers on prescription: an observational study of weight change among adults referred to Weight Watchers by the NHS. BMC Public Health. 2011;11:434.
22. Krieger N, Davey Smith G. The tale wagged by the DAG: broadening the scope of causal inference and explanation for epidemiology. Int J Epidemiol. 2016;45:1787–808.
23. Cetateanu A, Jones A. Understanding the relationship between food environments, deprivation and childhood overweight and obesity: evidence from a cross sectional England-wide study. Health Place. 2014;27:68–76.
24. Harrison F, Burgoine T, Corder K, van Sluijs EM, Jones A. How well do modelled routes to school record the environments children are exposed to? A cross-sectional comparison of GIS-modelled and GPS-measured routes to school. Int J Health Geogr. 2014;13:5. 25. Burgoine T, Forouhi NG, Griffin SJ, Brage S, Wareham NJ,
Monsivais P. Does neighborhood fast-food outlet exposure amplify inequalities in diet and obesity? A cross-sectional study. Am J Clin Nutr. 2016;103:1540–7.
26. Griffiths C, Frearson A, Taylor A, Radley D, Cooke C. A cross sectional study investigating the association between exposure to food outlets and childhood obesity in Leeds, UK. Int J Behav Nutr Phys Act. 2014;11:138.
27. Newing A, Clarke G, Clarke M. Exploring small area demand for grocery retailers in tourist areas. Tourism Econ. 2014; 20. 28. Diaz KM, Krupka DJ, Chang MJ, Peacock J, Ma Y, Goldsmith J,
et al. Fitbit(R): An accurate and reliable device for wireless physical activity tracking. Int J Cardiol. 2015;185:138–40.
29. Carter MC, Albar SA, Morris MA, Mulla UZ, Hancock N, Evans CE, et al. Development of a UK Online 24-h Dietary Assessment Tool: myfood24. Nutrients. 2015;7:4016–32.
30. Albar SA, Alwan NA, Evans CE, Greenwood DC, Cade JE. Agreement between an online dietary assessment tool (myfood24) and an interviewer-administered 24-h dietary recall in British adolescents aged 11-18 years. Br J Nutr. 2016;115: 1678–86.
31. Morris MA. Spatial analysis of dietary cost patterns and impli-cations for health. PhD, University of Leeds, 2013.
32. Kandt J. The social and spatial context of urban health inequal-ities: towards an interpretive geodemographic framework. PhD, University College London, 2015.
33. Jarman B. Identification of underprivileged areas. BMJ. 1983;286: 1705–9.
34. Ashe S, Nazroo J. Equality, diversity and racism in the workplace: a qualitative analysis of the 2015. Race at Work Survey, 2016.
35. Thomas M, Stillwell J, Gould M. Exploring and validating a commercial lifestyle survey for its use in the analysis of population migration. Appl Spat Anal Policy. 2014;7: 71–95.
36. Thompson C. Retail spending and store location during a reces-sion: an analysis of changing consumer behaviour and interaction patterns. PhD, University of Leeds, 2013.