IJPSR (2018), Volume 9, Issue 6 (Research Article)
Received on 08 September, 2017; received in revised form, 16 February, 2018; accepted, 04 March, 2018; published 01 June, 2018
QUALITY BY DESIGN (QbD) BASED DEVELOPMENT OF A STABILITY INDICATING RP-HPLC METHOD FOR ESTIMATION OF COBICISTAT IN BULK
Padala Alekya, Kurla Venkata Varalakshmi and A. K. M. Pawar *
Department of Pharmaceutical Analysis and Quality Assurance, Andhra University College of Pharmaceutical Sciences, Visakhapatnam - 530003, Andhra Pradesh, India.
ABSTRACT: By considering the current regulatory requirement for an analytical method development, a reversed phase high performance liquid chromatographic method for routine analysis of cobicistat has been developed using analytical Quality by design approach. The optimized method was achieved using unisol C-18 (3 μm, 4.6 ×150 mm) column with mobile phase consisting of mixture of water and methanol (70: 30 v/v) with a flow rate of 1ml/min at 240 nm. The optimized method was then validated according to the ICH guidelines. The developed method was found linear over the concentration range of 10-80 μg/ml and the detection and quantitation limit was found to be 0.39μg/ml and 1.2μg/ml. There are no interfering peaks under performed degradation conditions. Therefore, a sensitive, robust, accurate and stability indicating method was developed with high degree of practical utility.
INTRODUCTION: Cobicistat (Fig. 1), trade name Tybost (formerly GS-9350), is a licensed drug for use in the treatment of infection with human immunodeficiency virus (HIV). Although it does not have any anti-HIV activity, cobicistat acts as a pharmacokinetic enhancer by inhibiting cytochrome P450 3A isoforms (CYP3A) and therefore increases the systemic exposure of co administered agents that are metabolized by CYP3A enzymes. Increasing systemic exposure of anti-retrovirals (ARVs) without increasing dosage allows for better treatment outcomes and a decreased side effect profile 9, 12.
QUICK RESPONSE CODE
DOI:
10.13040/IJPSR.0975-8232.9(6).2589-94
Article can be accessed online on:
www.ijpsr.com
[image:1.612.47.299.635.719.2]DOI link: http://dx.doi.org/10.13040/IJPSR.0975-8232.9(6).2589-94
FIG. 1: STRUCTURE OF COBICISTAT
Quality by Design:
Definition (ICH Q 8(R1)): A systematic approach to development that begins with predefined objectives and emphasizes product and process understanding and process control, based on sound science and quality risk management.
Definition (FDA PAT Guidelines, Sept. 2004): A system for designing, analyzing and controlling manufacturing through timely measurements (i.e. during processing) of critical quality and performance attributes of new and in-process materials and processes, with the goal of ensuring Keywords:
Cobicistat, RP-HPLC, QbD Correspondence to Author: A. K. M. Pawar
Assistant Professor,
Pharmaceutical Analysis and Quality Assurance Andhra University College of Pharmaceutical Sciences, Visakhapatnam - 530003, Andhra Pradesh, India.
final product safety. The concept of “Quality by Design” (QbD) was defined as an approach which covers a better scientific understanding of critical process and product qualities, designing controls and tests based on the scientific limits of understanding during the development phase and using the knowledge obtained during the life-cycle of the product to work on a constant improvement environment. QbD describes a pharmaceutical development approach referring to formulation design and development and manufacturing processes to maintain the prescribed product quality. Guidelines and mathematical models are used to ensure the establishment and use of the knowledge on the subject in an independent and integrated way 1, 2, 3.
MATERIALS AND METHODS:
Materials Required: Cobicistat drug sample was purchased from the authorized drug dealers from Hyderabad, HPLC grade Distilled water, HPLC grade methanol, hydrochloric acid, sodium hydroxide and hydrogen peroxide (Desai Chemicals).
Instrumentation: Agilent technologies HPLC 1200 infinity series, U. V. Spectrophotometer T60 lab India, Mettler Toledo ME204 Weighing balance, Sonicator PCI analysis model.
Preparation of Standard Stock Solutions: Accurately weighed 100 mg of cobicistat and transferred to 100 ml A-Grade volumetric flask and 3/4th of diluents was added to this flask and sonicated for 10 minutes. Flask was made up with diluents and labelled as Standard stock solution. (1000 µg/ml cobicistat)
Preparation of Standard Working Solutions (100% solution): 10 ml from each stock solution was pipette out and taken into a 100 ml volumetric flask and made up with diluent. (100 µg/ml Cobicistat)
Preparation of Dilutions: Dilute the working standard solution (100 µg/ml) by pipetting 1, 2, 4, 6 and 8 ml of 100 µg/ml solution into 10 ml volumetric flasks and make up the volume with diluents. This gives dilutions of 10, 20, 40, 60 and 80 µg/m solutions respectively.
Detection of λmax: The sample solution has been prepared and scanned in the UV region of
[image:2.612.318.559.90.211.2]200-400nm. And the spectrum showed the maximum absorbance at 240 nm. (Fig. 2)
FIG. 2: UV SPECTRUM OF COBICISTAT
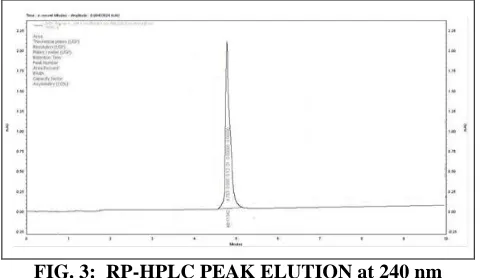
RP-HPLC Optimised Chromatographic Condition
using AQbD: The mobile phase used for this study was mixture of water and methanol at 70:30 ratio. Stationary phase was unisol C18 column (3um, 1100, 4.6X150) dimensions at ambient temperature. The Mobile phase was pumped from the solvent reservoir to the column at a flow rate of 1 ml/min for 10 min. The elution was monitored at 240nm.The retention time of the drug was found to be 4.753 min (Fig. 3). This was considered as optimised condition by performing 22 factorial design considering the mobile phase and flow rate factors (Table 1).
TABLE 1: 22 FACTORIAL DESIGN FOR METHOD DEVELOPMENT
Factor Level of Factor Interaction (AB)
Retention Time (Y) A (X1) B (X2)
1 40 0.6 24 6.04
A 70 0.6 42 5.81
B 40 1 40 5.28
Ab 70 1 70 4.75
[image:2.612.320.560.554.693.2]Where: A = Mobile phase concentration of water, B = Flow rate of the HPLC column, AB = Interaction of mobile phase and flow rate, Y = Retention time
FIG. 3: RP-HPLC PEAK ELUTION at 240 nm
Method Validation: 7, 10, 11
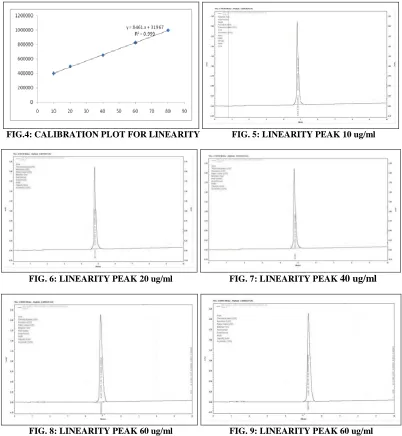
solution and recording their responses at the optimized set of chromatographic conditions 4 (Table 2). The calibration plots were constructed between concentrations versus peak areas and the linearity
was found in the range from10 µg/ml to 80 µg/ml (Fig. 4). The regression equation and correlation coefficient was calculated. The chromatograms were shown in Fig. 5 - 9.
FIG.4: CALIBRATION PLOT FOR LINEARITY FIG. 5: LINEARITY PEAK 10 ug/ml
FIG. 6: LINEARITY PEAK 20 ug/ml FIG. 7: LINEARITY PEAK 40 ug/ml
[image:3.612.105.507.118.554.2]FIG. 8: LINEARITY PEAK 60 ug/ml FIG. 9: LINEARITY PEAK 60 ug/ml
TABLE 2: LINEARITY
Cobicistat
S. no Concentration (μg/ml) Peak area
1 10 399382
2 20 498569
3 40 652101
4 60 827616
5 80 997616
Precision:
Intraday Precision: In this study, six injections of standard solution of 20 ug/ml were injected into chromatographic system during different time interval within a day.
Percentage RSD for retention time was found to be 1.75.
Percentage RSD for area was found to be 1.25.
Limits to be considered: NMT 2.0 (NMT-Not More Than)
Interday Precision: In this study, six injections of standard solution of 20ug/ml were injected into chromatographic system during different days.
Percentage RSD for peak area was found to be 1.76
Limits to be Considered: NMT 2.0
Limit of Detection and Limit of Quantification: The limit of detection (LOD) and limit of quantification (LOQ) were separately determined based on standard deviation of the y-intercept and the slope of the calibration curve by using the equations (1) and (2), respectively (Table 3).
LOD = 3.3 δ/S ………. (1) LOQ =10 δ/S ……….. (2)
Where,
δ= the standard deviation of the response, S = the slope of the calibration curve
The slope S may be estimated from the calibration curve of the analyte.
TABLE 3: LOD AND LOQ
Method Peak Area
LOD 0.39 ppm
LOQ 1.2 ppm
Accuracy (Recovery Study): The accuracy of the method was determined by calculating the recoveries of cobicistat by the standard addition method 5. Known amounts of standard solutions of cobicistat were added at 20% concentration to pre
quantified sample solutions of cobicistat (50, 100, 150 µg/ml) (Table 4). The amount of cobicistat recovered was estimated by using the following formulas (Limit to be considered 98-102%).
Recovery = amount found ×100 amount added Amount Found (mcg / ml) =
Mean test area ×Std. con mean standard area
TABLE 4: ACCURACY %
Level
Standard amount
Spiked amount
Amount found
% Recovery
Mean % Recovery
50% 20 10 29.71 99.03 99.39
20 10 29.86 99.53
20 10 29.89 99.63
100% 20 20 39.79 99.47 99.42
20 20 39.89 99.72
20 20 39.63 99.07
150% 20 30 49.71 99.42 99.44
20 30 49.69 99.38
20 30 49.76 99.52
Where, % = Percentage, Std. = Standard, Conc. = Concentration
Specificity: Standard solution of 20µg/ml was injected into the system and chromatogram was recorded. Diluent (70:30 water: methanol) was used as blank and chromatogram was recorded after injection into the system (Fig. 10). Similarly typical representative chromatogram of standard was also shown in Fig. 11.
FIG. 10: CHROMATOGRAM OF BLANK FIG. 11: STANDARD CHROMATOGRAM
Robustness: Robustness is the measure of a method which remain unaffected by small, deliberate changes in method parameters like flow rate and mobile phase ratio on assay of the analyte of interest 6. The percentage RSD for flow rate and mobile phase ratio changing were calculated (Table 5).
Ruggedness: The Ruggedness of the method was studied by analyzing the sample and standard
preparations by two analysts. The % RSD assay values between two analysts were calculated (Table 6).
TABLE 5: ROBUSTNESS
S. no. Condition % RSD of
TABLE 6: RUGGEDNESS
S. no. Analyst Retention time Area
1 Analyst I 4.947 428627
2 Analyst II 4.893 436933
3 Mean 4.92 432780
4 SD 0.038 5873.228
5 %RSD 0.77 1.35
Degradation Studies:
Oxidation: To 2 ml of stock solution of cobicistat, 1 ml of 20% hydrogen peroxide (H2O2) was added separately. The solutions were kept for 30 min at 60 °C. For HPLC study, the resultant solution was diluted to obtain 20 µg/ml solutions and 10µl solutions was injected into the system and the chromatograms were recorded to assess the stability of sample. The percentage of drugs degraded was calculated (Table 7). Limit to be considered is NMT 20%.
Acid Degradation Studies: To 2 ml of stock solution cobicistat, 1ml of 0.1N Hydrochloric acid (HCl) was added and refluxed for 30mins at 60°C. The resultant solution was diluted to obtain 20µg/ml, 10µl solution was injected into the system and the chromatograms were recorded to assess the stability of sample. The percentage of drugs degraded was calculated (Table 7) Limit to be considered is NMT 20%.
Alkali Degradation Studies: To 2 ml of stock solution cobicistat, 1 ml of 2N sodium hydroxide (NaOH) was added and refluxed for 30mins at 60 oC. The resultant solution was diluted to obtain 20 µg/ml solutions and 10µl solutions was injected into the system and the chromatograms were recorded to assess the stability of sample. The percentage of drugs degraded was calculated. (Table 7) Limit to be considered is NMT 20%.
Thermal Degradation Studies: The standard drug solution was placed in oven at 80 °C for 1h to study dry heat degradation. For HPLC study, the resultant solution was diluted to 20 µg/ml solutionand10µl solution was injected into the system and the chromatograms were recorded to assess the stability of the sample. The percentage of drugs degraded was calculated (Table 7). Limit to be considered is NMT 20%.
Photo Stability studies: The photochemical stability of the drug was also studied by exposing 100 mg of drug sample in sunlight for 12 hours
then the solution was diluted to obtain 20µg/ml solution and 10µl were injected into the system and the chromatograms were recorded to assess the stability of sample. The percentage of drugs degraded was calculated (Table 7). Limit to be considered is NMT 20%.
TABLE 7: DEGRADATION STUDIES
S. no. Parameters % Degraded
24 h 48 h 72 h 1 Acid Degradation 3.14% 5.86% 10.72% 2 Alkali Degradation 1.4% 5.7% 8.32% 3 Oxidative Degradation 3.7% 6.05% 8.37%
4 Thermal Degradation 6%
5 Photo stability Degradation 1.23%
[image:5.612.314.571.266.539.2]Summary Table for RP-HPLC Method Validation:
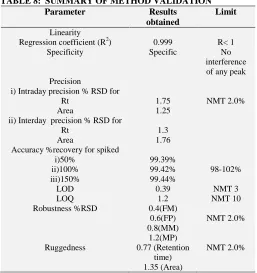
TABLE 8: SUMMARY OF METHOD VALIDATION
Parameter Results
obtained
Limit
Linearity
Regression coefficient (R2) 0.999 R< 1
Specificity Specific No
interference of any peak Precision
i) Intraday precision % RSD for Rt
Area
ii) Interday precision % RSD for Rt Area 1.75 1.25 1.3 1.76 NMT 2.0%
1. Accuracy %recovery for spiked i)50% ii)100% iii)150% 99.39% 99.42% 99.44% 98-102%
LOD 0.39 NMT 3
LOQ 1.2 NMT 10
Robustness %RSD 0.4(FM)
NMT 2.0% 0.6(FP)
0.8(MM) 1.2(MP) Ruggedness 0.77 (Retention
time) 1.35 (Area)
NMT 2.0%
Where, RSD = Relative Standard Deviation, Rt= Retention time, F.M = Flow rate Minus, F.P = Flow rate Plus, M.M= Mobile phase Minus, M.P = Mobile phase Plus
ACKNOWLEDGEMENT: We are thankful to A. U. College of Pharmaceutical Sciences, Visakhapatnam for providing necessary facilities to carry out the research work.
CONFLICT OF INTEREST: Nil
REFERENCES:
1. www.fda.gov./cder/ops/PAT.htm
2. http://www.gmpcompliance.org/daten/training/ECA_QbD _in_Analysis_2013 accessed Oct 23, 2016.
3. http:// www.ISPE.org/2013 Bad Conference accessed Oct 23, 2016.
4. Watson DG, et al.: Pharmaceutical Analysis, A text book for Pharmacy students and Pharmaceutical Chemists. Harcourt Publishers Limited, Edition 2nd, 221-232. 5. Connors K, et al.: A Textbook of Pharmaceutical Analysis.
Wiley Intersciences Inc, Delhi, Edition 3rd, 1994; 373-421.
6. Watson DG, et al.: Pharmaceutical Analysis: A text book for pharmacy students and Pharmaceutical Chemists. Harcourt Publishers Limited, Edition 2nd, 267-311. 7. Nasal A, Siluk D and Kaliszan: Chromatographic
Retention Parameters in Medicinal Chemistry and Pharmacology. Pubmed 2003; 10(5): 381-426.
8. Kaushal C and Srivatsava B: A Process of Method Development: A Chromatographic Approach. J Chem Pharm Res. 2010; 2(2): 519-545.
9. Indian Pharmacopoeia, Indian Pharmacopoeial
Commission, Controller of Publication, Government of India, Ministry of health and Family Welfare, Ghaziabad, India 2010; 2: 1657-1658.
10. Green JM, et al.: A Practicle guide to analytical method validation, Anal Chem 1996; 305A-309A.
11. ICH, Validation of analytical procedures: Text and Methodology. International Conference on Harmonization, IFPMA, Geneva, 1996.
12. http://www.drugbank.ca/drugs/DB09065
All © 2013 are reserved by International Journal of Pharmaceutical Sciences and Research. This Journal licensed under a Creative Commons Attribution-NonCommercial-ShareAlike 3.0 Unported License.
This article can be downloaded to ANDROID OS based mobile. Scan QR Code using Code/Bar Scanner from your mobile. (Scanners are available on Google Playstore)
How to cite this article: