ISSN: 1992-8645 www.jatit.org E-ISSN: 1817-3195
A VEHICLE DISTANCE MEASUREMENT BASED ON
BINOCULAR STEREO VISION
1 ZHIBIN ZHANG, 2SHUANGSHUANG LIU, 3GANG XU, 4JUANGJUANG WANG
1College of Computer science of Inner Mongolia University 2
College of Computer science of Inner Mongolia University
3College of Computer science of Inner Mongolia University
4
College of Computer science of Inner Mongolia University
E-mail: [email protected], [email protected], 3csxugang@imu,edu.cn, 4510597774@qq,com
ABSTRACT
Distance detection is a crucial issue for driver assistance systems and it has to be performed with high reliability to avoid any potential collision with the front vehicle. The vision-based distance detection is regarded promising for this purpose because they require little infrastructure on a highway. In this paper, a distance detection algorithm using stereo vision sensors is developed, in which the license plate feature extraction and its center coordinate obtainment are utilized to match the corresponding pairs of the license plate. And then the 3-D reconstruction equation groups are used to obtain the position parameters of the front vehicle. The proposed distance detection algorithm is tested on a set of images taken in different distances and its performance is verified experimentally.
Keywords: Stereo vision, License plate, Feature detection, Epipoplar constraint, Distance detection.
1. INTRODUCTION
The distance detection algorithm in vehicles can inform the driver of the real-time distance during the driving and, if necessary, they can override the driver’s braking to avoid collision with the front vehicle. It is regarded promising for the driver assistance systems as well as for autonomous vehicles. Various sensors such as Radar, machine vision, infrared, and ultrasonic have been developed for automotive applications. For example, millimeter-wave radar is very accurate when it is foggy or raining, but is still too expensive and is not as good in detecting targets in multiple directions [1]. Lidar or laser radar is also very accurate with much lower cost, but is sensitive to environmental condition such as reflected light. The rainfall, puddles on the road surface, water drops can degrade the detection performance significantly [2]. Far infrared (FIR) can provide thermal night vision but show poor performance in near target discriminations [1]. However, CCD sensor can provide abundant vision information of the front vehicle and be used to detect distance between vehicles to vehicles with low cost [3 4]. The distance detection using stereo vision technology was also proposed [5, 6], in which the binocular stereo vision system was composed of the front
vehicle region extraction (Example for license plate from image) and the front vehicle verification from the extracted region [1]. The vision-based vehicle detection can extract the front vehicle region using the image color information, edges features, etc. Several vehicle detection methods were suggested using the edge detector approach [7, 8]. These methods used the rectangle feature to detect the rear of a vehicle. And the Hough transform was often applied to obtain better edge matching [9].
© 2005 - 2012 JATIT & LLS. All rights reserved.
ISSN: 1992-8645 www.jatit.org E-ISSN: 1817-3195
2. VEHICLE DISTANCE MEASUREMENT
2.1 Overall Structure
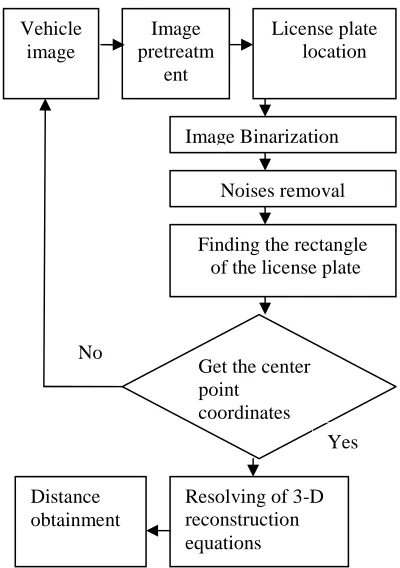
The distance detection of vehicles has to be performed with high reliability to avoid any potential collision in the forward direction. The schematic diagram of the proposed distance detection algorithm is illustrated in Fig. 1. Using stereo vision sensors, the stereo images are obtained and the region of interest (ROI) of the license plate is estimated using color features. The coordinate system of the vision sensors is shown in Fig. 2. Firstly, the ROIs of the license plate of a vehicle are separated from the stereo images taken by using color feature because the color of license plate is always blue for most vehicles, which is very important to improve the distance detection. Secondly, the rectangle of the license plate is created from the ROIs through detecting its four edges (top, bottom, left and right). Thirdly, the center coordinate of the rectangle is calculated to conduct the stereo matching, and then the 3-D reconstruction equations are constructed to obtain the position parameters of the front vehicle.
Fig. 1 Schematic Diagram Of The Distance Measurement
2.2 Image Pretreatment
In a vehicle distance measurement process, the image pretreatment is very important. In order to accurately locate the license plate, this paper firstly
has used light compensation technology to cope with the situations due to unbalanced lighting. That is, 20% of the largest gray value pixels are extracted by queuing the gray scales obtained using the brightness = 0.299* R+0.587* G+0.114* B, and then Eq. 1 is used to linearly amplify the brightness of these pixels in order to obtain the compensation coefficient co, and the three components of the image are multiplied by the co, respectively, shown as in Eq. 2, which can provide contrast enhancement of brightness for the natural lighting images [12]. The light compensation result as shown in Fig. 4. And in Eq. 1, k is decided by 20% of the largest gray value pixels.
2 5 5 * ( )
2 5 5
( ) * 2 5 5
k
H i s t o g r a m i i
c o
k
H i s t o g r a m i i i
∑ = =
∑
=
(1)
* , 2 5 5 , 2 5 5 * , 2 5 5 , 2 5 5
* , 2 5 5, 2 5 5
r r c o w h e n r r
g g c o w h e n g g
b b c o w h e n b b
= > =
= > =
= > =
[image:2.612.317.524.182.706.2]
(2)
Fig. 2 Vision Co-Ordinate System
[image:2.612.94.294.372.656.2]Fig. 3 Original Image
Fig. 4 Image After Light Compensation
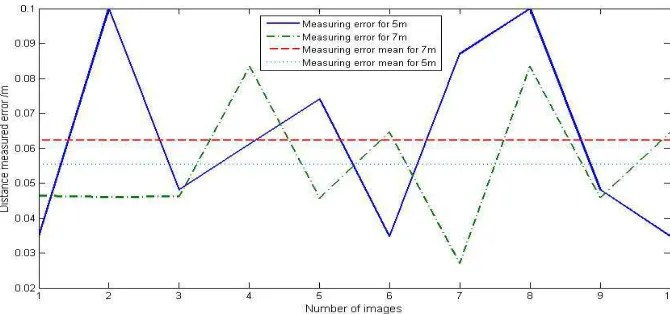
2.3 License Plate Location And Its Center Coordinate Obtainment
In order to solve the problem of vehicle license plate location, this paper uses the color feature of the license plate because most of the license plates Vehicle
image
Image pretreatm
ent
License plate location
Image Binarization
Noises removal
Finding the rectangle of the license plate
Get the center point
coordinates
Resolving of 3-D reconstruction equations Distance
obtainment No
ISSN: 1992-8645 www.jatit.org E-ISSN: 1817-3195
are blue in contrast with the white characters on it. After the region of the license plate is binary, the characters show the morphological features such as connectivity (shown as in Fig. 5). Therefore, the license plate location can be realized by using the connectivity of the characters. And the horizontal scanning process is implemented to find the up-down borders of the license plate, and the vertical scanning process to find its left-right borders.
The license plate verification in practical applications is difficult by detecting the connectivity of the characters because of the various interference factors such as the paste ad slogans on body etc. Therefore, the color similarity calculation is performed in HSI color space, and closing operation is used to remove the isolated points and enhance the connectivity of each character. The specific algorithm as follows:
1) In HSI color space, the color feature of the license plate can be accentuated by extracting blue feature in natural lighting. And the foreground is set to be white, the characters are black.
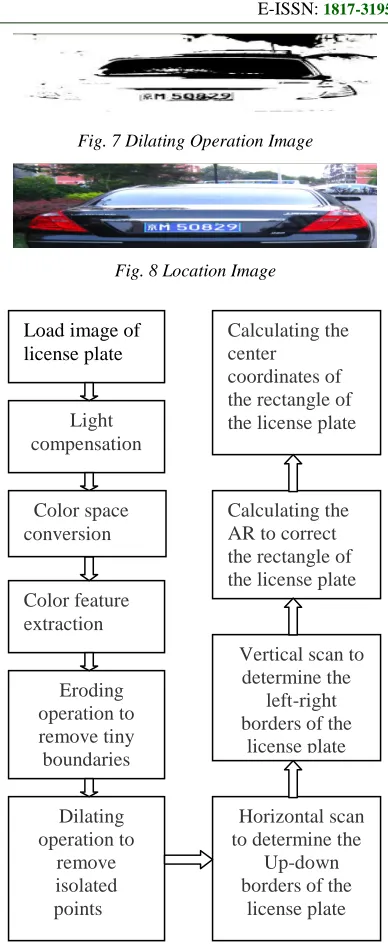
2) Eroding operation is used to remove some tiny boundaries, shown as in Fig. 6, and then dilating operation is used to remove the isolated points in order to conveniently detect the connectivity of the characters, shown as in Fig. 7.
3) The license plate region gray values are often continuous jump, therefore, using horizontal scan to determine the up-down borders of the license plate, and using vertical scan to locate left- right borders of the license plate, shown as in Fig. 8.
4) Calculating the aspect ratio (AR) of the license plates, and then using the aspect ratio to correct the rectangle of the license plate according to the Priori knowledge.
[image:3.612.325.519.77.549.2]5) Calculating the center coordinates according to the rectangle of the license plate. And the flow chart of the license plate location is shown as in Fig. 9.
Fig. 5 Color Extraction Of The License Plate
Fig. 6 Eroding Operation Image
Fig. 7 Dilating Operation Image
Fig. 8 Location Image
Fig. 9 Flow Chart Of The License Plate Location
2.4 Distance Obtainment
Binocular stereo vision can acquire the three-dimensional geometric information of the front vehicle by using two cameras from different views. And using the differences of the same vehicle in different image plane, the three-dimensional spatial coordinates of the measured point on it can be calculated by using the parameters of the camera calibration, and then the distance between the cameras and the front vehicle is obtained by resolving the 3-D reconstruction equations of binocular stereo vision system, depicted as Eq. 3
Load image of license plate
Light compensation
Color feature extraction
Eroding operation to remove tiny boundaries
Dilating operation to
remove isolated points
Horizontal scan to determine the
Up-down borders of the
license plate Vertical scan to
determine the left-right borders of the
license plate Calculating the AR to correct the rectangle of the license plate Calculating the center
coordinates of the rectangle of the license plate
[image:3.612.115.292.591.703.2]© 2005 - 2012 JATIT & LLS. All rights reserved.
ISSN: 1992-8645 www.jatit.org E-ISSN: 1817-3195
[13], and the vision coordinate system shown as in Fig.2.
(1) (1)
0 (1) (1)
(1) (1) (1)
0 (1) (2) (2) 0 0 0 1
0 0 1
1
1 1 1
0
0
1
1
w w w
r u
w w w
r
cr r r RT v
w w w
w
l u
w l l
cl l RT
w
X X X
X a u
Y R T Y Y
Z Y AM a v M
Z O Z Z
X
X a u
Y
Z Y AM a
Z = = = = = (2) (2)
(1) (1) (2)
0 (2)
1
0 0 1
1 1 w w w w v w w X X Y Y R T v M Z Z O = (3)
Zr and Zl represent respectively Z-axis
coordinates of P in the two camera coordinate system. (Xr,Yr,1) and (Xl,Yl,1) represent respectively
the homogeneous image coordinates of P in right and left images, shown as in Fig. 2. Ar and Al are
intrinsic parameters matrix of the two camera, and MrRT and MlRT are their rotation and translation
matrix, respectively. (Xw, Yw, Zw, 1) is homogeneous coordinates of P in the world coordinate system.
Assume that the rotation and translation matrix MrRT and M
l
RT have been given through the extrinsic
calibration of the two cameras, and the corresponding M(1), M(2) can be obtained, shown as in Eq. 4.
( 1 ) ( 1 ) ( 1 ) ( 1 )
1 1 1 2 1 3 1 4
( 1 ) ( 1 ) ( 1 ) ( 1 )
( 1 )
2 1 2 2 2 3 2 4
( 1 ) ( 1 ) ( 1 ) ( 1 )
3 1 3 2 3 3 3 4
( 2 ) ( 2 ) ( 2 ) ( 2 )
1 1 1 2 1 3 1 4
( 2 ) ( 2 ) ( 2 ) ( 2 )
( 2 )
2 1 2 2 2 3 2 4
( 2 ) ( 2 ) ( 2 ) ( 2 )
3 1 3 2 3 3 3 4
m m m m
m m m m
M
m m m m
m m m m
m m m m
M
m m m m
= =
(4) M(1), M(2) in Eq. 4 are substituted for Eq. 3 to obtain Eq. 5, shown below.
(1) (1) (1) (1) (1) (1) (1) (1)
11 12 13 14 31 32 33 34
(1) (1) (1) (1) (1) (1) (1) (1)
21 22 23 24 31 32 33 34
(2) (2) (2) (2) (2)
11 12 13 14 31
r
w w w r w w r w r
w w w r w r w r w r
w w w l w
m X m Y m Z m
m X X m XY m X Z
m X
m X m Y m Z m
m X X m X Y m X Z
m Y
m X m Y m Z m
m X X
+
+
+ −
−
−
=
+
+
+ −
−
−
=
+
+
+
−
−
(2) (2) (2)32 33 34
(2) (2) (2) (2) (2) (2) (2) (2)
21 22 23 24 31 32 33 34
w w
l l l
w w w l w l w l w l
m XY m X Z
m X
m X m Y m Z m
m X X m XY m X Z
m Y
−
=
+
+
+
−
−
−
=
(5)The three-dimension coordinates (Xw, Yw, Zw) of Pw can be obtained by resolving Eq. 5. And therefore, the three-dimensional coordinates of the center of the license plate can also be obtained by using Eq. 5. And the distance between the vehicles can be obtained based on the three-dimensional coordinates obtained.
3. EXPERIMENTS
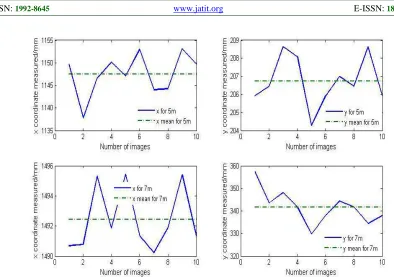
[image:4.612.141.476.552.709.2]Through internal and external parameters calibration of the binocular stereo vision system, the distance tests are implemented, in which 5 m and 7 m distances were tested respectively. The experimental data are shown as in Fig. 10 and Fig. 11.
ISSN: 1992-8645 www.jatit.org E-ISSN: 1817-3195
Fig. 11 X And Y Coordinates Measured
The camera was installed on a tripod set on the front of the vehicle, its height being 206mm, 340mm, respectively, parallel to the ground, the images taken continuously in natural lighting, an image per minute, respective 10 frames, and the actual distance from the camera to the vehicle was measured by hand with a tape. And therefore, there exist some measuring errors. From the measurement results can be seen that the 5m and 7m distance measurement errors are below 0.1m, their error means being 6.2cm, 5.5cm, respectively, shown as in Fig. 10. x coordinate errors measured vary from 0 to 15mm, and y coordinate errors measured vary from 0 to 4mm with the mean 206mm for 5m distance; For 7m distance, x coordinate errors measured vary from 0 to 5mm, and y coordinate errors measured vary from 0 to 27mm with the mean 341mm, shown as in Fig. 11. The time consumption is millisecond level. The experimental results show that this distance measurement can meet the actual needs of the road transport vehicle distance measurements and it is an effective measurement for the front vehicle for the driver assistant system.
4. CONCLUSIONS
Vision-based distance detection is developed for the driver assistant system. To detect the distance between the vehicles, the features are extracted using the color differences between the license plate
and the bodywork, and the feature-based stereo matching is carried out using the center coordinates of the license plate. In order to locate the license plate, the HSI color space is used to obtain color feature of the license plate, and the light compensation is implemented to equilibrate the brightness of the images in the experiments. The developed algorithm can measure the 3D positions of the front vehicle in the lane, the distance errors being centimeter level, with the millisecond level of the time consumption
ACKNOWLEDGEMENTS:
The work of this paper has been supported by National Natural Science Foundation of China (Nos. 3116025), Introduced Talents Start-up Fund of Inner Mongolia University (No.209053),College student innovation fund of China (No.111012615).
REFRENCES:
© 2005 - 2012 JATIT & LLS. All rights reserved.
ISSN: 1992-8645 www.jatit.org E-ISSN: 1817-3195
[2] S. Manabu, S. Tetsuo, M. Ikuhiro, E. Hiroshi, “Design method for an automotive laser radar system and future prospects for laser radar”, In: Proceedings of the intelligent vehicles’92 symposium, 1992, pp. 120-5.
[3] J. Phelawan, P. Kittisut, N. Pornsuwancharoen, “A new technique for distance measurement of between vehicles to vehicles by plate car using image processing”, Procedia Engineering, Vol. 32, pp. 348-353.
[4] Kuo Ying-Che, Pai Neng-Sheng, Li Yen-Feng, “Vision-based vehicle detection for a driver assistance system”,Computers and Mathematics with Applications, Vol. 61,No.8 2011, pp. 2096-2100.
[5] J.C. Burie, J.L. Bruyelle, J.G. Postaire, “Detecting and Localising Obstacles in Front of a Moving Vehicle Using Linear Stereo Vision”, Mathl. Comput. Modelling, Vol. 22, No. 4-7, 1995, pp. 235-246.
[6] Yi-peng Zhou, “RETRACTED:Fast and Robust Stereo Vision Algorithm for Obstacle Detection”, Journal of Bionic Engineering, Vol. 5, No. 3, 2008, pp. 247-252.
[7] J. Blossevill, C. Krafft, F. Lenoir, V. Motyka, S. Beucher, “TITAN: new traffic measurements by image processing”, IFAC/IFIP/IFORS Symposium, September, 19-21, 1989, pp. 35-42. [8] Y. Park, “Shape-resolving local thresholding for object detection”, Pattern Recognition Letter, Vol. 22, No.8, 2001, pp. 883-90.
[9] H. Moon, R. Chellapa, A. Rosenfeld, “Perform analysis of a simple vehicle detection algorithm”, Image Vision Computing, Vol.22, No.1, 2002, pp. 1-13.
[10] M. Xie, L. Trasoudaine, J. Alizon, J. Gallica, “Road obstacle detection and tracking by an active and intelligence sensing strategy”, Machine Vision and Applications, Vol.7, No.3, 1994, pp. 165-77.
[11] L. Xin, Y. XiaoCao, Yi LM, K. Robert, G. Grant, “A real-time vehicle detection and tracking system in outdoor traffic scenes”, In: Proceedings of the 17th International Conference on Pattern Recognition, vol. 2, 2004, pp. 761-764.
[12] Milan Sonka, Vaclav Hlavac, Roger boyle, “Image Processing, Analysis, and Machine Vision”, Second Edition., 2001, pp. 57-62. [13] A. Bernardino, J. Santos, “Visual behaviours