EXTRACTION AND PROCESSING OF SITUATION
SPATIOTEMPORAL TRAFFIC USING SVM ALGORITHM
WITH BIG DATA
1S HEMA LATHA,2K SUBRAHMANYAM
1MTech Student., Department of Computer Science and Engineering, KL University, Guntur, A.P, India. 2Prof., Department of Computer Science and Engineering, KL University, Guntur, A.P, India
E-mail: 1[email protected],2[email protected]
ABSTRACT
With the wide variety of motion sensors that traffic information can come from many research has been reserved for the development of traffic forecast, which in turn increases the shipping routes, traffic management, urban planning, etc. The most important challenge is to predict how traffic based on predictive models based on historical data traffic in real time, which may differ from historical data and change over time. In this system can learn new context of the current online traffic situation (or context) in real time, most effectively formed using a predictive historical data traffic model is intended to predict the future of the current situation. If traffic in real time, distributed environment enters the bloodstream space efficiently adapt to assess the effectiveness of each significant predictor different situations. We can show you the way, and short-term and long-term performance guarantees (STEP), our algorithm is designed in accordance with the algorithm works well in situations where there are no real signs (for ex. Traffic Ready) or later. We proposed an algorithm called “Extraction and Processing of situation Spatiotemporal traffic using SVM algorithm with Big data”By using the proposed framework, a context in which the most important is to predict the traffic by monitoring the movement of vehicles, which can further reduce the complexity of the request and inform the trade-policy. Our experience with real data in real-time circumstances indicates that the proposed approach is superior to existing solutions.
Keywords:Big data, Spatiotemporal, GPS, Traffic.
1. INTRODUCTION
Traffic generated great waste of time and energy to be lost. According to recent reports, the hippie, 2007, at approximately 440 cities experienced 4.2 billion hours of delay vehicles to 2.8 million liters of fuel and $ 87.2 billion in lost crops, which should be 0% GDP -7. [1] Federal Highway Administration in the United States show that the number of vehicle kilometers increased by 76 percent in the past 20 years, thousands of people filled the roads increased by only 1.5 percent, the smallest increase now widely recognized that it is impossible to build road traffic, mainly due to high growth in energy demand. Fortunately, the World Urban conditions, such as sensors that can come from recycling (such as CCTV cameras, GPS), and a lot of traffic in real-time and historical data on the location and time. [2] Some companies, such as Inrix sold, both now and in the research centers, the entry of two records in Los Angeles for three years. The biggest challenge is the prophetic predictions based on the motion model based on historical
2. LITERATURE SURVEY
Before the development of the corresponding tools and the design, it is necessary to determine and monitor the time factor, the necessary means, the power of the human being, the economy and the power of the company. Once these things completely satisfied and interrogated, then the next step is to determine the specifications of the software to the respective system, so that this type of project would require the operating system, and these are all of the necessary software required in order to proceed to the next step, such as the development of tools, and related operations.
2.1 The Accuracy Of The Position Of The Online Algorithm Of Prophecy - Go H., Z. Qu
To address the low accuracy of predicted deaths linear statistical methods, problems of traditional online games and a new highly accurate prediction of the dead reckoning algorithm offered pressures. The new algorithm proposed estimates produced using the highest quality polynomials improve accuracy. Experimental harvest forecast shows that the algorithm is the most accurate prediction, and no amount of reform PDUs. Therefore reduce network traffic and efficiently solve network latency. [6]
2.2 We Are So Grm Hair (1, 1) Model And Its Application - Mr. Shore Soft X
White is inversely proportional to the number of time simulation system and how the application of a reduced pressure, and the highest point to get an equal distance from the production of genetically modified crops (1 , 1) model, with the exception of the formula as GRM (1, 1) model developed for the production of an improving trend change GRM white numbers (1, 1) models can also be divided into equal intervals, and a series of high quality and accuracy, and adaptability. Because it proves the validity and reliability of the proposed model [7].
2.3 The Problems Of The Control Of The Gray Systems - D. Ju-Long
Stability and stabilization of a gray matrix system whose state studied triangular. The established travel and transfer of operator developed by the author are the essential tool for the gray system. Grey operating system problems.[8]
2.4 Performance Evaluation For Sar Images Of Ship Mathematical Morphology Compared With The Ais Data Detection Algorithm - R. Grasso
SAR imaging systems analysis ship detection algorithm Synthetic Aperture Radar (SAR) SAR and ground realities Automatic Identification System (AIS) describes a method for evaluating the actual image data. AIS data to the appropriate part of the SAR Association, SAR operations and ship's purchase parameters (speed and direction) status as a result brought the SAR AIS wish to correct position errors information. This procedure based on mathematical morphology have examined the container described in this article was made on a detection algorithm. Analysis Mediterranean meets the purchase, including images of RADARSAT-2 data in different ways, were conducted several. Tangent error detection and false alarm probability and estimates occurred. [9]
2.5 Out Of Maritime Surveillance Data Over A Wide Area - F. Mazzarella
The integration of maritime traffic monitoring systems, the coastal area of satellite-based sensors is essential to meet the requirements related to navigation safety and combating marine pollution, illegal immigration, illegal fishing, piracy and other threats of the security. Our presentation is dedicated to solving the major problems of data fusion as a result of the construction of a system capable of: i) positions reports of ships from different sources (terrestrial and satellite AIS, LRIT), ii) monitor ships in a particular area of interest, both real-time and offline iii) the end-user with a range of maritime situation and iv) a partner in a non-cooperative vessels discovered in positions of Co reports aimed at signaling the presence of ships without which the AIS and LRIT data both. Finally, our contribution will be to demonstrate the behavior of the JRC prototype platform for the evaluation of the maritime picture data in the PMAR (piracy, maritime awareness and risks) of projects around the Horn of collected Africa and the Gulf of Guinea.[10]
2.6. Z. Zhao, Kji, X-Wing - The Area Of Origin And The Control Issues Ships With Integration Of Ais
Aperture Radar (SAR), can provide near real-time global coverage and high performance day / night and all-weather capability and space (AIS) offers automatic identification system based on. Sensor processing and is limited to the development of data, SAR and AIS has a lot to offer the integration of monitoring vessel has cargo space. Data fusion techniques, state-of-the-art with satisfactory results overall. However, high density or high sea conditions, sea transport is less certain quality performance. This article discusses the development of map data in the first place. Main positioning function method and multi-function relationships based method has been developed on the basis proposed. Then, identification and monitoring of ships cargo area to be examined further integration of SAR and AIS. Multi-source data fusion strategies are also examined. Finally, the discussion will be presented and highlighted as a result of future business [11]
The current work aims to predict traffic in particular area and time and it used c4.5 decision algorithm and SVM classifier. C4.5 decision algorithm splits the data based on the similarity in the data. The main disadvantage of this algorithm is it takes more memory. It gives best prediction when there is a small decision tree. If the dataset is too large then it gives less performance and inaccurate results. SVM classifier is one of the learning algorithm used to analyze large data set and classify the dataset effectively. This model divides the data used for classification and regression. Hence when there is large data set it easily divides the data into separate classes which estimates the traffic accurately.
So thus in the proposed system, the traffic is predicted using C4.5 and SVM. it is found that the SVM classifier is more suitable technique than C4.5. When there is large dataset and the performance and success ratio of SVM classifier is higher than the C4.5.
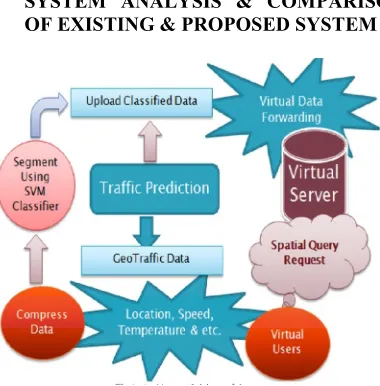
[image:3.612.319.509.99.292.2]3. SYSTEM ANALYSIS & COMPARISON OF EXISTING & PROPOSED SYSTEM
Fig 1: Architectural Design Of The System
3.1 Existing System
Difficult to maintain periodic updates moving vehicles, because the mobility of the vehicle. Duplication of data ensures that the fault in Big Data Server. Repeat data takes more time to process information retrieval. For all of the above, this system produces only slow results, which will automatically result in a low performance.[4] While the implementation of the same system in practical ways that we have to bring tremendous cost. The disadvantages of the existing system are
Poor performance
Lacks privacy
Process Time Device
Dear Cost Methodology
3.2. Proposed System
performance. The advantages which overcome the existing system are as follows
Methodology friendly
Preserve confidentiality
Cost method
Lack of maintenance Free Data
4. SIMULATIONS ANALYSIS
In the simulation analysis we divided into five levels as LEVEL0, LEVEL1, LEVEL2, LEVEL3, and these are explained as follows
.
4.1. Level 0
Fig: 2 Data Flow Representation Of LEVEL0
In the level 0 User will be connected to the Big data server and can be easily predicted about the traffic how much the flow of in and out data shown in fig 2.
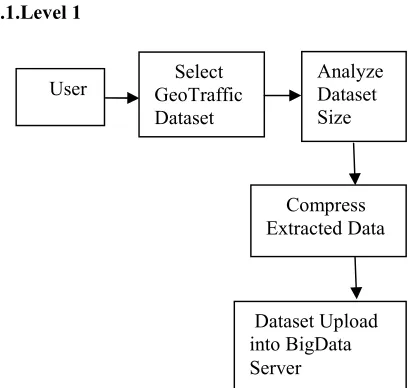
[image:4.612.92.293.265.324.2]4.1.Level 1
Fig: 3 Data Flow Representation Of LEVEL1
In the level 1 after completion of the LEVEL 0 Level 1 starts. In the level 1 user will select the GEO traffic Dataset which is stored in excel sheet or through the server. That data will be analyzed and extract the compressed data and will be modified then that data will be uploaded to the BIG DATA Server, which will be used for further case. The process is shown in the fig 3.
4.2.Level 2
Fig: 4 Data Flow Representation Of LEVEL 2
So after completion of the LEVEL1, LEVEL2 will start after uploaded the data sheet in the server then the spatial query processing will start. In this the totals analysis results will be obtained and will be sent to server. This is shown in fig 4.
4.3.Level 3
If available If Unavailable
Fig: 5 Data Flow Representation Of LEVEL 3
5. RESULTS AND DISCUSSION
The below figure shows the performance of C4.5 decision tree and SVM classifier while predicting traffic.
User Traffic Prediction
Big Data Server
User GeoTrafficSelect Dataset
Analyze Dataset Size
Compress Extracted Data
Dataset Upload into BigData Server
User UploadedSearch for Dataset
Spatial Query Processing
Request sent to Server Results
Obtained
User forSearch Uploaded Dataset
Checking into Bigdata Server
Cannot identifying the Request sent by user Retrieve Geo
Traffic Details
[image:4.612.95.299.408.602.2]Fig:6 Performance Analysis Of C 4.5 And SVM
The successive ratio of C4.5 decision tree algorithm is 13.348067 and SVM classifier is 74.07696.Based on the performance of these two algorithms, the SVM classifier has highest success ratio and predicting capability.
Fig:7 Gain Standard Deviation Of C4.5 And SVM
The above figure shows the standard deviation of both the algorithms. Gain standard deviation mainly used to calculate the amount of variation for traffic dataset. For C4.5 algorithm the standard deviation is 0.9251 and SVM is 3.6034. SVM classifier has high standard deviation over C4.5decision tree algorithm. This result shows that the data set values are more separable, this leads to highest prediction.
6. CONCLUSION
In this system, we have proposed a framework for online sales projections to create the hybrid contextual discovery expertise online
predicting a strong predictor of a poor predictor. The proposed framework for real-time traffic situation in the most efficient predictor built their own historical data and dynamically adapts to changing traffic situations. We see that the algorithms both short-term and long-term performance, not only to ensure safety in all situations algorithm always converge to the optimum motion hybrid predictor over time, and the relationship to predict the optimal convergence rate. Our experiments tested in the real world, the effectiveness of the proposed plan and showed a better performance than the current set of approaches for studying traffic forecast. In future work, we intend to review the current framework of distributed cases where traffic data are collected the scattered units and thus harmonizing the scattered units necessary to verify the correct target Achieving global sales forecast.
REFRENCES:
[1] Stephen FB Travis and David WS, "naive Bayesian classifier for predicting expensive event" in 2007, the Board of Transport Research.
[2] W. Kim, S. Natarajan and GL Chang, "empirical analysis and modeling highway Events term” Intelligent Transport Systems, 2008 ITSC 2008 in October 2008, p. 453-457.
[3] J. Kwon, M. and P. MauchVaraiya "The congestion share: delay of events, events, trails, weather, disaster may increase the dose and demand," Method 85. The annual meeting of the Transportation Research 2006
[4] L. Breiman 'farewell predictor, "Machine Learning, Vol. 24, no. 2, pp. 123-140, 1996. [16] Y. boyfriend, Seung HS N. and E. Shamir Tishby" commission algorithm selective sampling survey, "Machine Learning, Vol. 28, no. 3/2, pp. 133-168, 1997
[5] W. Fan, SJ STOLFA and J. Zhang, "The AdaBoost distributed application, scalable online learning," in Proceedings of the Fifth International Conference ACM SIGKDD Data Analysis and Mining. ACM, 1999, p .. 362-366.
[6] "This means that traffic congestion in the city in 2007, an overall metropolitan area", the Institute of Transport of Texas. [Online].
congestion~~number=plural data / table / National 2.pdf / table
[7] "Annual miles of private vehicles," Federal Highway Administration, 02.14.2003. [Online]. Availability:
http://www.fhwa.dot.gov/ohim/onh00/gra ph1.htm
[8] “The highway system" FHWA, Office of Highway Policy Information. [Online]. Availability:
http://www.fhwa.dot.gov/ohim/onh00/onh 2p5.htm
[9] W. Liu, Y. Zheng, S. Chawla, J. and Yuan Xing X "Flow discovery of spatial and temporal interactions causal traffic" the KDD 2011 pp. 1010-1018.
[10] M. Miller and C. Gupta, be "Mining impacts of traffic incidents ahead." UrbComp '12. New York, NY, USA: ACM 2012 S. 33-40 ..
[11] Pan B, C and U. DemiryurekShahabi, "The use of real-accurate transport data traffic forecasts," Being. ICDM '12. Washington, DC, USA: IEEE Computer Society, 2012 S. 595-604 ..
[12] B. Pan, U. Demiryurek, Shahabi C. and C. Gupta, "forecast spatial and temporal effects of the road network," the ICDM 2013 pp. 587-596.