870
AEROBICS TRAINING MODE BASED ON PLS REGRESSION
MODEL
BENTAN YUAN, XUZHONG YAO
Dongchang College of Liaocheng University, Liaocheng 252000, Shandong, China
E-mail: [email protected]
ABSTRACT
Aiming at the mistakes made by the athletes in matches, this paper probes into how aerobics athletes complete the highly difficult movements that they make small mistakes in their usual training and thus achieve better scores and ranks in matches. In the paper, the explanation and prediction effect of the planned behavior theoretical model is firstly tested; then exercise planning, self-efficacy and social support are introduced as 3 independent variables to establish the partial least squares regression model with the purpose of achieving better explanation and prediction effect on aerobics athletes’ exercise intention and behavior. The operating mechanism of the 3 variables on intention and behavior is further discussed. Based on the improved planned behavior theory, the intervening influence on aerobics athletes’ exercise behavior brought by increased self-efficacy and social support provides reference to the aerobic training.
Keywords: Aerobics, Partial Least Squares Regression, Self-Efficacy, Mathematical Model
1. INTRODUCTION
Suppose in their daily practice, aerobics athletes realize the movement of the highest degree of difficulty can be SUCCESSFULLY completed with the probability of 50%, and at the crucial moment of competition, they will probably fail to finish this movement, how to face such potential threat? Many scholars have proposed some methods, such as adjusting breathing to regulate one’s emotions, refraining oneself from thinking over the possibility of failure, and adjusting one’s mental status to complete the movement smoothly, etc[1-5].
A great deal of research shows that the sole use of intention cannot predict the behavior change. But the self-regulating strategies including action plan and response plan may contribute to eliminate the gap between intention and behavior. Behavioral intention in many areas is the support received with the planning and implementation being taken as motivation. The additive theoretical planned behavior seems to be the fittest to adjust emotions because it lacks sequence structure [6-9]. Other research discovers that no influence of implementation intention on behavior has been found in the study of the behavioral intervention, and to a greater extent, planning is regarded as a mediator variable [10-11]. This paper keeps on investigating the predictive effect of planning as a mediator variable. Self-efficacy theory is derived from Bandera’s social-cognitive theory; it refers to
individuals’ beliefs and the expectations in their capabilities to perform a task successfully, or the sub consciousness of achieving success. The correlation between self-efficacy level and performance of aerobics athletes of the provincial level is 0.57, a previous study showed an average correlation of 0.38 between self-efficacy and performance according to path analysis. Athletes with prominent self-efficacy will exert differently in practice and competition, the same is true with aerobics athletes [2-5].
871
2. PARTICAL LEAST SQUARES
REGRESSION MODEL
The rationale of curve-fitting problem is to find a most suitable function to match the relationship between independent variable(s) and dependent variable(s). In general, an established function expression with unknown factors is given according to prior knowledge or visual observation of data, and the main work is to get the factors. From the computational perspective, the problem seems to be completely solved, but further research is necessary. From the statistical perspective, all data are random variables, and the computation is based on sample data, so hypothesis testing is needed; if the interval estimation is too wide, or the result of factor is zero, the result will be meaningless. Moreover, error analysis of variance analysis model can be used to estimate the results. In short, regression is a statistical analysis method of fitting problem.
Partial least squares regression (PLS) is an advanced multivariable statistics analysis method, which is used to establish the correlations between multiple dependent variables. In a regression analysis problem containing many independent variables and dependent variables in which serious multicollinearity exists, results from general multiple regression method is low in reliability, and PLS regression is an ideal solution to this problem.
A modeling problem:
p
dependent variables:p
y
y
y
1,
2,...,
and
m
independent variables: mx
x
x
1,
2,...,
is put into consideration. To analyze data by PLS regression, in the first step, the first
principal component of independent variables
t
1which is a linear combination of
x
1,
x
2,...,
x
m and contains as much information from original data as possible is extracted, and then the first principalcomponent of dependent variables,
u
1 is extractedwhich has the maximum correlation with
t
1; in thenext step, a regression between
y
1,
y
2,...,
y
p and1
t
is built and the explanation degree is tested, if the explanation degree is precise enough, the computation is terminated, otherwise another principal component is extracted until the precision demand is satisfied. Finally, a PLS regressionequation will be built between
r
components,r
t
t
t
1,
2,...,
and dependent variables
y
1,
y
2,...,
y
p.For convenience of calculations, we suppose
p
dependent variables
y
1,
y
2,...,
y
p andm
independent variablesx
1,
x
2,...,
x
m are all pre-standardized. Fromn
observations, the values of variables are recorded in the following two matrixes:
11 1 0
1
p
n np
y
y
F
y
y
=
,
11 1 0
1
p
n np
x
x
E
x
x
=
The specific steps of PLS Regression analysis for the training of aerobics athletes are as follows:
Step 1: Extract the first principal components of independent variables and dependent variables
respectively. Suppose they are
t
1 andu
1.t
1 is thelinear combination of independent variables
1
( ,...,
m)
TX
=
x
x
:
1 11 1
...
1 1,
T m m
t
=
w x
+ +
w x
=
w X
and
u
1 is the linear combination of independentvariables
(
1, ,)
T p
Y
=
y
y
:
1 11 1
...
1 1T p p
u
=
v y
+ +
v y
=
v Y
.
As is required by PLS regression model,
t
1 and 1u
must draw as much variation information as possible of the array in which they lie to maximize the correlation between them. The result vector of
the first principal component pair,
t
1∧
and
u
1∧
can be determined by standardized observation data
872
11 1 11 11
1 0 1
1 1 1
m
n mn m n
x x w t
t E w
x x w t
∧ = = = ,
11 1 11 11
1 0 1
1 1 1
P
n np p n
Y y v u
u F V
Y y v u
∧ = = = .
The covariance between the first principal
component pair is
Cov
=
( ,
t u
1 1)
that is computedby the inner product of
t
1∧
and
u
1∧
. Thus, this problem will be transformed into an extremum problem with subsidiary condition:
1 1 0 1 0 1 1 0 0 1
2 2
1 1 1 1 1
, , max
1, 1
T T
T T
t u E w F V w E F x
w w w v v v
∧ ∧ = = ⇒ = = = = .
The above is to get the values of
w
1 andv
1when 1 1 0 0 1
T T
w E F v
θ =
⇒
maximizes. To solve this problem, the eigenvalue and eigenvector of the
m m
×
matrix 0 0 0 0
T T
M
=
E F F E
must be obtained in the first place. The greatest eigenvalue
of
M
is2 1
θ
while the corresponding eigenvector
equals to
w
1, andv
1 can be obtained based onw
1through the formula
1 0 0 1 1
1
Tv
F E w
θ
=
.
Step 2: The regression model between
1
,...,
py
y
and
u
1 and that betweenx
1,...,
x
m and1
t
must be constructed. The model is expressed as follows:
0 1 1 1
0 1 1 1
T
T
E t E
F u F
α
β
∧ ∧ = + = + In the equations above,
1
(
11,...,
1) ,
1(
11,...,
1)
T T
m p
α
=
α
α
β
=
β
β
are many-to-one parameter vectors which can be called
effect loading vectors, while
E
1 andF
1 areresidual matrixes. The least squares estimation of
1
α
and
β
1 are as follows:0 1 2 1 1 0 1 2 1 1 T T E t t F t t α β ∧ ∧ ∧ ∧ = = ,
Step 3: Replace
E
0 andF
0 with residualmatrixes
E
1 andF
1 and repeat the previous steps.Generally, in PLS regression method, like the
principal component analysis, the first
l
components(
l
≤
r
)
are necessary to acquire a regression model with preferable prediction, and the rest components are useless to establish the regression formulas. Cross validation is available todetermine the number of principal components
l
. In the process of iteration, a PLS regression model will be built each time with the residual1
n
−
observations, and thei
th observation is putaside. Since the regression formulas are built by
extracting
h
components, the predictive value of(
1, 2,... )
j
y
j
=
p
is in the
i
th observation,( )i j
( )
y
h
∧
can be acquired by introducing the
i
th observation into the regression formulas. The abovesteps repeated by
i
=
1, 2,...,
n
will produce the predicted sum of squared error of thej
thdependent variable
(
j
=
1, 2,... )
p
under the circumstance ofh
components extracted, which is expressed as follows:2 ( ) 1
( ) ( ( )) ( 1, 2,... )
n
j ij i j
i
PRESS h y y h j p
∧
=
=
∑
− =.
The predicted sum of squared error of
1 2
( ,
,...,
p)
TY
=
y y
y
is 1
( )
( )
p
j i
PRESS h
PRESS h
=
=
∑
.
873
3. CASE STUDY
PLS regression model is a new method of multivariate statistics analysis and its prominent characteristic is Multiple Linear Regression analysis, i.e., principal component analysis and canonical correlation analysis of variables are integrated and the regression modeling is realized in an algorithm so that the model can facilitate multivariate data analysis as well as simplify data structure and the correlation analysis of double variables. Besides, PLS regression model has its unique advantage when dealing with the problem of small sample size, independent variable and serious multicollinearity. However, as the PLS regression model can be expressed to be the regression equation of all the previous variables and the principal component it chooses will include all the variables, it cannot solve the more serious problem of correlations among variables, esp., it results in the unsatisfactory computational effect under the
condition of independent variable and small sample size.
In this section, the data of aerobics athletes’ physical training is put into the PLS regression model, the ability of the three variables, i.e., exercise planning, self-efficacy and social support to explain and predict the exercise intention and behavior, along with the function in the process from intention to behavior are tested in the model. The respondents are 10 players in an aerobics team. The first group of variables is the quantitative X of exercise planning, self-efficacy and social support. There are two types of social supports in the study: social support from family and that from friends, each of which cannot predict exercise intention effectively. The second group of variables is training performance index Y including rotating, bending and bouncing. The raw data of physical training are shown in Table 1; correlation coefficient matrix is given in Table 2.
Table 1: Physical Training Data
No.
Exercise Planning
1
( )
x
Self-efficacy
2
(
x
)
Social Support
3
( )
x
Rotating (
y
1)Bending (
y
2)Bouncing (
y
3)1 91 36 50 5 162 60
2 89 37 52 2 110 60
3 93 38 58 12 101 101
4 62 35 62 12 105 37
5 89 35 46 13 155 58
6 82 36 56 4 101 42
7 67 34 60 6 125 40
8 76 31 74 15 200 40
9 54 33 56 17 251 250
10 69 34 50 17 120 38
From the correlation coefficient matrix of 6 variables, it is obvious that a positive correlation exists between exercise planning and self-efficacy, a negative correlation exists between exercise
planning, self-efficacy and social support, and a positive correlation exists between rotating, bending and bouncing.
Table 2: Correlation Coefficient Matrix
x
1x
2x
3y
1y
2y
31
x
1 0.8702 -0.3658 -0.3897 -0.4931 -0.22632
x
0.8702 1 -0.3529 -0.5522 -0.6456 -0.19153
x
-0.3658 -0.3529 1 0.1506 0.225 0.03491
874
2
y
-0.4931 -0.6456 0.225 0.6957 1 0.66923
y
-0.2263 -0.1915 0.0349 0.4958 0.6692 1In the process of PLS regression,
t
1 andt
2 areextracted, with the cross-validation
of
2
2
0.1969
Q
= −
. The regression formula of
standardized variable
y
k about componentt
1 is asfollows:
1 1 2 2
,
1, 2, 3
k k k
y
=
r t
+
r t k
=
The PLS regression formula about
t
1 is asfollows:
* * * * * * * * * * * *
1( 11 1 21 2 31 3) 2( 12 1 22 2 32 3) (1 11 2 12) 1 (1 21 2 22) 2 (1 31 2 32) 3
k k k k k k k k k
y =r w x +w x +w x +r w x+w x +w x = r w +r w x+ r w +r w x + r w +r w x
The value of regression coefficient
1 2 3
(
,
,
)
h h h h
r
=
r
r
r
[image:5.612.90.527.73.537.2]is in Table 3.
Table 3: Regression Coefficient c(
r
h)k
1 2 31
r
0.3416 0.4161 0.14302
r
-0.3364 -0.2908 -0.0652Therefore,
1
0.0778
10.4989
20.1322
3y
= −
x
−
x
−
x
2
0.1385
10.5244
20.0854
3y
= −
x
−
x
−
x
3
0.0604
10.1559
20.0073
3y
= −
x
−
x
−
x
Standardized variables
y x k
k,
k(
=
1, 2, 3)
are restored toy x k
k,
k(
=
1, 2, 3)
, the above formulas are changed into:
1
47.0197 0.0167
10.8237
20.0969
3y
=
−
x
−
x
−
x
2
612.5671 0.3509
110.2477
20.7412
3y
=
−
x
−
x
−
x
3
183.9849 0.1253
12.4969
20.0518
3y
=
−
x
−
x
−
x
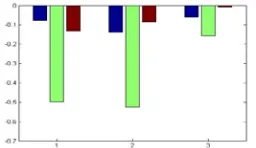
In order to observe the effect of independent
variables on deducing
y k
k(
=
1, 2, 3)
, regression coefficients are shown on Figure 1. This figure demonstrates standardized data and regression formulas. It can be seen that self-efficacy plays an important role in interpreting 3 regression formulas. However, compared with rotating and bending, the regression formula of bouncing is not so ideal, andall the 3 variables respectively cannot account for the result very well.
Figure 1: A Histogram of Regression Coefficients
To better explain and predict the effect of self-efficacy on exercise behavior, 3 scatter diagrams about predictive and actual training results are drawn in Fig 2. The diagrams show that 3 correlations are all positive, with possible social expectation effect contained. For the sake of precision, all sample points are worked out in the
diagrams, with the coordinates
(
y
ik,
y
ik)
∧
, in which
ik
y
∧
[image:5.612.358.486.426.500.2]875
Figure 2: Predictive and Actual Training Results
The results of the model show that converting the exercise intention of aerobics athletes to their personal behaviors may be achieved by specific implementation intention (being aware of when, where and how to perform). Therefore, it is necessary to encourage aerobics athletes to have planned exercise behavior so as to strengthen and protect their intentions. In addition, individuals’ experience of completing the task, i.e. the substitute experience, is an effective way to increase their confidence. Both the external social circumstances and the internal individual factors function greatly in the formation process of aerobics athletes’ exercise behavior. The social support from family and friends, a variable paid attention to in the area of exercise behavior recently, is very important to help regulate individuals’ physical activities.
4. CONCLUSION
The partial least squares regression model is the right combination of both the modeling method and the pattern recognition method which have very clear boundaries for a long time, and the model is a leap in the area of multivariate statistics analysis because regression modeling (Multiple Linear Regression), data structure simplification (Principal Component Analysis) and canonical correlation analysis can be realized in an algorithm. The results of this study support the prediction abilities of exercise motivation and behavior suggested by the variables of the planned behavior theory. The exercise behavior explained by planned behavior variables shows the significant prediction effect of intention. It is necessary to encourage aerobics athletes to have planned exercise behavior so as to promote and protect their intention and make it personal behavior. In addition, the experience of completing the task, i.e. the substitute experience, is an effective way to increase individuals’ confidence. When studying the role of self-efficacy as mediate variable (whether the external social circumstances or the internal individual factor functions in the aerobics athletes’ behavior), social support predictive behavior plays an important role. The study emphasizes self-efficacy as a mediator, not only does the training of self-efficacy have significant predictive effect towards exercise behavior intention, but also social support can
reduce the contact pressure and improve the effort level and response capability.
REFERENCES:
[1] Bandura A., “Perceived self-efficacy in cognitive-development and functioning”, Educational Psychologist, Vol.28, 1993, pp.117-148.
[2] Beiloek S L, Carr T H., “When high-powered people fail: Working memory and “Choking under Pressure” inmath”, Psychology Science, Vol.16, 2005, pp.101-105.
[3] Beiloeks L, Bertenthal B L, MeCoy A M, Carr T H., “Haste does not always make waste: Expertise, direction of attention, and speed versus accuracy in Performing sense or imotor skills”, Psychonomic Bulletin & Review, Vol.11, 2004, pp.373-379.
[4] Eysenck M W, Derakshan N,, “Anxiety and cognitive Performance: Attentional control theory”, Emotion, Vol.7, 2007, pp.336-353. [5] Hanulton K, White K M., “Extending the
theory of Planned behavior: The role of self and social influences in predicting adolescent irregular mode rate to vigorous physical activity”, Journal of Sport& Exercise Psychology, Vol.30, 2008, pp.56-74.
[6] T.S.Bhatti, R.C.Bansal, and D.P.Kothari, “Reactive Power Control of Isolated Hybrid Power Systems”, Proceedings of International Conference on Computer Application in Electrical Engineering Recent Advances , 2002, pp.626-632.
[7] Hiroki O, Mont H., “Defense for basketball field shots”, Procedia Engineering, Vol.34, 2012, pp.730-735.
[8] Matej P, Matej K, Stanislav K, et al., “A trajectory-based analysis of coordinated team activity in a basketball game”, Computer Vision and Image Understanding, Vol.113, No.5, 2009, pp.612-621.
[9] Andrea S., “Movement pattern recognition in basketball free-throw shooting”, Human Movement Science, Vol.31, No.2,2012, pp.360-382.
[10]Liu X.R., “The establishment and principle of basketball defense quality evaluation index system”, Journal of Shenyang Sport University, Vol.30, No.5, 2011, pp.37-142.