696
FACE RECOGNITION USING SEMI DISCRETE
DECOMPOSITION AND FLDA FOR SINGLE TRAINING
IMAGE PER PERSON
1C.RAJAKUMAR, 2DR.K.R.SHANKAR KUMAR
1 Department of ECE, CIET, Coimbatore, Tamilnadu, India.
2 Department of ECE, REC, Coimbatore, Tamilnadu, India.
E-mail: [email protected] , [email protected]
ABSTRACT
PCA and FLDA are mainly used in face recognition and feature extraction. PCA uses eigen vector and FLDA uses within class scatter matrix and between class scatter matrix. When within class matrix becomes singular, it cannot be evaluated. A new method called semi-discrete decomposition is used in single image per person problems. The performance of this method is tested on 4-data bases, namely ORL, UMIST, Poly u-NIR, YALE. The proposed method performs better than SVD based approach and QRCP based approach in terms of recognition rate with training times in two times higher than QRCP.
Keywords: Face recognition, Fisher Linear Discriminant Analysis, Semi Discrete Decomposition,
Singular Value Decomposition.
1. INTRODUCTION
Face recognition is mainly used in securities, crime detection surveillance, human computer interaction. As the training sample size is limited, performance is affected. More number of training samples per each person is required for good performance. Many algorithms are there
to overcome this difficulty.
SAM - Sub space analysis method [1] extracts basis vectors based as some criteria and extraction features by forming face image as a linear combination of basis vector. PCA method finds Optimal orthogonal bases with minimum mean square error. FLDA - Fisher linear discriminant analysis forms optimal projection vectors by maximizing the ratio between the determinants of between class and within class scatter matrices of training face images. Eigen face method [2] was proposed by Turk and pentland. Based on eigen face method, many PCA based algorithm have been developed. FLDA aims at findings projection vectors which separates the datas among different class. A Fisher face method for face recognition was developed. It uses PCA first to convert data into lower dimensional space and then apply FLDA
for face recognition FLDA outperform PCA.
The drawback of FLDA is within class scatter matrix may become singular. Tian et al [3]
proposed to use generalized inverse to avoid singular value problem. Non-singularity of within class matrix is formed by adding a small perturbation and this was proposed by Hong et al [4]. 2D FLDA was proposed by Ye et al. [5]. There is no image to vector transformation in 2D FLDA. It directly calculates within class and between class scatter matrices. In real world scenario, for example driving licence, passport identification only one training sample is available. and within class scatter matrix may be zero and FLDA fails.
To overcome this drawback, Wang et al [6] assumed that all human beings posses a similar intra-class variation, and formed within class scatter matrix by using other subjects. Wu et a1 [7] proposed (PC)2A approach that linearly combines first order images and original training samples to form the new training set. Chen et al [8] divided the test and training image into non - overlapping patterns but it is much time consuming approach.
697 part is used to evaluate within class scatter matrix and general appearance part is used to evaluate between class scatter matrix. The general drawback of this method is training time is more. Mehmet Koc et al [10] proposed a new method based on QRCP algorithm. Recognition rates are higher than SVD based approach. The
proposed method uses semi discrete
decomposition (SDD). The proposed method obtains better recognition rates compared with [8] and [9] with a compromise in training time. It is proved that the proposed method produces good results and outperforms than other
approaches.
2. TWO DIMENSIONAL FISHER LINEAR DISCRIMINANT ANALYSIS (2D-FLDA)
It finds the optimal projection vectors that separate different classes as far as possible [10]. Number of classes is C. Number of selected
samples from each class is N.
ܣ
be the jthimage from ith class. mi is average of ith class.
1
1
1, 2,....
N i i j jM
A
j
C
N
==
∑
=
(1)
The optimal projection vectors can be calculated
by maximizing the J(X)
( )
T B T
W
X S X
J X
X S X
=
(2) Where(
) (
)
1 1 C N T i iw j i j i
i j
S
A
M
A
M
= =
=
∑∑
−
−
i = 1,2,..C;
(
) (
)
1 C
T
B i i
i
S
M
M
M
M
=
=
∑
−
−
11
C i iM
M
C
==
∑
(3)Optimal projection vector [x1, x2….xn] are calculated and each samples is projected into projection vectors, and test image is also projected.
(
1:
2: ....
)
i i
j j d
B
=
A
x
x
x
(4)
i
=
1, 2,.... ,
C
j
=
1, 2,
∴
N
.
Test image is also projected into the
projection vector
B test =A test
[
x
1;
x
2;..
x
d]
(5)
The test image belongs to a particular class is
identified based on the formula.
1 2
*
arg min
d
test ij
k k
i k
C
y
y
−
=
−
∑
i=1,2,…C j=1,2…. N (6)
3. SEMI DISCRETE DECOMPOSITION (SDD)
It provides more accurate approximation for less storage compared to other methods such as truncated singular value decomposition [15]. The SDD approximation of mxn matrix is
(
)
1 1
2 2
1 2
0
...
0
0
...
0
...
:
:
:
0
0
...
T T k n T n k
d
y
d
y
A
x x
x
d
y
=
1 i n T Ti i i n n n i
d x y
X D Y
==
=
∑
⇒
698
20 22 24 26
n
R
a
te
Projection Vector VS Recognition Rate for YALE data base
SVD QRCP SDD
ܣ ൎ ܺ
ܦ
ܻ
்
The column of Xn and Yn need not be linear by
independent.
ALGORITHM
1) Input: Matrix
A R
∈
m×n, non-negativeinteger k
2. Output: k-dimensional SDD of A i.e.
matrices
X
k{ 1, 0,1}
m k×
∈ −
,{ 1, 0,1}
n kk
Y
×∈ −
and diagonalk k
k
D
K
× +∈
3.
R
1←
A
4. for j = 1,2,…..k
i) Select
y
j∈ −
{ 1, 0,1}
nii) While not converged
a) Complete
{ 1,0,1}
m i
x
∈ −
given yj X Rj
b) Complete yi given x and Rj
iii) End while.
iv) Set dj to average of
T
j j j
R
o
x y
over non-zero location of
x y
Tv) Set xj as the jth column of xj, yj as the jth
column of Yj and dj is the jth column of Xj, Yj is
the jth column of Yj and dj is the jth column of Dj
vi)
R
j+
1
←
R
j→
d x y
j j Tj5. End.
6. Return XK, YK, Dk.
[image:3.595.86.525.63.842.2]Fig. 1.Face Image Corresponds For K=25 In ORL Database
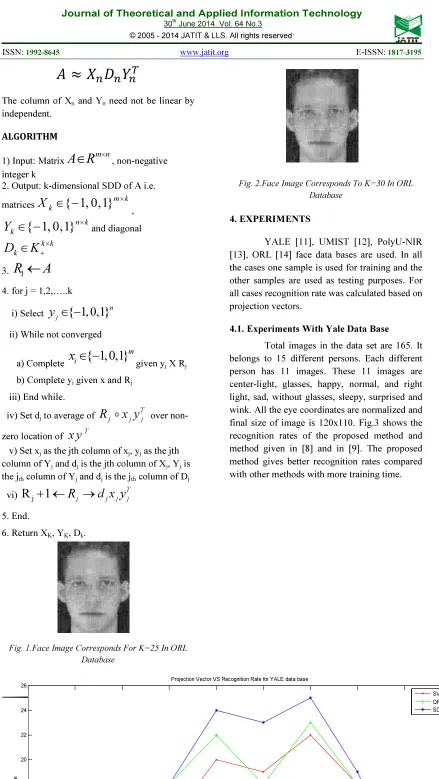
Fig. 2.Face Image Corresponds To K=30 In ORL Database
4. EXPERIMENTS
YALE [11], UMIST [12], PolyU-NIR [13], ORL [14] face data bases are used. In all the cases one sample is used for training and the other samples are used as testing purposes. For all cases recognition rate was calculated based on projection vectors.
4.1. Experiments With Yale Data Base
699
0 2 4 6 8 10 12 14 16 18 20
40 45 50 55 60 65
Projection Vector
R
e
c
o
g
n
it
io
n
R
a
te
Projection Vector VS Recognition Rate for UMIST data base
[image:4.595.86.526.383.653.2]QRCP SVD SDD Fig. 3 Projection Vector Vs Recognition Rate For YALE Database
Fig. 4 Projection Vector Vs Recognition Rate For UMIST Database
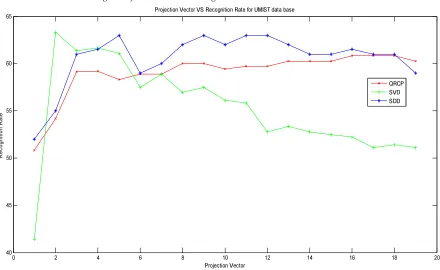
4.2. Experiments With Umist Data Base
Total images in this data base are 64.
No of different subject is 20. Number of images
per subject varies from 19 to 48. Size of cropped
700
0 2 4 6 8 10 12 14 16 18 20
36 38 40 42 44 46 48
Projection Vector
R
e
c
o
g
n
it
io
n
R
a
te
Projection Vector VS Recognition Rate for NRI data base
SVD QRCP SDD
recognition rates of proposed method compared
to method in [8] and method in [9] are shown in
Fig. 4. The proposed method gives better
recognition rates when the projection vector
ranges from 6 to 16 with more training time.
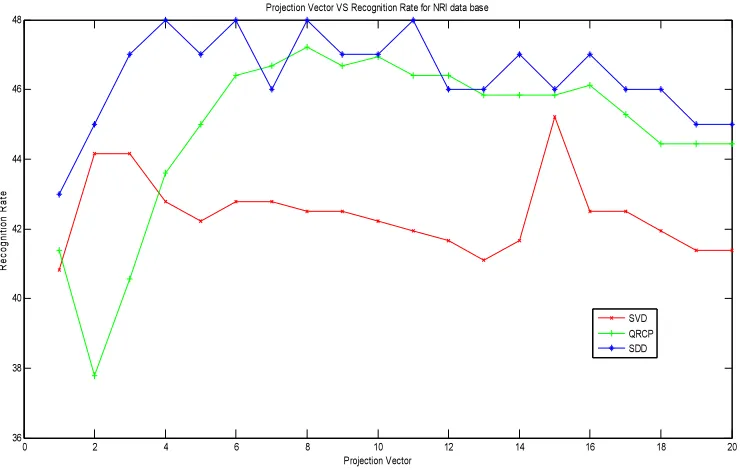
4.3. Experiments With Poly U-Nir Data Base
It contains different images of 350
different people. It includes scale, illumination,
expression, different pose blurring, time etc., and
the image is cropped to 120X90 with 8 bit gray
scale from original size of 576X768. We selected
420 images from 60 subject and we selected the
projection vector up to 20.
Except projection vector 7, 12 and 13 all
projection vectors from 1-20 gives better
recognition rates with more training time. This
is shown in Fig.5.
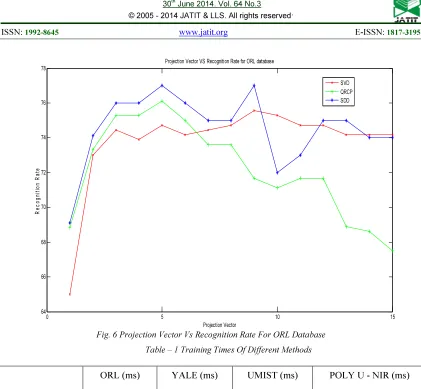
4.4. Experiments With Orl Data Base
Total image in the ORL data base is
400. It contains 40 persons. Each person has 10
different images. These images are with facial
expressions, illumination an many more facial
details. Size of each image is 112X 92 pixels
with 8-bit. One image is used as training and the
remaining nine images are testing images. Fig. 6
shown the recognition rates of proposed method
compared with SVD [8] and QRCP [9]. It
performs very well for the projection vector
range 1-9 and projection vectors 12 and 13.
Table 1 shows the training times of different
[image:5.595.130.502.431.666.2]methods.
701
0 5 10 15
64 66 68 70 72 74 76 78
Projection Vector
R
e
c
o
g
n
it
io
n
R
a
te
Projection Vector VS Recognition Rate for ORL database
[image:6.595.87.508.83.472.2]SVD QRCP SDD
Fig. 6 Projection Vector Vs Recognition Rate For ORL Database
Table – 1 Training Times Of Different Methods
ORL (ms) YALE (ms) UMIST (ms) POLY U - NIR (ms)
SDD - based 610 301 360 800
QRCP based 339 163 200 544
SVD based 627 312 363 936
5. DISCUSSION AND CONCLUSION
In some situation only one sample is
available for each subject in a data base. Some
virtual images are also generated using some
specified technique. Here the two virtual samples
are generated using face image. The training set
consists of totally three images, we tested the
image with ORL, YALE, UMIST, PolyU-NIR
face databases. Better recognition rates were
achieved with more training time. The execution
time is slightly more compared to SVD and
QRCP methods. In the future we will try to
reduce training time and increase recognition
rate through some other method.
REFRENCES:
[1] X. Wang. X.O. Tang.” A unified framework for subspace face recognition”, IEEE Trans. Pattern Anal. Mach. Intell. 26(9)(2004) 1222-1228.
[2] M.Turk, A. Pentland, “Eigen faces for
recognition”.J. Cognitive Neurosci,
3(1)(1991) 72-86.
702 Eigen vector based algorithm”, J.Opt. Sot. Am. A.5(1988),1670 -1672.
[4] Z.Q. Hong, J.Y.Yang, “Optimal discriminant plane for a small number of samples and design method of classifier on the plane”, Pattern Recognition, 24(4) (1991) 317-324. [5] J.Ye,R.Janardan, Q.Li,” Two dimensional
linear discriminant analysis”, Proceedings of Neural Information Processing Systems (NIPS), Vancouver, BC, Canada, 2004. [6] J.Wang, K.N. Plataniotis, A.N. Venetsano
Poulos,” Selecting discriminant eigen faces for face recognition”, Pattern Recognition Lett. 26(10)(2005) 1470-1482.
[7] J.Wu, Z.Zhou, “Face recognition with one
training image per person”, Pattern
Recognit. Lett. 23 (2002) 1711-1719. [8] S.C. Chen, D.Q. Zhang, Z.H. Zhou,”
Enhanced (PC) 2 A for face recognition with one training image per Persons”, pattern Recognit, Lett. 25 (10) (2004) 1173-1181. [9] Quan-Xue Gao, Lei Zhang, David Zhang,
“Face recognition using FLDA with single training image per person”, Applied mathematics and computation 205 (2008) 726-734.
[10] Mechmet Koc, Atalay Barkana,” A new solution to one sample problem in face recognition using FLDA”.
[11]Yale. Face Database
http://cvc.yale.edu/projects/yalefaces/yalefac es.html, 2002.
[12] UMIST Face Database, Daniel Graham http://images.ee.umist.ac.uk/danny/database. html2005.
[13] The Hong Kong Polytechnic University
(PolyU) NIR Face Database
http://www.4.comp.polyu.edu.hk/nbiometric es/polyudb-face.htm2010.
[14] ORL database
http://www.cam-orl.co.uk/facedatabase.html2002.