International Journal of Emerging Technology and Advanced Engineering
Website: www.ijetae.com (ISSN 2250-2459,ISO 9001:2008 Certified Journal, Volume 3, Issue 3, March 2013)
89
Image Retrieval Using Modified Haar Wavelet Transform
and K Means Clustering
Pasnur M.A.
1, P. S. Malge
21Electronics Engg. Department, Walchand Institute of Technology, Solapur, India.
2Associate Professor, Electronics Engg. Department, Walchand Institute of Technology, Solapur, India.
Abstract— The Content Based Image Retrieval (CBIR) has been an active research area. Given a collection of images, it is to retrieve the images based on a query image, which is specified by content. In the proposed paper Wavelet Transform has been used, which is proved to be a very useful tool for image processing in recent years. It allows a function which may be described in terms of details that range from broad to narrow. In the proposed paper, we use modified Haar wavelet transformation for feature extraction of an image. The present method uses a new technique based on wavelet transformations by which a feature vector of size ten, characterizing texture feature of the images is constructed. Our method derives feature vector (10 signatures) for each image characterizing the texture feature of sub image from only three iterations of wavelet transforms. The K Means Clustering Algorithm is used to cluster the group of images based on feature vector of images by considering the minimum Euclidean distance. Our experiments are performed on texture images, and successful matching results are found.
Keywords—Content based Image Retrieval, Haar Wavelet Transform, Feature Extraction, Wavelet Transform , K Means Clustering Algorithm.
I. INTRODUCTION
With the increasing growth of computer technology, rapidly declining cost of storage and ever-increasing access to the Internet, digital acquisition of information has become increasingly popular in recent years [9]. Digital information is preferable to analog formats because of convenient sharing and distribution properties. This trend has motivated research in image databases, which were nearly ignored by traditional computer systems due to the enormous amount of data necessary to represent images and the difficulty of automatically analyzing images.
Content Based Image Retrieval is to retrieve an image from the image database when given a query image. Query Image is the users target image for the searching process. CBIR systems operate in two phases: indexing and searching. In the indexing phase, each image of the database is represented using a set of image attribute, such as color, shape, texture and layout. Extracted features are stored in a feature database. In the searching phase, when a user makes a query, a feature vector for the query is computed. Using a similarity criterion, this vector is compared to the vectors in the feature database.
The images most similar to the query are returned to the user.
Rapid advances in hardware technology and growth of computer power, make facilities for spread use of World Wide Web. This causes that digital libraries manipulate huge amounts of image data. Due to the limitations of space and time, the images are represented in compressed formats. Therefore, new waves of research efforts are directed to feature extraction in compressed domain [12]. In the proposed paper, Haar Wavelet transform is used to calculate the feature vectors of textured images.
The outline of the paper is as follows. Haar Wavelet Transform is reviewed in section 2. Our proposed method of feature extraction and K Means Clustering Algorithm is presented in section 3 and 4 respectively. Experimental results and conclusions are presented in section 5 and 6 respectively.
II. HAAR WAVELET TRANSFROM
Haar wavelet is the simplest wavelet. Haar transform or Haar wavelet transform has been used as an earliest example for orthonormal wavelet transform with compact support. The Haar wavelet transform is the first known wavelet and was proposed in 1909 by Alfred Haar [3]. The Haar function can be described as a step function ψ (x) and in Fig. 1 as follows :
This is also called mother wavelet. The Haar Wavelets are orthogonal, and their forward and inverse transforms require only additions and subtractions. It makes that it is easy to implement them on the computer.
International Journal of Emerging Technology and Advanced Engineering
Website: www.ijetae.com (ISSN 2250-2459,ISO 9001:2008 Certified Journal, Volume 3, Issue 3, March 2013)
90
A HT decomposes each signal into two components, one is called average (approximation) or trend and the other is known as difference (detail) or fluctuation. A precise formula for the values of first average subsignal, at one level for a signal, length Ni.e. is
... (2)
and the first detail subsignal, at the
same level is given as
,
n=1,2,3....N/2 ... (3)To understand how wavelets work, let us start with a simple example. Assume we have a 1D image with a resolution of four pixels, having values
[8 10 6 4]
Haar wavelet basis can be used to represent this image by computing a wavelet transform [11]. Consider the pairs of pixels (8; 10) and (6; 4), take the average of each pair, 9 and 5, and then record this in the next line. Then record the difference of the averages from the first value of the pair. This process is then applied to this new string resulting in the line, where the differences are just carried down. As follows:
[8 10 6 4] [9 5 -1 1] [7 2 -1 1]
The differences recorded to the righthand side are known as the detail coefficients. Thus, the original image is decomposed into a lower resolution (two-pixel) version and a pair of detail coefficients. The recursive process of averaging and differencing is called a filter bank. The original image can be reconstructed by recursively adding and subtracting the detail coefficients from the lower resolution versions
.
Flow of Haar Wavelet Transform:
To calculate the Haar transform of an array of n
samples:
1.Find the average of each pair of samples. (n/2 averages)
2.Find the difference between each average and the samples it was calculated from. (n/2 differences) 3.Fill the first half of the array with averages 4.Fill the second half of the array with differences. 5.Repeat the process on the first half of the array.
While doing this the array size should be power of two.
For 2D Haar Transform [6] the procedure remains the same. For example, apply 2D HT to the following finite 2D signal.
I =
Using 1D HT along first row, the approximation coefficients are
and the detail coefficient are
The same transform is applied to the other rows of I.
By arranging the approximation parts of each row transform in the first two columns and the corresponding detail parts in the last two columns we get the following results:
in which approximation and detail parts are separated by dots in each row. By applying the following step of 1D HT to the columns of the resultant matrix, we find that the resultant matrix at first level is
Thus we have
International Journal of Emerging Technology and Advanced Engineering
Website: www.ijetae.com (ISSN 2250-2459,ISO 9001:2008 Certified Journal, Volume 3, Issue 3, March 2013)
91
To get the value at next level, again HT is applied as earlier on A. Thus the HT is suitable for application when the image matrix has number of rows and columns as a multiple of 2.The advantages of Haar Wavelet transform:
1.Best performance in terms of computation time
2.Computation speed is high 3.Simplicity
4.HWT is efficient compression method.
III. FEATURE EXTRACTION
The objective of the proposed method is to perform the discrete Haar wavelet transformation on an image for the purpose of Feature Extraction. The Haar wavelet transformation is composed of a sequence of low-pass and high-pass filters, known as a filter bank. The low pass filter performs an averaging/blurring operation, and is expressed as:
1
1,12
H
and the high-pass filter performs a differencing operation and can be expressed as:
1
1, 1
2
G
on any adjacent pixel pair.
[image:3.595.371.492.161.280.2]The result of the complete transformation, is composed of 4 new sub-images, which correspond to the blurred image, and the vertical, diagonal, and horizontal differences between the original image and the blurred image. The blurred representation of the image removes the details (high frequency components), which are represented separately in the other three images, in a manner that produces a sparser representation overall, making it easier to store and transmit. Below is an example of a wavelet transformed image portraying the four sub-images as explained above.
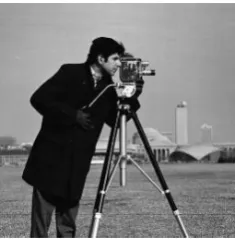
Fig. 2. Original image A
After transformation, the result is as shown below
[image:3.595.381.500.546.657.2]
Fig. 3. After transformation of A
In this paper, we compute feature vectors using Haar wavelets [9] because they are the fastest to compute and have been found to perform well in practice. Haar wavelets enable us to speed up the wavelet computation phase for thousands of sliding windows of varying sizes in an image. They also facilitate the development of efficient incremental algorithms for computing wavelet transforms for larger windows in terms of the ones for smaller windows. One disadvantage of Haar wavelets is that it tends to produce large number of signatures for all windows in image. We proposed the modified Haar wavelet transformation that reduces signatures only by calculating 10 for the image in our method. In the proposed method, we apply Haar Wavelet Transform to Texture based Images. This can also be extended to another features of the images.
In our feature vector computation process, we applied Wavelet Transformations only three times to get 10 sub images of input image in the following way.
Fig.4.After applying Haar Wavelet Transformation for 3 iterations
I1 I2 I12 I4 I3 I112
I14 I13
[image:3.595.105.223.605.725.2]International Journal of Emerging Technology and Advanced Engineering
Website: www.ijetae.com (ISSN 2250-2459,ISO 9001:2008 Certified Journal, Volume 3, Issue 3, March 2013)
92
Flowchart for calculating wavelet signatures
The Wavelet signature (texture feature representation) [9] is computed from sub image as follows,
Where fr is the computed Wavelet signature (texture feature representation) of the sub image, Cij is the representation of the intensity value of all elements of sub image and i × j is the size of the sub image.
IV. KMEANS CLUSTERING ALGORITHM
Clustering is to partition data points into clusters such that the data points within the same group are similar to each other, while the data points in different groups are dissimilar. Many clustering methods have been successfully used for image clustering to better organize, represent and browse images as well as to improve the performances of related applications, such as Content Based Image Retrieval (CBIR), image annotation, and image indexing [14].
Clustering algorithms can be broadly divided into two
groups: hierarchical and partitional. Hierarchical
clustering algorithms recursively find nested clusters either in agglomerative mode (starting with each data point in its own cluster, merge the most similar pair of clusters successively to form a cluster hierarchy) or in divisive (top-down) mode (starting with all the data points in one cluster, recursively divide the cluster into smaller clusters).
Partitional clustering algorithms find all the clusters simultaneously as a partition of the data and do not impose a hierarchical structure [15].
The most well-known hierarchical algorithms are single-link and complete-link; the most popular and the simplest partitional algorithm is K-means.
A clustering method that doesn’t require computation of all possible distances is k-means clustering. It differs from hierarchical clustering in several ways. You have to know in advance the number of clusters you want. You can’t get solutions for a range of cluster numbers unless you rerun the analysis for each different number of clusters. The algorithm repeatedly reassigns cases to clusters, so the same case can move from cluster to cluster during the analysis [17]
The basic step of k-means clustering is simple. In the beginning, determine number of cluster K and assume the centroid or center of these clusters. We can take any random objects as the initial centroids or the first K objects can also serve as the initial centroids. Then the K means algorithm will do the three steps below until convergence
Algorithm for K Means Clustering:
1.Determine the initial centroid coordinate
2.Determine the distance of each object to the centroid
3.Group the object based on minimum Euclidean distance (find the closest centroid)
Clustering is very efficient and powerful technology to handle large data sets. It assists faster image retrieval and also allows the search for most relevant images in large image database [16]. K-means is a clustering method which is known for its efficiency in producing accurate results in image retrieval. By using k-means user can select the closer group of image so that they get fast result
.
Finally, query image is the image the user is interested in and wants to find similar images from the image database. The feature vector for the query image is extracted and is now compared with the image clusters. Based on minimum Euclidean distance, the target image cluster closest to the query image is retrieved from the database.
V. RESULTS
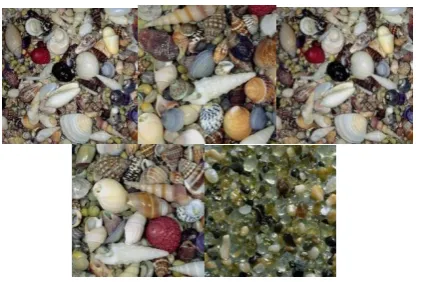
The Proposed method is applied on the following textured images. In Fig. 5, the top left is the query image and all other are the retrieved images for the query. Table 1 shows the feature vector for the query image.
Image I of size r * r
Divide Image I based on Haar Wavelet Transform into I111, I112, I113 and I114 of size r/2 * r/2
Compute signatures fr for I111, I112 and I113
Divide image I111 into I11, I12, I13, and I14 of size r/4 * r/4
Compute signatures fr for I12, I13, I14
Divide image I11 into I1, I2, I3 and I4 of size r/8 * r/8
International Journal of Emerging Technology and Advanced Engineering
Website: www.ijetae.com (ISSN 2250-2459,ISO 9001:2008 Certified Journal, Volume 3, Issue 3, March 2013)
[image:5.595.67.278.132.273.2]93
[image:5.595.88.230.313.496.2]Fig. 5 Top left is the Query image and all other are the retrieved images for the Query
Table 1.
Feature Vector for Query Image
VI. CONCLUSION
By deriving ten feature vectors from wavelet transformation in three iterations, reduces overall time complexity. The K Means clustering algorithm effectively minimizes the undesirable results and gives a good matching pattern, that will be having zero or a minimum set of no relevant images.
REFERENCES
[1 ] S. Saha Ray, ―A New Wavelet Operational method using Block Pulse and Haar Functions for Numerical Solution of a Fractional Partial Differential Equation‖, Journal of Fraction Calculus and Applications,2011.
[2 ] Piotr Porwik, Agnieszka Lisowska, ―The Haar Wavelet Transform in Digital Image Processing: Its Status and Achievements‖ [3 ] Phang Chang, Phang Piau, ―Simple Procedure for the Designation
of Haar Wavelet Matrices for Differential Equations‖, Proceeding of the International Multiconference of Engineers and Computer Scientists 2008 Vol II, March 2008.
[4 ] Patrick J. Van Fleet, ― Discrete Haar Wavelet Transform‖, PREP, Wavelet Workshop 2006.
[5 ] Anuj Bhardwaj and Rashid Ali, ― Image Compression using Modified Fast Haar Wavelet Transform‖, World Applied Sciences Journal 7 (5): 647-653, 2009
[6 ] P. Raviraj and M.Y. Sanavullah, ―The Modified 2D-Haar Wavelet Transformations in Image Compression‖, Middle-East Journal of Scientific Research 2 (2): 73-78, 2007
[7 ] Kamrul Hasan Talukder and Koichi Harada, ―Haar Wavelet Based approach for Image Compression and Quality Assessment of Compressed Image‖, IAENG International Journal of Applied Mathematics, 36:1, IJAM_36_1_9.
[8 ] Rohit Arora, Madan Lal Sharma, Nidhika Birla, Anjali Bala, ―An Algorithm for image compression using 2D Wavelet Transform‖, International Journal of Engineering Science and Technology (IJEST)
[9 ] N. Gnaneshwara Rao, Dr. V. Vijaya Kumara, V Venkata Krishna,‖ Texture Based Image Indexing and Retrieval‖, IJCSNS International Journal of Computer Science and Network Security, VOL.9 No.5, May 2009
[10 ]Iman Makaremi, ‖Two Dimensional Wavelet and its Applications‖.
[11 ]Emily Brown,Samuel Picton Drake, Anthony Finn, ‖Wavelet Decomposition for Discrete Probability Maps‖ ,Department of Defence, Australian Government
[12 ]Hossein Nezamabadi-pour and Saeid Saryazdi, ―Object –Based Image Indexing and Retrieval in DCT Domain using Clustering Techniques‖, World Academy of Science, Engineering and Technology 3 2005
[13 ]Dengsheng Zhang, Aylwin Wong, Maria Indrawan, Guojun Lu, ―Content-based Image Retrieval Using Gabor Texture Features‖
[14 ]Yi Yang, Dong Xu, Feiping Nie, Shuicheng Yan, Yue Ting Zhuang, ―Image Clustering using Local Discriminant Models and Global Integration‖.
[15 ]Anil K. Jain, ―Data Clustering: 50 Years Beyond K-Means‖. [16 ]Vanita G.Tonge, ― Content Based Image Retrieval by
K-Means ―Clustering Algorithm‖ , International Journal of Engineering Science and Technology (IJEST)
[17 ]Cluster Analysis Feature
Vector
I1 22.804322
I2 13.064630
I3 22.393480
I4 51.091853
I5 31.463138
I6 48.733768
I7 1063.1733
I8 113.47573
I9 65.258778