DESPECKLING AND SEGMENTATION OF ULTRASOUND
IMAGES OF CAROTID ARTERY FOR PLAQUE DIAGNOSIS
IN HEALTH CARE
1D.SASIKALA, 2M.MADHESWARAN
1Assoc. Prof., Department of ECE, Vivekanandha College of Engineering for Women, Tiruchengode, India
2Professor, Department of ECE, Mahendra Engineering College, Namakkal, India
E-mail: [email protected] , [email protected]
ABSTRACT
A new method for segmentation of the carotid artery for classifying it as diseased or normal towards plaque diagnosis is proposed in this paper. Kernel Fuzzy C- Means clustering is used for segmenting the longitudinal section of the carotid artery using which the wall layers of the artery are identified for classifying it as diseased or normal. As a pre-processing step a–nonlinear mean filter is used for speckle filtering among a set of various traditional filters after measuring its performance. Removing speckle noise may remove useful information in the images like small lesions or artefacts, plaque or calcification in the arteries. Hence a filter that detects the speckle in each and every pixel and suppresses the speckled pixel is proposed in this paper. The algorithm was applied on ultrasound images of the carotid artery for extracting the boundary of the arterial wall and detecting the wall layers for clinical purposes. The results show excellent performance of the method.
Keywords:Carotid Artery, Clustering, Speckle, Plaque, Segmentation.
1. INTRODUCTION
Ultrasound imaging is considered to be noninvasive among the currently available medical imaging modalities and is practically harmless to the human body, portable, accurate, and cost effective. These features have made the ultrasound imaging the most prevalent diagnostic tool. Medical ultrasound images are often corrupted by noise during acquisition and transmission. However, the main disadvantage of medical ultrasonography is the poor quality of images, which are affected by multiplicative speckle noise. It tends to degrade the resolution and contrast of ultrasound images, thus may lead to eliminate some useful and important diagnostic information. Conventional speckle suppression methods are based on arithmetic mean filter, geometric mean filter and median filtering [1]. These filters can reduce speckle but it does not preserve useful details such as edges of the image properly. Although low-pass filtering is a common technique to reduce speckle noise, this technique is not applicable for ultrasound images since low-pass
filters often blur the edges and cause loss of details in low contrast border regions making the image unsuitable for segmentation [2]. An alternative method of filtering speckle using non-linear mean filter is proposed in this paper.
2. PROPOSED FILTERING METHOD
the mean in the neighbourhood is considered to be the speckled pixel and is replaced by the mean.
Algorithm of the proposed method:
- start
- Define window size
- Measure the deviation p(i) of the pixel from its neighbours in the window
- Compare with the threshold(T)-mean of the neighbours
- if p(i)>T- bad pixel else - good pixel - Replace only bad pixels with mean of
neighbours - End
3. SEGMENTATION
Image segmentation plays a crucial role in many medical imaging applications. With the increasing size and number of medical images, the use of computers in facilitating their processing and analyses has become necessary. In particular, as a task of delineating anatomical structures and other regions of interest, image segmentation algorithms play a vital role in numerous biomedical imaging applications such as the quantification of tissue volumes, diagnosis, study of anatomical structure, and computer-integrated surgery. Classically, image segmentation is defined as the partitioning of an image into non-overlapping, constituent regions which are homogeneous with respect to some characteristics such as intensity or texture.
Image segmentation has an important role in the field of image understanding, image analysis, pattern identification. The foremost essential goal of the segmentation process is to partition an image into regions that are homogeneous with respect to one or more self characteristics and features. Clustering has long been a popular approach to untested pattern recognition. The fuzzy c-means [6] algorithm, as a typical clustering algorithm has been utilized in a wide range of engineering and scientific disciplines such as Medical imaging, bioinformatics, pattern recognition, and data mining.
For fuzzy segmentation of ultrasound image data, the algorithm is realized by modifying the objective function in the conventional fuzzy C-means (FCM) algorithm using a kernel-induced distance metric and a spatial penalty on the membership functions. Firstly, the original Euclidean distance in the FCM is replaced by a kernel-induced distance, and thus the corresponding
algorithm is derived and called as the kernelized fuzzy C-means (KFCM) algorithm[7],[8], which is shown to be more robust than FCM. Then a spatial penalty is added to the objective function in KFCM to compensate for the intensity in homogeneities of ultrasound image and to allow the labelling of a pixel to be influenced by its neighbours in the image. The penalty term acts as a regularizer and has a coefficient ranging from zero to one.
4. FUZZY C-MEANS CLUSTERING
Given a data
X={ … … … . ⊂ … …. 1
the original FCM algorithm partitions X into c fuzzy subsets by minimizing the following objective function
where c is the number of clusters and selected as a specified value in the paper, n the number of data points, the member of in class i, satisfying ∑ , m the quantity controlling
clustering fuzziness and v is set of control cluster centres or a prototypes ∈ .
The function is minimized by the famous alternate iterative algorithm. Since the original FCM uses the squared-norm to measure inner product with an appropriate 'kernel' function, one similarity between prototypes and data points, it can only be effective in clustering 'spherical' clusters and many algorithms are resulting from the FCM in order to cluster more general dataset. Most of those algorithms are realized by replacing the squared-norm in (1) the object function of FCM with other similarity trial (metric) [6-7].
Kernel-based fuzzy c-means algorithm adopts a new kernel-induced metric in the data space to restore the original Euclidean norm metric in FCM. By replacing the inner product with an appropriate 'kernel' function, one can absolutely perform a nonlinear mapping to a high dimensional feature space without increasing the number of parameters.
(
,
)
....(
2
)
2
1 1
∑ ∑
− −
−
≡
c
i i i n
k m ik
m
u
x
v
5. KERNEL FUZZY C-MEANS CLUSTERING
Define a nonlinear map ∙∙→ ∈ ,where
∈ ∙ denotes the data space and F is the transformed feature space with higher even infinite dimensions.
KFCM minimized the following objective function:
Where
‖ ‖ଶ , , 2, . 4
where , is an inner product of
the kernel function. If we adopt the Gaussian function as a kernel function,
, exp ‖ ‖2! " … …. 5
and then , 1 according to (4), (2) can be rewritten as
$, % ≡ 2 ' '
(1 ), * … 6
Minimizing (6) under the constraint of , ,
-1 we have
1/1 (,, *
భ ሺషభሻ
∑ 1/1 , ሺషభሻభ
… .. 7
∑(,, *
∑ (,, *
… … 8
Here we now utilize the Gaussian kernel function for straight forwardness. If we use additional kernel functions, there will be corresponding modifications in (7) and (8). In fact, (4) can be anayzed as kernel-induced new metric in the data space, which is defined as the following
And it can be proven that k(x,y) is defined in (9) is a metric in the original space takes as the Gaussian kernel function. According to (8), the
data point is capable with an additional weight, , which measures the similarity between and and when is an outlier i.e.,
is far from the other data points, then
, will be very small, so the weighted sum of data points shall be more strong. The full explanation of KFCM algorithm is as follows:
KFCM Algorithm:
Step 1: Select initial class prototype Step 2: Update all memberships with 7. Step 3: Obtain the prototype of clusters in the forms of weighted average with (8).
Step 4: Repeat step 2-3 till termination. The termination criterion is.‖% %‖ 1∈
Where ‖∙‖ is the Euclidean norm. V is the vector of cluster centres & ∈ is a small number that can be set by user (here ∈ 0.01 ).
6. RESULTS AND DISCUSSIONS
The proposed method of speckle reduction eliminates only the speckled pixels without affecting the good pixels. The performance of the proposed method studied for longitudinal section images of the carotid artery shown in tables 1 and 2. The denoising is performed as a preprocessing step before segmentation of the longitudinal sections of the carotid artery for finding the intima and media layers in diagnosing plaque. As the plaque portion need not be altered in property by the denoising filter its segmentation by two methods are studied to validate the performance.
Table.1 Performance Of Filters For Normal Carotid Artery
FILTERS
PSNR for Variance
0.01 0.02 0.04 0.06
Wavelet filter 30.86 30.07 28.53 27.30 Anisotropic
diffusion filter 32.53 29.54 26.49 24.74 Fourth order
PDE filter 32.23 31.15 29.46 28.21 Frost filter 30.92 30.93 30.75 30.54
Median filter 32.98 31.84 30.31 29.06 Bayes shrink
filter 32.30 29.43 26.44 24.71 Wavelet Bayes
filter 32.51 29.53 26.49 24.74
)
9
...(
))
,
(
1
(
2
)
(
)
(
x
−
φ
y
=
−
k
x
y
φ
(
,)
( ) ( ) ... (3) 2 1 1∑ ∑
− − − ≡ ci i i
n
k m ik
m
u
x
v
0.01 0.015 0.02 0.025 0.03 0.035 0.04 0.045 0.05 0.055 0.06 24
26 28 30 32 34 36 38
Variance
P
S
N
R
Hybrid median
filter 32.74 29.77 29.06 28.55 Relaxed
median filter 32.76 31.65 30.09 29.01 Mean filter 28.64 28.48 28.12 27.70
Nonlinear
[image:4.595.75.517.70.449.2]mean filter 33.06 32.61 31.74 30.95
[image:4.595.86.309.96.434.2]Fig.1. Performance Of Filters For Normal Carotid Artery
Table.2 Performance Of Filters For Abnormal Carotid Artery
FILTERS PSNR for Variance
0.01 0.02 0.04 0.06 Wavelet filter 32.81 31.55 29.52 28.11 Anisotropic
diffusion filter
33.59 30.60 27.54 25.84
Fourth order PDE filter
35.21 33.54 31.35 29.87
Frost filter 33.17 33.07 32.88 32.61 Median filter 36.14 34.50 32.40 30.94 Baye shrink
filter
33.51 30.56 27.52 25.83
Wavelet Bayes filter
33.59 30.60 27.54 25.84
Hybrid median filter
34.92 33.13 31.16 29.92
Relaxed median filter
35.84 34.16 32.12 30.70
Mean filter 30.15 29.96 29.56 29.19 Nonlinear mean
filter
35.84 35.16 34.00 33.04
From the figures 1 and 2 it is found that the nonlinear mean filter perform better compared with the existing filters and it is validated by the segmentation methods.
Fig.2 Performance Of Filters For Abnormal Carotid Artery
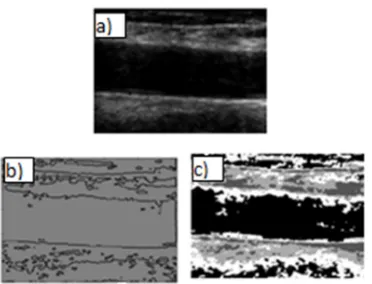
[image:4.595.313.508.252.440.2]For segmentation the original ultrasonic image was partitioned into sub images by KFCM. Here the segmented images in figure 3b and 3c shows the active contour based and KFCM based segmentation results of longitudinal section of normal carotid artery respectively that is given in figure 3a.
0.01 0.02 0.03 0.04 0.05 0.06
24 25 26 27 28 29 30 31 32 33 34
Variance
P
S
N
[image:4.595.87.294.516.742.2]Fig.3.A) Original Image Of Longitudinal Sections Of Normal Carotid Artery Images B) Segmented Images Using Active Contour C) Segmented Images Using
KFCM Clustering
The segmented images in figure 4b and 4c shows the active contour based and KFCM based segmentation results of longitudinal section of diseased carotid artery respectively that is given in figure 4a. The segmented images in figure 5b and 5c shows the active contour based and KFCM based segmentation results of cross sectional view of diseased carotid artery respectively that is given in figure 5a.
Fig.4.A) Original Image Of Longitudinal Sections Of Abnormal Carotid Artery Images B) Segmented Images
Using Active Contour C) Segmented Images Using KFCM Clustering
Fig.5.A) Original Image Of Cross Section Of Carotid Diseased Artery B) Segmented Image Using Active Contour C) Segmented Image Using KFCM Clustering
From the results it is clearly observed that the adventitia to intima wall layers segmentation in the far wall of the carotid artery is better in KFCM based method than the active contour based method of segmentation. It is also clear that the KFCM based segmentation of the diseased artery shows breaks in the intima layer due to the presence of plaque materials that leads to atherosclerosis which is not clear in active contour method. The cross sectional image in 5c clearly shows the atherosclerotic plaque region that reduces the lumen diameter that in turn reduces the blood flow to the brain causing stroke.
7. CONCLUSIONS
[image:5.595.91.516.76.286.2] [image:5.595.92.278.469.611.2]REFERENCES
[1] Manish Goyal, Gianetan Singh Sekhon, “Hybrid Threshold Technique for Speckle Noise Reduction using wavelets for Grey scale images”, IEEE Transaction on Image Processing, June 2011, IJCST Vol. 2, Issue 2. [2] Sivakumar.R, Nedumaran.D, “Comparative
study of Speckle Noise Reduction of Ultrasound B-scan Images in Matrix Laboratory Environment”, International Journal of Computer Applications, November 2010, Volume 10– No.9.
[3] O. V. Michailovich, and A. Tannenbaum, Despeckling of Medical Ultrasound Images,” IEEE Trans. Ultrasonics, Ferroelectrics, and Frequency Control, Jan. 2006, vol. 53, no. 1, pp. 64–78.
[4] C. S Burrus, R. A. Gopinath, and H. Guo, Introduction to Wavelets and Wavelet Transform. Upper saddle River, NJ : Prentice-Hall, 1998.
[5] A. Achim, A. Bezerianos, and P. Tsakalides, “Novel Bayesian multiscale method for speckle removal in medical ultrasound images,” IEEE Trans. Med. Imag., Aug. 2001, vol. 20, pp. 772–783.
[6] Israr Hussain, Hujun Yin , “A Novel Wavelet Thresholding Method for Adaptive Image Denoising” ISCCSP 2008.
[7] R.C. Gonzalez and R.E. Woods., Digital Image Processing using matlab. Ed.Prentice-Hall, 2004.
[8] J.C.Bezdek , Patern Recognition with Fuzzy Objective Function Algorthims, Plenum Press , New York, 1981.
[9] K.L. Wu, M.S. Yag, Alternative c-means clustering algorthims, Pattern Recognition, 2002, vol.35, pp.2267-2278.