IT GOVERNANCE SELF ASSESSMENT APPLICATION FOR
E-GOVERNMENT IMPLEMENTATION IN INDONESIA
1JOHAN J.C. TAMBOTOH, 2RUDI LATUPERISSA
1
Department of Information System, Satya Wacana Christian University, Salatiga, Indonesia 2
Department of Information System, Satya Wacana Christian University, Salatiga, Indonesia
E-mail: [email protected], [email protected]
ABSTRACT
Information Technology (IT) implementation in the government sector in Indonesia continues to increase every year. However, this increase has not been followed by good governance due to the lack of attention to good IT management. Measurement of IT governance is therefore required as a basis for the continuous improvement of the IT services to government agencies. This study is aimed at producing an application to measure the maturity level of IT governance in government institutions, thus facilitating the process of improvement of IT services. The application developed is based on COBIT 4.1 framework and the design used is Unified Modeling Language. Through stages of information systems development, this research results in an applications for measuring the maturity level of IT governance that can be used by government agencies in assessing existing IT governance.
Keywords: Information Technology Governance, IT Governance Maturity Level, COBIT 4.1
1.INTRODUCTION
Investment in information technology (IT) in the government sector (e-Government) in Indonesia has increased significantly each year. In 2009 fiscal year, the realization of central government spending on IT was IDR 10 trillion or approximately 1.66% of the total Central Government Expenditures in 2009 and it was an increase of 1.27% from the IT Expenditures in 2008 [1]. However, the increase in government IT investment has not been followed by the optimized uses of IT for development and improvement of the country's economy. Based on E-Government Readiness Index (EGDI), published by the United Nations Public Administration Programme (UNPAP) in 2010, Indonesia is at position 109. The E-Government Readiness Index (EGDI) is a composite measure of the capacity and willingness of countries to use e-government for ICT-led development. The value of Indonesian e-Government development index is 0.4026, or lower than the value of the previous year which was 0.4107. This value is still below the average South-Eastern 0.4290 and 0.4514 below the world average [2].
The EGDI looks at the most important dimensions of e-government: (i) scope and quality of online services, (ii) telecommunication connectivity, and (iii) human capacity. EDGI
indicators are measured by the formula: (0.34 × online service index) + (0.33 × telecommunication index) + (0.33 × human capital index). Scope indicators and quality of online services and human capital index are directly related to the implementation of IT governance in the government sector [2]. IT governance itself is an attempt to ensure the management of IT to support and align with organizational strategy undertaken by the board of directors (head of government), executive management and IT management. IT governance is an integral part of corporate governance in ensuring the attainment of the objectives that have been established at the starting period [3].
the benefits of IT investments have been made [4]. Governance guide does not explain how and what should be done by government agencies to ensure the implementation of IT governance.
There is a technical framework and guide for the implementation of IT governance that is currently used by the business sector to ensure the achievement of the benefits of IT investments [5]. IT governance framework can be modified to the needs of government agencies in order to optimize the use of IT for the achievement of development objectives and to the welfare of society. The mentioned framework is Control Objectives for Information and Related Technology (COBIT) 4.1, developed by the IT Governance Institute (ITGI) [6]. This framework can be modified and developed into an application to conduct a self assessment of IT governance as well as guidance on IT governance.
Therefore, this study has developed an application to measure the maturity level of IT governance in government agencies using COBIT 4.1 framework. This application helps government agencies in conducting self-assessment and determine to what extent the implementation of IT governance has been done. The measurement results illustrate the current state so as to facilitate improvement of IT governance. All sub-processes that exist within the framework of COBIT 4.1 is used and measured based on control objectives that exist in each sub-process. This application facilitates the development of recommendations and improvements on each weak sub-process. This application is designed using Unified Modeling Language (UML) and is built with PHP & MySQL.
2.LITERATURE REVIEW
2.1. IT Governance
IT Governance focuses specifically on information technology systems, their performance and risk management. The primary goals of IT Governance are to assure that the investments in IT generate business value, and to mitigate the risks that are associated with IT. This can be done by implementing an organizational structure with well-defined roles for the responsibility of information, business processes, applications and infrastructure.
According to Weill and Ross [4], IT governance is related to the management right in decision-making and a framework that can be accounted for encouraging expected behavior in the use of IT. There are 5 (five) key decisions related to
[image:2.595.303.545.134.278.2]IT governance as shown in Figure 1 below.
Figure 1. Key IT Governance Decisions
2.2.COBIT 4.1
[image:2.595.308.522.540.659.2]COBIT 4.1 is a framework for IT governance consisting of a process collection of IT best practices, which can be implemented at all organizational levels to improve the governance and management of IT. This framework is a comprehensive tool for creating IT governance. COBIT 4.1 provides a best practice reference that covers the entire business process of an organization and exposes it in a logical structure that can be managed and controlled effectively. COBIT 4.1 has 4 main domains that are interrelated, as in Figure 2, and has 34 sub-processes that become the control objectives. The combination of 4 domains is the reason for the selection of the COBIT 4.1 framework for measuring the maturity level of IT governance in this study.
Figure 2. Inter-relation of COBIT 4.1 Domain [7]
2.3.IT Governance Maturity Level
assessment for themselves by explaining to the manager or head about the IT process, by showing the weakness of the existing management and setting the appropriate targets. This measurement tool offers the easiness to understand how to determine the current position (as-is) and the position of the future (to-be) and allow the organization to make comparisons to itself based on the best practices and standard guidelines [8].
Figure 3. Maturity Level of IT Governance
3.RESEARCH METHOD
This research is an engineering study, where the end result is an application that is used to measure the maturity level of IT governance. For that purpose, the research method used is based on the phases of Software Development Life Cycle (SDLC) and prototyping approach. The final result is still a prototype continues to be developed in line with the needs of government agencies. The research starts with the analyzing of the needs of the system, and then proceeds with the design and manufacturing system design using UML and the last is the creation of applications using PHP and MySQL tools.
The first phase of testing by the developer uses whitebox Testing approach and on the user side uses Blackbox Testing. The stage of design uses diagrams provided in UML, which is the Use Case Diagram, Activity Diagram, Class Diagram, Sequence Diagram, Collaboration Diagram, Component Diagram and Deployment Diagram.
4.RESULTS AND ANALYSIS
The followings are the results of the research in the form of design and application design using UML and web-based applications which is an application for measuring the maturity level of IT governance in government institutions. The application design shown includes Use Case, Activity and Class Diagrams.
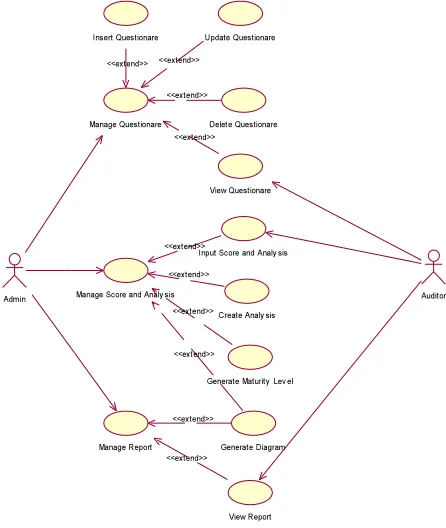
4.1. Use Case Diagram
Use Case diagram, as in Figure 4, describes the relationship of the functionality contained in the application. Actors within the system are Admin and Auditor. The functions that can be performed by the Admin: Manage Questioner function (this function has sub-functions of Insert, Update, Delete, and View Questioner), Manage Score and Analysis function (this function has sub-functions of Input Score and Analysis, Analysis Create, GenerateMaturity Level and Generate Diagram), Manage Report function (this function has sub-functions of Generate Diagram and View Report). While the actor has the functions of View Questioner Auditor, Input Score and Analysis, and
View Report.
Figure 4. Use Case Diagram
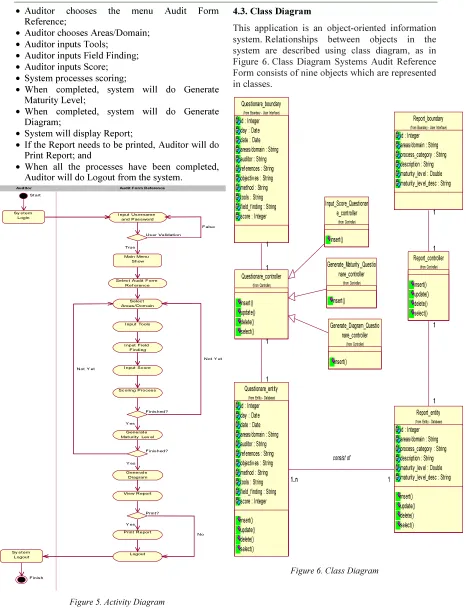
4.2.Activity Diagram
The Activity Diagram, as in Figure 5, describes the business process in the system, covering the following processes:
• Auditor does Login to the system using
Username and Password;
• System does User Verification, if true, then the
main menu is displayed;
Create Analy sis
Generate Maturity Lev el
Generate Diagram Insert Questionare Update Questionare
Delete Questionare Manage Questionare
Manage Score and Analy sis
Manage Report Admin
Input Score and Analy sis
View Report View Questionare
Auditor <<extend>> <<extend>>
<<extend>>
<<extend>>
<<extend>>
<<extend>>
<<extend>>
<<extend>>
<<extend>>
[image:3.595.313.536.324.588.2]• Auditor chooses the menu Audit Form
Reference;
• Auditor chooses Areas/Domain; • Auditor inputs Tools;
• Auditor inputs Field Finding; • Auditor inputs Score; • System processes scoring;
• When completed, system will do Generate
Maturity Level;
• When completed, system will do Generate
Diagram;
• System will display Report;
• If the Report needs to be printed, Auditor will do
Print Report; and
• When all the processes have been completed,
[image:4.595.72.538.122.732.2]Auditor will do Logout from the system.
Figure 5. Activity Diagram
4.3. Class Diagram
This application is an object-oriented information system. Relationships between objects in the system are described using class diagram, as in Figure 6. Class Diagram Systems Audit Reference Form consists of nine objects which are represented in classes.
Figure 6. Class Diagram
St art
Sy s t em Login
Sy s t em Logout
Finish
I nput U s ernam e and Pas s word
U s er Validation
Main Menu Show
Selec t Audit F orm R ef erenc e
Selec t Areas / D om ain
I nput Tools
I nput Field Finding
I nput Sc ore
Sc oring Proces s
F inis hed?
Generat e Mat urity Lev el
F inis hed?
Generat e D iagram
View R eport
Print?
Print R eport
Logout True
F alse
N ot Y et
Y es
Y es N ot Y et
Y es
N o Audit Form Reference
Auditor Generate_Diagram_Questio nare_controller insert() (from Controller) Input_Score_Questionar e_controller insert() (from Controller) Generate_Maturity _Questio nare_controller insert() (from Controller) Questionare_boundary
id : Integer day : Date date : Date areas/domain : String auditor : String ref erences : String objectives : String method : String tools : String f ield_f inding : String score : Integer
(from Boundary - User Interface)
Questionare_controller insert() update() delete() select() (from Controller) 1 1 1 1 Report_boundary
id : Integer areas/domain : String process_category : String description : String maturity_level : Double maturity_level_desc : String
(from Boundary - User Interface)
Questionare_entity
id : Integer day : Date date : Date areas/domain : String auditor : String ref erences : String objectives : String method : String tools : String f ield_f inding : String score : Integer
insert() update() delete() select()
(from Entity - Database)
1 1
1 1
Report_entity
id : Integer areas/domain : String process_category : String description : String maturity_level : Double maturity_level_desc : String
insert() update() delete() select()
(from Entity - Database)
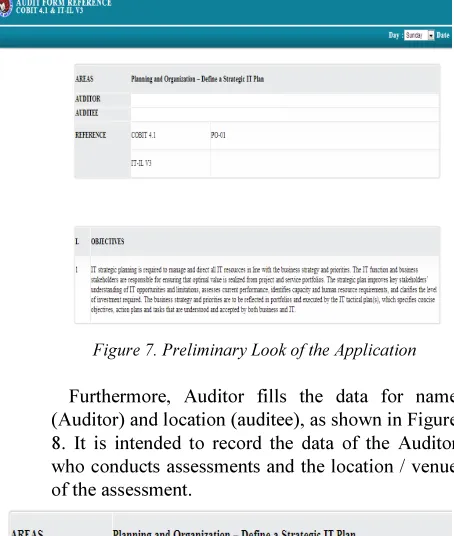
4.4. Application Layout
[image:5.595.301.531.177.317.2]The following is the layout of the application for measuring the IT governance maturity level IT on government agencies that builds upon the existing design. After doing login as a user, then the application will appear as in Figure 7. As printed Questionnaire, the application provides some information like day and date form filling. Day and date filling purpose is to know when it was last conducted an evaluative study on a particular sub-process and what the results are. The determination of the day and date is very useful to know the latest status of the evaluative study conducted.
Figure 7. Preliminary Look of the Application
Furthermore, Auditor fills the data for name (Auditor) and location (auditee), as shown in Figure 8. It is intended to record the data of the Auditor who conducts assessments and the location / venue of the assessment.
Figure 8. Auditor Name and Auditee Location
Before filling out the form, the auditor needs to read the objective of each sub-process to understand what the focus on each sub-process. Furthermore Auditor will do the assessment based on Control Objective, as shown in Figure 9. There are several methods used in conducting the audit, which are Interview and Document Check.
[image:5.595.62.289.303.571.2]Furthermore the auditor fills out the Tools or equipment used in conducting the audit and the Field Findings. After the Score is given based on COBIT 4.1 framework.
Figure 9. Form of COBIT 4.1
[image:5.595.307.547.465.570.2]To ease the examination and assessment towards each control objective or the data required by COBIT, there are guides and explanations related to the Control Objectives, Value Drivers, Risk Drivers, Control Practices and Test the Control Design as shown in Figure 10. Every time an assessment of the control objectives is made, it will require analysis and in-depth understanding of the important things that need to be assessed.
Figure 10. Explanation of Each Control Objective
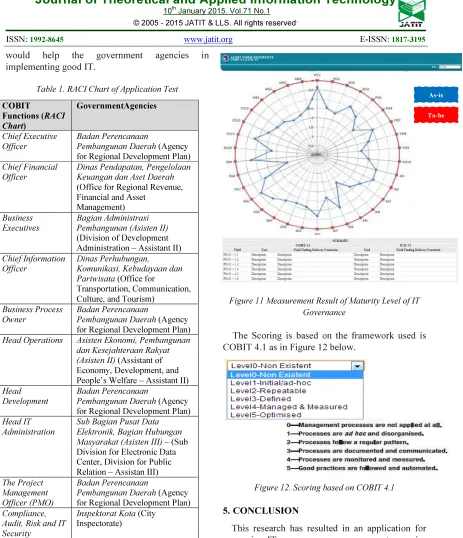
4.5.Measurement Results
The last stage of this research is to perform tests on a few government agencies in Salatiga. It is
based on the RACI chart (Responsible,
Accountable, Consulted, Informed) framework based on COBIT 4.1 as shown in Table 1 below. The result obtained in this trial is for the government agency to be able to quickly identify the level of maturity of the IT governance and at the same time the weaknesses. Therefore, this
would facilitate the preparation of the
[image:5.595.64.289.559.632.2]would help the government agencies in implementing good IT.
Table 1. RACI Chart of Application Test
COBIT
Functions (RACI
Chart)
GovernmentAgencies
Chief Executive Officer
Badan Perencanaan
Pembangunan Daerah (Agency
for Regional Development Plan)
Chief Financial Officer
Dinas Pendapatan, Pengelolaan Keuangan dan Aset Daerah
(Office for Regional Revenue, Financial and Asset
Management)
Business Executives
Bagian Administrasi Pembangunan (Asisten II)
(Division of Development Administration – Assistant II)
Chief Information Officer
Dinas Perhubungan, Komunikasi, Kebudayaan dan
Pariwisata (Office for
Transportation, Communication, Culture, and Tourism)
Business Process Owner
Badan Perencanaan
Pembangunan Daerah (Agency
for Regional Development Plan)
Head Operations Asisten Ekonomi, Pembangunan
dan Kesejahteraan Rakyat (Asisten II) (Assistant of Economy, Development, and People’s Welfare – Assistant II)
Head Development
Badan Perencanaan
Pembangunan Daerah (Agency
for Regional Development Plan)
Head IT Administration
Sub Bagian Pusat Data Elektronik, Bagian Hubungan
Masyarakat (Asisten III) – (Sub
Division for Electronic Data Center, Division for Public
Relation – Assistan III)
The Project Management Officer (PMO)
Badan Perencanaan
Pembangunan Daerah (Agency
for Regional Development Plan)
Compliance, Audit, Risk and IT Security
Inspektorat Kota (City
Inspectorate)
[image:6.595.82.545.78.616.2]The result of the assessment will look like in Figure 11 below, where the average value of the IT maturity framework based on COBIT 4.1 will be displayed. In addition to scoring, the next section is a resume or summary of the audit findings for each of the existing control objective.
Figure 11 Measurement Result of Maturity Level of IT Governance
The Scoring is based on the framework used is
COBIT 4.1 as in Figure 12 below.
Figure 12. Scoring based on COBIT 4.1
5.CONCLUSION
This research has resulted in an application for measuring IT governance on government agencies by utilizing the COBIT 4.1 framework. This application allows the measurement and self-assessment of the IT governance of relevant government agencies. The sooner a government agency could determine the level of maturity and weaknesses, the sooner the improvement for good IT governance could be applied. Good IT governance will have an impact on the services delivered to the community and in the government agency itself. Thus the efforts to improve the quality of IT-based services can be directly
As-is
[image:6.595.307.531.433.551.2]implicated in the progress of the government agency and the public in general.
REFERENCES:
[1] Pusat Teknologi Informasi dan Komunikasi, “Indikator Teknologi Informasi dan Komunikasi Tahun 2009”, 2009, Deputi Bidang Teknologi Informasi, Energi dan Material, BPPT, Jakarta.
[2] B. Hermana, A. Tarigan, H. Medyawati, W. Silfianti, “E-Government Implementation in Indonesia: Financial Transparency on the Web,” 3rd International Conference on Education, Business, Management and e-Learning IPEDR vol.27, Apr 2012, pp. 194-199.
[3] K. Surendro, “Implementasi Tata Kelola Teknologi Informasi”, 2009, Informatika, Bandung.
[4] P. Weill, J.W. Ross, “IT Governance: How Top Performers Manage IT Decision Rights for Superior Results”. Harvard Business School Press, Boston.
[5] J.J.C. Tambotoh, “Peningkatan Tingkat Kematangan Manajemen Investasi Teknologi Informasi Menggunakan Ranti’s Generic IS/IT Business Value”, Jurnal Komputer dan Informatika, Vol 9 No.1 April 2011, pp. 46-53. [6] IT Governance Institute, “COBIT 4.1
Framework: 3rd Edition”, 2008, ITGI.
[7] I. D. Hartanto, A. Tjahyanto., “Analisis Kesenjangan Tata Kelola Teknologi Informasi untuk Proses Pengelolaan Data Menggunakan COBIT (Studi Kasus Badan Pemeriksa Keuangan Republik Indonesia), 2009, Magister Manajemen Teknologi, ITS Surabaya.
![Figure 2. Inter-relation of COBIT 4.1 Domain [7]](https://thumb-us.123doks.com/thumbv2/123dok_us/8911307.959431/2.595.308.522.540.659/figure-inter-relation-cobit-domain.webp)