Assessment of auditory processing disorder in children using an adaptive filtered speech test
Natalie A. Rickarda,b,c, Uta J. Heidtkea and Greg A. O’Beirnea,c
a Department of Communication Disorders, University of Canterbury, Christchurch, New Zealand
b The Bionics Institute of Australia, Melbourne, Australia
c New Zealand Institute of Language, Brain and Behaviour, University of Canterbury, Christchurch, New Zealand
Keywords: Audiology, Auditory Processing Disorder, Speech Perception, Hearing Disorders, Speech Acoustics
Abbreviations:
4AFC: Four-alternative forced choice AAA: American Academy of Audiology APD: Auditory Processing Disorder
ASHA: American Speech-Language-Hearing Association BSA: British Society of Audiology
DDT: Dichotic digits test
DPOAE: Distortion product otoacoustic emissions FPT: Frequency pattern test
FWT: Filtered words test LPF: Low pass filter
NU-CHIPS: Northwestern University Children’s Perception of Speech Test RGDT: Random gap detection test
UCAST-FW: University of Canterbury Adaptive Speech Test – Filtered Words WUDR: weighted up/down staircase
Corresponding author: Natalie A. Rickard Bionics Institute 384-388 Albert Street, East Melbourne, VIC 3002 Australia
Phone: +61 3 9667 7500 Fax: +61 3 9667 7518
ABSTRACT
Objective: One type of test commonly used to assess Auditory Processing Disorder (APD) is the ‘filtered words test’ (FWT), in which a monaural, low-redundancy speech sample is distorted by using filtering to modify its frequency content. One limitation of the various existing FWTs is that they are performed using a constant level of low-pass filtering, making
them prone to ceiling and floor effects that compromise their efficiency and accuracy. A
recently developed computer-based test, the University of Canterbury Adaptive Speech Test
– Filtered Words (UCAST-FW), uses an adaptive procedure intended to improve the
efficiency and sensitivity of the test over its constant-level counterparts.
Design: The UCAST-FW was administered to school-aged children to investigate the ability of the test to distinguish between children with and without APD.
Study Sample: Fifteen children aged 7-13 diagnosed with APD, and an aged-matched
control group of 10 children with no history of listening difficulties.
Results: Data obtained demonstrates a significant difference between the UCAST-FW results
obtained by children with APD and those with normal auditory processing.
Conclusions: These findings provide evidence that the UCAST-FW may discriminate between children with and without APD with greater sensitivity than its constant-level
INTRODUCTION
Auditory processing disorder (APD) is generally described as a neural processing dysfunction characterized by significant listening difficulties, despite normal peripheral hearing
sensitivity. Numerous detailed descriptions or definitions of APD have been proposed over the last two decades by professional associations such as ASHA (American
Speech-Language-Hearing Association), AAA (American Academy of Audiology) and the BSA (British Society of Audiology). The various position statements generated, which differ in their conceptualization of the disorder, have stimulated vigorous debate and much-needed research regarding the underlying biological nature of APD. However, for the clinician working with children with listening difficulties, these academic debates are perhaps of less significance than are efforts made towards improving our ability to identify, quantify and remediate those listening difficulties (Dillon et al., 2012).
Currently, assessment and diagnosis of APD typically involves a behavioral test battery consisting of multiple sub-tests presumed to examine the integrity of different auditory processes. Dillon et al. (2012) argue that these tests should be organized and interpreted in a hierarchically structured fashion, to counter the statistical, fatigue and clinical efficiency problems of large test batteries. To this end, they encourage the development of new tests to enable such structured testing to take place, and to enable specific causes of listening
One type of test commonly used to assess APD is the ‘filtered words test’ (FWT) in which a monaural, low-redundancy speech sample is distorted by using filtering to restrict its
frequency content. Intelligibility of speech is optimal when the entire speech spectrum is audible. However, a typical listener is able to comprehend speech even when parts of the speech spectrum are missing (Bellis, 2003; Moore, 2006). This ability to comprehend a degraded speech signal is presumed to reflect a listener’s ability to ‘fill in the gaps’ when part of a signal is missing or partially unintelligible – a process commonly referred to as ‘auditory closure’ (Keith, 2000; Bellis, 2003). Numerous studies have indicated that this ability may be impaired in children with auditory processing deficits, supporting the applicability of low-pass FWTs in the assessment of APD in children ( Martin & Clark, 1977; Willeford, 1977; Farrer & Keith, 1981; Dempsey, 1983; Bornstein et al., 1994; Keith, 2000). The objective in many of these studies was to determine an appropriate cut-off frequency enabling separation of children with auditory processing difficulties from children with normal auditory
The purpose of the present study was to counter these shortcomings by using an adaptive procedure in which the degree of difficulty of a test item is adjusted based on the subject’s previous responses (Leek, 2001). The University of Canterbury Adaptive Speech Test – Filtered Words (UCAST-FW) is a computer-based adaptive low-pass filtered speech test designed to improve the efficiency and sensitivity of the test over its constant-level
counterparts (O’Beirne et al., 2012). Instead of examining a child’s performance at a set filter level, the UCAST-FW provides information on the degree of redundancy in the speech signal that is required by the subject in order to make a correct response (Leek, 2001). Adaptive procedures are also efficient, as presentation levels quickly approach the subject’s threshold, thereby minimizing the influence of fatigue, loss of attention and motivation on test
performance (Zera, 2004). The primary goal of this study was to investigate the ability of the UCAST-FW to distinguish between children with and without APD, and to examine the correlation between the required acoustic bandwidth (‘UCAST-FW score’) and other accepted measures of auditory processing ability. It was hypothesized that as a group, children with APD would require a significantly wider band of frequencies present in a speech signal (i.e. a higher UCAST-FW score) compared to control children in order to comprehend a monosyllabic speech signal.
METHOD
Participants
Experimental Group: Children with suspected APD
A group of eighteen (18) children with suspected APD were recruited through the Speech and Hearing Clinic at the University of Canterbury. The gender distribution of the experimental group children was 78% (n=14) male and 22% (n= 4) female. The age range of the
experimental group was 7 years 11 months to 12 years 11 months, with an average age of 9 years 4 months.
Control Group: Children without auditory processing difficulties
A control group of ten (10) children without known auditory processing or learning
difficulties were recruited from local primary schools. The control participants were matched to the experimental group participants by age and gender as closely as possible. The gender distribution of the control children was 90% (n=9) male and 10% (n= 1) female. The age range of the control group was 8 years 3 months to 11 years 3 months, with an average age of 9 years 4 months.
All participants in both groups used English as their first language, had normal peripheral hearing (see Results section), and had adequate visual and motor skills to participate in a touch-screen based assessment.
Peripheral audiometric assessment
All audiometric assessment took place in a double-walled, sound-treated room at the
changer was used to administer pure-tone and speech audiometry. Speech perception was tested monaurally by presenting a New Zealand recording of meaningful consonant-vowel-consonant (CVC) word lists to each ear individually. A GSI TympStar – Middle Ear Analyzer was used for tympanometry and acoustic reflex recording. Distortion product otoacoustic emissions (DPOAEs) between 1500-6000 Hz were measured with either a Scout® Sport (Bio-logic® System Group) or a Madsen Capella (GN Otometrics Ltd.). Acoustic reflexes and DPOAEs were recorded at the end of each test session, following completion of the APD test battery. All procedures were carried out following standard audiological protocols (New Zealand Audiological Society, 2008).
Auditory processing assessment
The APD test battery consisted of 4 tests. Three of these - the Dichotic Digits Test Version 2 (Musiek, 1983), the Frequency Pattern Test (Musiek, 1994), and the Random Gap Detection Test (Keith, 2000), were administered in accordance with standard clinical recommendations (ASHA, 2005). Stimuli were presented at 50 dB SL relative to the 1000 Hz pure tone
fourth test was the filtered words subtest of the SCAN-C, a commercially available fixed-frequency low-pass filtered words test, which was scored in accordance with the manual provided in the test kit to produce an age-equivalent standard score for each participant. These were then converted to a normative classification of ‘normal’, ‘borderline’ or ‘abnormal’ according to the SCAN-C test manual.
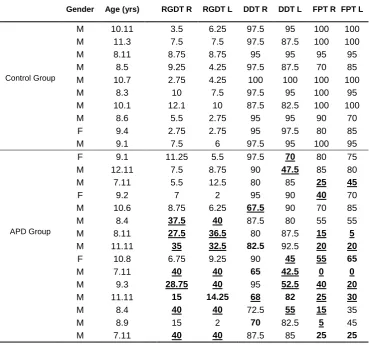
Table 1. Individual APD test results for all participants.
Gender Age (yrs) RGDT R RGDT L DDT R DDT L FPT R FPT L
M 10.11 3.5 6.25 97.5 95 100 100
M 11.3 7.5 7.5 97.5 87.5 100 100
M 8.11 8.75 8.75 95 95 95 95
M 8.5 9.25 4.25 97.5 87.5 70 85
Control Group M 10.7 2.75 4.25 100 100 100 100
M 8.3 10 7.5 97.5 95 100 95
M 10.1 12.1 10 87.5 82.5 100 100
M 8.6 5.5 2.75 95 95 90 70
F 9.4 2.75 2.75 95 97.5 80 85
M 9.1 7.5 6 97.5 95 100 95
F 9.1 11.25 5.5 97.5 70 80 75
M 12.11 7.5 8.75 90 47.5 85 80
M 7.11 5.5 12.5 80 85 25 45
F 9.2 7 2 95 90 40 70
M 10.6 8.75 6.25 67.5 90 70 85
M 8.4 37.5 40 87.5 80 55 55
APD Group M 8.11 27.5 36.5 80 87.5 15 5
M 11.11 35 32.5 82.5 92.5 20 20
F 10.8 6.75 9.25 90 45 55 65
M 7.11 40 40 65 42.5 0 0
M 9.3 28.75 40 95 52.5 40 20
M 11.11 15 14.25 68 82 25 30
M 8.4 40 40 72.5 55 15 35
M 8.9 15 2 70 82.5 5 45
M 7.11 40 40 87.5 85 25 25
A total of 15 of the 18 children in the experimental group were diagnosed with APD for the purposes of this study, as defined above, and are referred to as the APD group. The remaining 3 experimental group participants were excluded from further analysis. Test order and ear order was randomized. Participants were given breaks throughout the session, and efforts were made on the part of the experimenters to minimize fatigue and maximize motivation during the testing.
The UCAST-FW
The UCAST-FW was developed by one of the authors (G.O’B.) using National Instruments LabVIEW 8.20. The UCAST-FW protocol and parameter settings used in the current study were adapted from the findings of O’Beirne et al. (2012) and Sincock (2008). A weighted up/down staircase (WUDR) adaptive algorithm (Kaernbach, 1991) was used, which applies different sized steps for increases and decreases in stimuli presentation level. As the UCAST-FW is a four-alternative forced choice (4AFC) test, the midpoint of the psychometric function is the 62.5% correct point, as this is halfway between the maximum score of 100% and the chance score of 25%.
Equation 1 below is modified from that of Kaernbach (1991), and defines the equilibrium conditions for convergence on a point using the weighted staircase rule for the calculation of a 62.5% correct threshold level (X62.5):
Sdown p = Sup (1-p) [1]
frequency of a 6th-order Butterworth low-pass filter (LPF), rather than a stimulus amplitude level, and so the LPF cut-off frequency was decreased by 0.6 of a step after each correct response, and increased by 1 step after each incorrect response. Two different step size variations, referred to as initial and working increments/decrements were employed. The larger initial step sizes meant that threshold could be approached more rapidly, while the smaller working step sizes helped determine the threshold more precisely. Using both step sizes thereby improved both the accuracy and efficiency of the adaptive filtered speech test. The initial increment and decrement step sizes were set at 20.83% and 12.5% respectively; the working increment and decrement step sizes were set at 8.33% and 5%. A reversal occurred when a correct response followed one or more incorrect responses, or vice versa. The transition between the initial and working step phase occurred after five such reversals. The endpoint of the test was reached when a total of 25 reversals had been made – five reversals within the initial phase with larger step sizes, and 20 within the working step phase with smaller step sizes. The 62.5% threshold was obtained by calculating the geometric average of the midpoints between each reversal within the working step phase only. A starting LPF corner frequency of 1000 Hz was used as the initial level at which the stimuli were filtered, based on the findings of McGaffin (2007).
Laboratories, Chatswood, NSW, Australia). The UCAST-FW software recorded client details and all acquisition data (including number of trials, low-pass filter corner frequency,
responses, confidence intervals, provisional and final threshold estimates) to tab-delimited text files.
Calibration
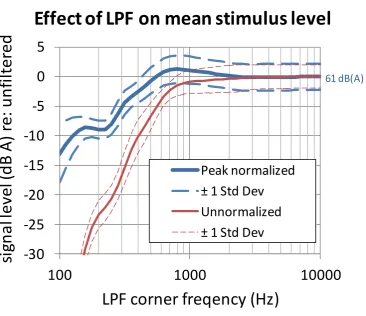
The UCAST-FW was run on a notebook computer (Compaq NX6120) and the speech stimuli were presented through Sennheiser HD 215 supra-aural headphones driven by an InSync Buddy USB 6G soundcard. Low-pass filtering within the audible frequency range removes energy from the output signal, resulting in an effective change in stimulus sound pressure level as a function of LPF cut-off frequency. As shown in Figure 1, this was counteracted by applying a simple peak normalization process to the digital waveform after filtering (the waveform was multiplied by a value that resulted in its highest magnitude sample value being the maximum possible). To quantify this gain adjustment post-hoc, the Sennheiser
Figure 1. While the low-pass filter caused a reduction in stimulus level with decreasing corner frequency, the peak normalization process halved the variation in stimulus level between participants at their 62.5% correct thresholds to a maximum of 10 dB (i.e. between a peak of 62 dB A for UCAST-FW scores around 850 Hz, and 52 dB A for the participants with the lowest UCAST-FW scores). The mean presentation level at threshold for all participants was 60 ± 2.7 dB A.
Procedure
All testing took place in a sound treated booth at the University of Canterbury Speech and Hearing Clinic. An external ELO ET1715L 17" touch screen monitor (Tyco Electronics Corp., USA), connected to the notebook computer was used to present the NU-CHIPS
-30
-25
-20
-15
-10
-5
0
5
100
1000
10000
si
gn
al
lev
el
(d
B
A
)
re:
u
n
fi
lter
ed
LPF corner freqency (Hz)
Effect of LPF on mean stimulus level
Peak normalized
± 1 Std Dev
Unnormalized
± 1 Std Dev
response plates to the participants (scanned from the original test manual), and to receive their responses, which were automatically recorded by the UCAST-FW software.
In order to allow for the significant learning effect observed in a prior study using the
UCAST-FW (O'Beirne et al., 2012), a binaural practice run was incorporated into the current protocol. Following the practice run (which consisted of a random selection of NU-CHIPS test items from among the 200 possibilities), left and right ears were tested individually in random order, and the NU-CHIPS word list presented was selected in random order from among the four available (Book A, lists 1 and 2; Book B, lists 1 and 2). As each word was presented acoustically via headphones, four images were presented on the touchscreen, one of which matched the auditory stimulus. No carrier phrase was presented. The participant was instructed to touch the image which matched the word they heard. There was a 1.5 second pause between the participant entering their response and the presentation of the next
Analysis
All data were analysed using SigmaPlot for Windows version 11.0. (Systat Software Inc). Where appropriate, differences between groups or measures were evaluated using a two-way repeated measures analysis of variance (ANOVA). A significance level of p < 0.05 was used. Pearson Product Moment Correlation coefficients (r values) were used to compare the
UCAST-FW against the various sub-tests of the APD test battery. Percentage scores (for the DDT and FPT) were arcsine transformed prior to performing the correlations, to generate a more normal distribution of the data. All results are given as mean +/- standard error of the mean (SEM).
RESULTS
Audiometric results
All participants had hearing threshold levels within normal limits (i.e. no greater than 25 dB HL at any frequency tested), with average hearing levels (500, 1000, 2000, 4000Hz) of < 20 dB HL for each participant. Speech audiometry revealed normal speech recognition
threshold levels were all within the normal range. The majority of participants had ipsilateral and contralateral acoustic reflexes at 500, 1000, 2000 and 4000 Hz, however not all
frequencies could be tested in all participants due to intolerance of the test stimuli. One participant in the APD group had absent ipsilateral and contralateral acoustic reflexes across all test frequencies. Subsequent clinical follow-up showed normal auditory brainstem responses in this participant (data not shown). Distortion product otoacoustic emissions (DPOAE) for all participants, tested across frequencies 1.5 kHz to 6 kHz, yielded an average test result of a signaltonoise ratio of > 5 dB and an absolute amplitude of the emission of > -10 dB SPL.
APD test battery
a) Temporal Acuity: Random Gap Detection Test (RGDT)
Gap detection thresholds were recorded in milliseconds. All control participants passed the RGDT; of the 15 APD participants eight (n=8) failed and seven (n=7) passed the RGDT. Four (n=4) APD participants were given arbitrary scores of 40 ms. This value, the largest inter-stimulus interval used in the standard version of the RGDT, was allocated to these participants for the purposes of data analysis. However, it should be noted that these participants were not able to discriminate two tones at this inter-stimulus interval, and their true gap detection threshold may have been much higher. Further exploration of actual gap detection threshold was not carried out in this study, where a pass/fail result on the RGDT was all that was required in order to classify participants into groups.
b) Dichotic Digits Test (DDT)
c) Frequency Pattern Test (FPT)
FPT test results were recorded as percentage correct for each ear. All control participants passed the FPT; eleven (n=11) APD participants failed the FPT.
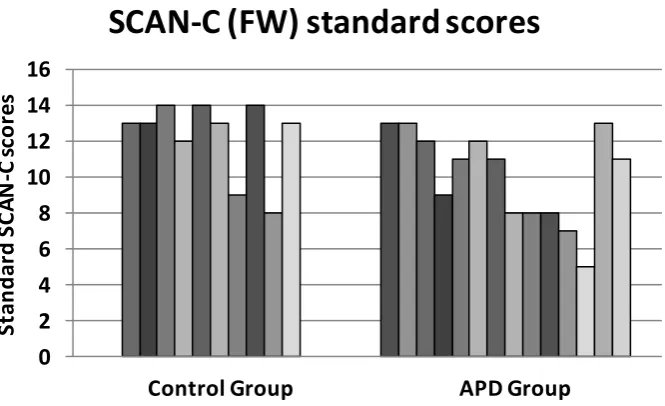
d) SCAN-C Filtered Words Subtest (SCAN-C FW)
Results were recorded as standard subtest scores. As will be discussed below, all participants from both groups were classified as ‘normal’ on the SCAN-C (FW), apart from one
participant from the APD group who was classified as ‘borderline’.
UCAST-FW results
The mean WUDR thresholds for each monaural presentation were calculated, referred to henceforth as the ‘UCAST-FW Score’. This score indicates the cut-off frequency at which the participants scored 62.5% correct on the psychometric function, following 20 reversals at the working increment. For the control group, the mean UCAST-FW score (± SEM) for the right ear was 381.7 Hz (± 41.3), and for the left ear 393.0 Hz (± 40.9). In contrast, the APD group participants yielded a mean UCAST-FW score of 752.3 Hz (± 84.4) for the right ear, and 777.8 Hz (± 96.6) for the left ear.
Figure 2. Shown are the mean UCAST-FW scores (following 20 reversals at the working increment) for the right and left ears for Control and APD groups. Standard error bars are shown. Means that are labeled with different letters differ significantly at the 0.05 level.
Figure 3 illustrates the spread of the data by displaying the mean UCAST-FW score for each ear for each individual participant in the control and APD Groups.
128
256
512 1024
2048
Control Group APD Group
LP
F
cu
t-o
ff
fr
eq
u
en
cy
(H
z)
UCAST-FW mean scores
Right ear Left ear
Figure 3. Individual mean UCAST-FW scores (following 20 reversals at the working increment) for Control and APD group participants. The dashed lines indicate the mean Control group UCAST-FW score, and two standard deviations outside that mean.
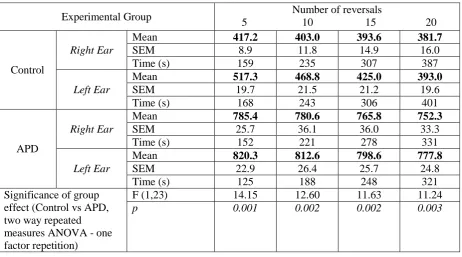
Figure 4 shows representative UCAST-FW adaptive tracks from three control and three APD group participants. It can be seen from these examples that the mean UCAST-FW score for APD group participants was higher than for the control participants, and that in both groups, the tracks remained steady throughout the duration of the test once a plateau was reached. It can also be seen that the 99% confidence intervals, calculated on log-transformed data and displayed in Hz, were generally similar in both control and APD participants. The stability of the UCAST-FW scores throughout test administration is also illustrated in Table 2, where UCAST-FW scores and standard errors of the mean (SEM) are shown for several points along each adaptive track – at 5, 10, 15 and 20 reversals. It can be seen that the UCAST-FW score generally remains steady or improves slightly (becomes lower) as test length increases, and the difference between groups is significant at each sampled point along the track. In
128
256 512 1024
2048
Control Group APD Group
LP
F
cu
t-o
ff
fr
eq
u
en
cy
(H
z)
Individual UCAST-FW scores
most cases, the SEM at the 20 reversal time point is slightly larger than at the 5 reversal time point, indicating slightly larger excursions about the mean as test length increases and cut-off frequency decreases.
Table 2. A comparison of the mean UCAST-FW Score at several points along each adaptive track – 5, 10, 15 and 20 reversals at the working increment – for Control and APD group participants, left and right ears. The standard error of the mean (SEM), coefficient of variation (CV) and average time taken are shown for each point along the track, as is the statistical significance of the group effect.
Experimental Group 5 10 15 20 Number of reversals
Control
Right Ear
Mean 417.2 403.0 393.6 381.7
SEM 8.9 11.8 14.9 16.0 Time (s) 159 235 307 387
Left Ear
Mean 517.3 468.8 425.0 393.0
SEM 19.7 21.5 21.2 19.6 Time (s) 168 243 306 401
APD
Right Ear
Mean 785.4 780.6 765.8 752.3
SEM 25.7 36.1 36.0 33.3 Time (s) 152 221 278 331
Left Ear
Mean 820.3 812.6 798.6 777.8
SEM 22.9 26.4 25.7 24.8 Time (s) 125 188 248 321 Significance of group
effect (Control vs APD, two way repeated measures ANOVA - one factor repetition)
F (1,23) 14.15 12.60 11.63 11.24
p 0.001 0.002 0.002 0.003
Scan-C Filtered Words Test
Figure 5. Individual SCAN-C (FW) standard scores for APD Group and Control Group (CG). Each column indicates the SCAN-C (FW) standard score which is based on an average score for right and left ear presentation.
Correlations between test results
To examine the correlation between the UCAST-FW and each subtest of the APD test battery, Pearson Product Moment Correlation coefficients (r values) were calculated and the results plotted as shown in Figure 6. Correlation and p values are shown on Figure 6. Strong and statistically significant correlations were evident between the UCAST-FW and the
RGDT for both ears; between the UCAST-FW and the arcsine transformed DDT scores in the right ear only; and between the UCAST-FW and the arcsine transformed FPT scores for both ears. A moderate correlation was evident between the UCAST-FW and the raw SCAN-C scores for both ears.
0
2 4
6 8 10 12
14 16
Control Group APD Group
St
an
d
ar
d
S
C
A
N
-C
s
co
re
s
Figure 6. UCAST-FW scores plotted against the scores for each subtest of the traditional APD test battery for right and left ears for all participants.
r = -0.315 p > 0.05 0
5 10 15 20
256 512 1024 2048
UCAST-FW LPF (Hz)
r = -0.256 p > 0.05 0 20 40 60 80 100
256 512 1024 2048
r = -0.537 p < 0.001
0 20 40 60 80 100
256 512 1024 2048
r = -0.356 p > 0.05 0
5 10 15 20
256 512 1024 2048
Ra w SC A N -C
UCAST-FW LPF (Hz)
r = -0.526 p < 0.001
0 20 40 60 80 100
256 512 1024 2048
FP
T
%
r = 0.737 p < 0.001 0 10 20 30 40 50
256 512 1024 2048
RG
D
T
(m
s)
r = 0.736 p < 0.001 0 10 20 30 40 50
256 512 1024 2048
r = -0.509 p < 0.001 0 20 40 60 80 100
256 512 1024 2048
D
D
T
%
UCAST-FW vs SCAN-C
UCAST-FW vs DDT
UCAST-FW vs FPT
UCAST-FW vs RGDT
DISCUSSION
This study examined the ability of the UCAST-FW, an adaptive filtered speech test, to
distinguish between children with and without APD. It was hypothesized that performance on the UCAST-FW would be significantly different in those children who failed the APD test battery compared to typically developing control children. This hypothesis was supported by the data which showed that children with APD required a significantly wider band of
frequencies present in a speech signal (i.e. a higher UCAST-FW score) compared to control children in order to score 62.5% of words correct. This implies that compared to control children, children with APD are less able to understand speech when high frequency information is removed from the speech signal.
Why do children with APD appear to need a wider band of frequencies present in the speech signal in order to understand that signal? This finding may reflect so-called stimulus driven or ‘bottom-up’ temporal processing deficits or ‘top-down’ processing deficits in cognition, language or memory; or it may reflect a combination of the two. There are at least two broad reasons why a child may perform poorly on a filtered speech test: either the child extracts less information than other children from the sounds presented to them (due, for example, to reduced temporal resolution); or the child extracts the same information as other children but is less able to deduce the target word based on the restricted information he or she has
A strong positive correlation in this study was found between performance on the
UCAST-FW and performance on the RGDT, a non-speech based test of temporal processing, suggesting that participants who perform poorly on the UCAST-FW are more likely to have temporal processing difficulties. Over half of all APD Group participants in this study (n=8; 53%) failed the RGDT and those subjects with the highest (i.e. worst) UCAST-FW scores were also those subjects with the longest gap-detection thresholds. All participants with UCAST-FW scores over 900 Hz failed the RGDT binaurally. Speech recognition involves the use of multiple cues, both spectral and temporal, in the speech signal (Shannon et al., 1995; Xu et al., 2005; Souza et al., 2011). Low pass filtering a speech signal removes high frequency spectral information, which negatively impacts on speech understanding
(Bornstein et al., 1994; Ardoint & Lorenzi, 2010) . As such spectral cues are progressively removed by low pass filtering, a listener may become increasingly dependent on remaining temporal cues for speech recognition (Shannon et al., 1995). Temporal processing
difficulties may therefore result in a greater reliance on robust spectral information for speech understanding (Pichora-Fuller & Souza, 2003).
A deficit in temporal resolution or discrimination skills has been shown to be related to phonological processing deficits and receptive language and reading skills (Tallal et al., 1997; Rawood, 2006). However, there is some debate regarding the specific relationship between temporal processing deficits and language disorders (Hartley et al., 2003; Rosen, 2003). Regardless of whether temporal processing deficits are causative of language disorders, it is likely that both temporal processing and language skills may be necessary for good
performance on the UCAST-FW. Children with deficits in either ability may require a wider band of frequencies present in order to achieve a score of 62.5% correct on the UCAST-FW.
attention played no part in test performance: the standard errors shown in Table 2 indicate that variation in performance was slightly higher in the APD group compared to the control group throughout the test, suggesting that the excursions about the mean were slightly larger in children with APD. In addition the standard errors tended to grow slightly larger,
indicating greater fluctuations about the mean, as the test length was extended. This suggests that the results may have been influenced by the effects of fatigue or wandering attention as the test progressed. Importantly however, the mean UCAST-FW scores were found to decrease slightly as the test progressed in both groups, as shown by both Figure 4 (individual data) and Table 2 (averaged data). This suggests that despite the slight increase in SEM over time, the high WUDR threshold scores obtained in children with APD were not simply artifacts of diminishing attention during test administration. If this were the case, one would expect their WUDR thresholds to worsen as test length extends. As shown in Table 2, the significant group effect was evident at each sampled point throughout the test, not just after 20 reversals at the working increment. Moreover, the full test took approximately 6 minutes to complete, whereas stopping the test after just 5 working reversals would have taken approximately 2-3 minutes. Future research with a larger sample size will help to determine the optimal compromise between test length, accuracy and sensitivity/specificity.
the link therefore remains speculative at this time. The large correlation between the
UCAST-FW and the FPT may reflect an overlap in the underlying auditory function each test assesses (temporal processing skills) or, it may simply be that children with APD tend to do poorly on both tests, reflecting a common fundamental underlying deficit in working memory or other amodal processes. Indeed, a large negative correlation was also found between the UCAST-FW and the DDT scores for the right ear in this study; a similar trend, albeit not statistically significant, was seen for the left ear. In general, those children who performed poorly on the UCAST-FW also tended to perform poorly on the DDT. The DDT is a test of binaural integration, presumed to assess inter-hemispheric transfer of information and short-term auditory memory storage and retrieval (Keith & Anderson, 2007; Musiek & Chermak, 2007). Difficulties hearing in background noise or in the presence of a competing speaker are associated with low performance on dichotic listening tasks (Musiek, 1983); presumably, those children who tend to perform poorly on the DDT are likely to be children who also have difficulty understanding a distorted speech signal.
obtained mean scores above 1000 Hz on the UCAST-FW, and all passed the SCAN-C (FW) based on provided norms (Keith, 2000), apart from one participant who had a ‘borderline’ result. This clearly demonstrates the significant advantages of employing an adaptive algorithm in a filtered speech test, making the test less prone to floor and ceiling effects.
tool that helps to better define the specific nature of an individual’s listening difficulty. Including the UCAST-FW in a structured APD test battery may help to identify those
individuals for whom understanding distorted speech signals is a particular area of difficulty, as opposed to other forms of auditory processing difficulty.
This comparison suggests that at least for this particular cohort of participants, the ability of the SCAN-C (FW) to discriminate between children with and without APD was significantly poorer than the UCAST-FW, when a ‘working pass/fail criterion’ is applied.
The current study has demonstrated that the UCAST-FW, a computer-based adaptive filtered speech test, discriminated between children with and without APD on a group basis with good specificity and sensitivity, based on a ‘working pass/fail criterion’ and a comparison with a traditional APD test battery. The results demonstrate that the UCAST-FW is a potentially useful addition to a clinical APD test battery and has several advantages over its constant-stimuli non-interactive counterparts. Future research involving a large sample of typically developing children is needed to establish age-appropriate and ear specific normative data for the UCAST-FW, and to examine its test/retest reliability. In addition, a word list consisting of phonemically balanced New Zealand English speech tokens and corresponding pictures is currently under development.
ACKNOWLEDGMENTS
DECLARATION OF INTEREST
The authors would like to thank GN ReSound (NZ) Ltd. for financial assistance to UJH.
REFERENCES
Ardoint M. & Lorenzi C. 2010. Effects of lowpass and highpass filtering on the intelligibility of speech based on temporal fine structure or envelope cues. Hear Res, 260, 89-95.
American Speech-Language-Hearing Association 2005. Technical report: (Central) Auditory Processing Disorders. Working Group on Auditory Processing Disorders. Retrieved from http://www.asha.org/docs/html/TR2005-00043.html
Bellis T.J. 2003. Assessment and management of central auditory processing disorders in the educational setting. From science to practice (2nd ed.). Clifton Park, NY: Delmar Learning.
Bornstein S.P., Wilson R.H. & Cambron N.K. 1994. Low- and high-pass filtered Northwestern University Auditory Test No. 6 for monaural and binaural evaluation. J Am Acad Audiol, 5, 259-264.
Cacace A.T. & McFarland D., J. 2005. The importance of modality specificity in diagnosing central auditory processing disorder. Am J Audiol, 14, 112-123.
Dillon H., Cameron S., Glyde H., Wilson W. & Tomlin D. 2012. An opinion on the assessment of people who may have an auditory processing disorder. J Am Acad Audiol, 23, 97-105.
Elliott L.L. & Katz D. 1980. Development of a new children's test of speech discrimination (technical manual). St. Louis, MO: Auditec.
Farrer S.M. & Keith R.W. 1981. Filtered word testing in the assessment of children's central auditory abilities. Ear Hear 2, 267-269.
Hartley D.E.H., Hill P.R. & Moore D.R. 2003. The auditory basis of language impairments: temporal processing versus processing efficiency hypotheses. Int J Pediatr Otorhinolaryngol, 67, S137-S142.
Kaernbach C. 1991. Simple adaptive testing with the weighted updown method. Percept & Psychophys, 49, 227-229.
Keith R. & Anderson J. 2007. Dichotic listening tests. In: F.E. Musiek & G.D. Chermak (eds.) Handbook of (central) auditory processing disorder. Auditory neuroscience and diagnosis. San Diego: Plural Publishing, pp. 207-230.
Keith R.W. 2000. Development and standardization of SCAN-C Test for Auditory Processing Disorders in Children. J Am Acad Audiol, 11, 438-445.
Keith R.W. 2000. Scan-C Test for Auditory Processing Disorders in Children - Revised. San Antonio, TX: Psychological Corporation.
Kelly A. 2007. Normative data for behavioural tests of auditory processing for New Zealand school children aged 7 to 12 years. The Australian and New Zealand Journal of Audiology, 29, 60-64.
Leek M. 2001. Adaptive procedures in psychophysical research. Percept & Psychophys, 63, 1279-1292.
Martin F.N. & Clark J.G. 1977. Audiologic detection of auditory processing in children. J Am Audiol Soc, 3, 140-146.
McGaffin A. 2007. Development of a monosyllabic adaptive speech test for the identification of central auditory processing disorder. Unpublished Thesis, University of Canterbury, Christchurch, NZ, http://hdl.handle.net/10092/1504
Moore D.R. 2006. Auditory processing disorder (APD): definition, diagnosis, neural basis, and intervention. Audiol Med, 4, 4-11.
Moore D.R., Halliday L.F. & Amitay S. 2009. Use of auditory learning to manage listening problems in children. Philos Trans R Soc Lond B Biol Sci., 364, 409-420.
Musiek F.E. 1983. Assessment of central auditory dysfunction: the dichotic digit test revisited. Ear Hear, 4, 79-83.
Musiek F.E. 1994. Frequency (pitch) and duration pattern tests. J Am Acad Audiol, 5, 265-268.
Musiek F.E., Bellis T.J. & Chermak G.D. 2005. Nonmodularity of the central auditory nervous system: implications for (central) auditory processing disorder. Am J Audiol, 14, 128-138.
Musiek F.E. & Chermak G.D. 2007. Handbook of (central) auditory processing disorder. Auditory neuroscience and diagnosis. San Diego: Plural Publishing.
New Zealand Audiological Society 2008. Best Practice Guidelines. New Zealand.
O'Beirne G.A., McGaffin A.J. & Rickard N.A. 2012. Development of an adaptive low-pass filtered speech test for the identification of auditory processing disorders. Int J Pediatr Otorhinolaryngol, 76, 777-782.
Rawood V.W. 2006. A temporal processing primer. Part 1. Defining key concepts in temporal processing. Hearing Review, 13, 30-34.
Rosen S. 2003. Auditory processing in dyslexia and specific language impairment: is there a deficit? What is its nature? Does it explain anything? . J Phon, 31, 509-527.
Shannon R.V., Zeng F.G., Kamath V., Wygonski J. & Ekelid M. 1995. Speech recognition with primarily temporal cues. Science, 270, 303-304.
Sharma M., Purdy S.C. & Kelly A.S. 2009. Comorbidity of auditory processing, language, and reading disorders. J Speech Lang Hear Res, 52, 706-722.
Sincock B.P. 2008. Clinical applicability of adaptive speech testing: a comparison of the administration time, accuracy, efficiency and reliability of adaptive speech tests with conventional speech audiometry. Unpublished Thesis, University of Canterbury, Christchurch, NZ, http://hdl.handle.net/10092/2157
Souza P., Arehart K., Miller C.W. & Muralimanohar R.K. 2011. Effects of age on F0 discrimination and intonation perception in simulated electric and electroacoustic hearing. Ear Hear, 32, 75-83.
van Wieringen A. & Pohls L.C.W. 1995. Discrimination of single and complex consonant-vowel- and consonant-vowel-consonant-like formant transitions. J Acoust Soc Am, 98, 1304-1312.
Willeford J.A. 1977. Assessing central auditory behaviour in children: A test battery approach. In: R.W. Keith (ed.) Central auditory dysfunction. New York: Grune and Stratton, pp. 43-72.
Xu L., Thompson C.S. & Pfingst B.E. 2005. Relative contributions of spectral and temporal cues for phoneme recognition. J Acoust Soc Am, 117, 3255-3267.