http://www.scirp.org/journal/acs ISSN Online: 2160-0422
ISSN Print: 2160-0414
DOI: 10.4236/acs.2017.74038 Oct. 13, 2017 525 Atmospheric and Climate Sciences
Spatial and Temporal Analysis of Rainfall and
Temperature Extreme Indices in Tanzania
Ladislaus B. Chang’a
*, Agnes L. Kijazi, Philbert M. Luhunga, Hashim K. Ng’ongolo,
Habiba I. Mtongori
Tanzania Meteorological Agency, Research Section, Dar es Salaam, Tanzania
Abstract
Climate extreme indices in Tanzania for the period 1961-2015 are analyzed using quality controlled daily rainfall, maximum and minimum temperatures data. RClimdex and National Climate Monitoring Products (NCMP) software developed by the commission for climatology of the World Meteorological Organization (WMO) were used for the computation of the indices at the re-spective stations at monthly and annual time scales. The trends of the extreme indices averaged over the country were computed and tested for statistical significance. Results showed a widespread statistical significant increase in temperature extremes consistent with global warming patterns. On average, the annual timescale indicate that mean temperature anomaly has increased by 0.69˚C, mean percentage of warm days has increased by 9.37%, and mean percentage of warm nights has increased by 12.05%. Mean percentage of cold days and nights have decreased by 7.64% and 10.00% respectively. A non-statistical significance decreasing trends in rainfall is depicted in large parts of the country. Increasing trend in percentage of warm days and warm nights is mostly depicted over the eastern parts of the country including areas around Kilimanjaro, Dar-es-Salaam, Zanzibar, Mtwara, and Mbeya regions. Some parts of the Lake Victoria Basin are also characterized by increasing trend of warm days and warm nights. However, non-statistical significant de-creasing trends in the percentage of warm days and warm nights are depicted in the western parts of the country including Tabora and Kigoma regions and western side of the lake Victoria. These results indicate a clear dipole pattern in temperature dynamics between the eastern side of the country mainly fluenced by the Indian Ocean and the western side of the country largely in-fluenced by the moist Congo air mass associated with westerly winds. The re-sults also indicate that days and nights are both getting warmer, though, the warming trend is much faster in the minimum temperature than maximum temperature.
How to cite this paper: Chang’a, L.B., Kija-zi, A.L., Luhunga, P.M., Ng’ongolo, H.K. and Mtongori, H.I. (2017) Spatial and Temporal Analysis of Rainfall and Temperature Ex-treme Indices in Tanzania. Atmospheric and Climate Sciences, 7, 525-539.
https://doi.org/10.4236/acs.2017.74038
Received: September 8, 2017 Accepted: October 10, 2017 Published: October 13, 2017 Copyright © 2017 by authors and Scientific Research Publishing Inc. This work is licensed under the Creative Commons Attribution International License (CC BY 4.0).
DOI: 10.4236/acs.2017.74038 526 Atmospheric and Climate Sciences
Keywords
Tanzania, Climate Extreme Indices, Temperature trends, Rainfall trends, NCMP
1. Introduction
Hydro-meteorological related disasters, particularly from climate extremes are responsible for about 90% of all global natural disasters [1]. Changes in many extreme weather and climate events have been observed since 1950 [2][3][4]. The frequency and magnitude of climate extremes including droughts, floods and heat waves have been found to increase on global scale, and have signifi-cantly contributed to the loss of life and properties and severe infrastructure damages in various parts of the world [5][6][7]. Recent IPCC reports [2][3][4] confirm that it is very likely that there has been an overall decrease in the num-ber of cold days and cold nights, and an overall increase in the numnum-ber of warm days and warm nights. The frequency of heavy precipitation is likely to increase in the 21st century over many areas of the globe, while there is medium confi-dence that droughts will intensify in some areas due to reduced precipitation and/or increased evapotranspiration [2].
Over the last few decades most parts of Tanzania have experienced an in-creased incidence of extreme climatic events, particularly floods and droughts that have been associated with severe socio-economic and ecological implica-tions. The most recent severe floods include those of 2006, 2009, 2010, 2011, 2012, 2014, 2016 and 2017 that affected many parts of the country associated with many fatalities including loss of life and severe infrastructural destructions [8][9]. The country has also experienced severe and recurrent droughts, which have caused devastating impacts, particularly in agriculture, water, energy and livestock sectors, and thus paralyzing socio-economic activities and develop-ment. The most recent devastating droughts include those of 2003, 2005, 2011, 2014 and 2016 [10].
DOI: 10.4236/acs.2017.74038 527 Atmospheric and Climate Sciences food security, and ending abject poverty by 2025. Successful achievement of these goals requires effective plans and strategies to enhance and sustain produc-tion and productivity, particularly in agricultural and livestock sectors in the context of increasing frequency and magnitude of climate extremes.
For most of the developing countries including Tanzania of which so-cio-economic development and livelihoods are strongly linked to their depen-dencies on natural resources and rain-fed agriculture, Initiatives and efforts to-wards poverty eradication and reaching zero hunger are significantly affected by the trends and patterns of climate extremes. Unfortunately, extreme events are projected to increase and will continue to have greater impacts, particularly on climate sensitive sectors such as water, health, forestry, agriculture and food se-curity.
Understanding the spatial and temporal patterns of rainfall and temperature related extremes is therefore pre-requisite and a critical inputs for effective de-signing and implementing coping and adaptation options to the impacts of cli-mate change. This study provides a current understanding of the countrywide trends of rainfall and temperature related extreme indices. The trends in the percentage change in rainfall, anomaly, percentage change in number of warm days and warm nights, percentage change in number of cold days and cold nights, and trends in Standardized Precipitation Index (SPI) are analyzed and presented.
2. Description of the Study Area
DOI: 10.4236/acs.2017.74038 528 Atmospheric and Climate Sciences to the end of April. The Bimodal and Unimodal rainfall patterns are mainly asso-ciated with the southward and northward movement of the ITCZ. Most of the rainfall, especially during October to February is convective in nature and dis-tinctly organized.
3. Data and Methodology
3.1. Data
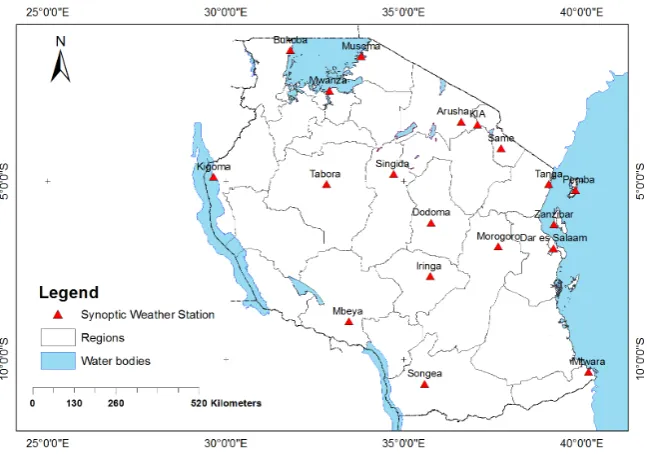
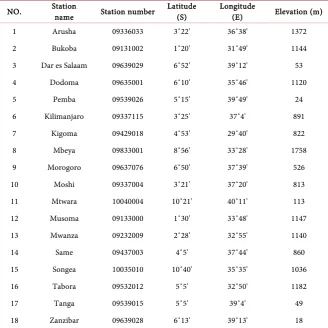
Daily rainfall, maximum and minimum temperatures from 18 meteorological stations (Figure 1) for the period 1961-2015 were used in this study. The geo-graphical coordinate and elevation of the stations used in the study are provided in Table 1. These data was collected from the Tanzania Meteorological Agency.
3.2. Data Quality Control
[image:4.595.210.534.472.699.2]Assessment of the data quality is pre-requisite step in the analysis of climate in-dices [12][13]. It provides opportunity to identify suspicious data and any erro-neous outlier that might influence the analysis including daily values outside the user-predefined threshold. It helps to verify whether a reported data value is representative of what was intended to be measured and has not been contami-nated by unrelated factors. Software such as RClimdex and recent developed Na-tional Climate Monitoring Products (NCMP) software are often used to examine the data and identify and list those that fail pre-defined tests [13]. This is then followed by expert examinations and judgments of the possible causes of error and determines appropriate corrections. In a case where maximum temperature is indicated to be less than minimum temperature, that data will be flagged out as a suspicious. In this study, rainfall and temperature data were subjected to
DOI: 10.4236/acs.2017.74038 529 Atmospheric and Climate Sciences Table 1. Geographical coordinates and station numbers of the stations used in the study.
NO. Station name Station number Latitude (S) Longitude (E) Elevation (m) 1 Arusha 09336033 3˚22' 36˚38' 1372 2 Bukoba 09131002 1˚20' 31˚49' 1144 3 Dar es Salaam 09639029 6˚52' 39˚12' 53 4 Dodoma 09635001 6˚10' 35˚46' 1120 5 Pemba 09539026 5˚15' 39˚49' 24 6 Kilimanjaro 09337115 3˚25' 37˚4' 891 7 Kigoma 09429018 4˚53' 29˚40' 822 8 Mbeya 09833001 8˚56' 33˚28' 1758 9 Morogoro 09637076 6˚50' 37˚39' 526 10 Moshi 09337004 3˚21' 37˚20' 813 11 Mtwara 10040004 10˚21' 40˚11' 113 12 Musoma 09133000 1˚30' 33˚48' 1147 13 Mwanza 09232009 2˚28' 32˚55' 1140 14 Same 09437003 4˚5' 37˚44' 860 15 Songea 10035010 10˚40' 35˚35' 1036 16 Tabora 09532012 5˚5' 32˚50' 1182 17 Tanga 09539015 5˚5' 39˚4' 49 18 Zanzibar 09639028 6˚13' 39˚13' 18
rigorous quality control check, using the described approach including user- predefined threshold set as the mean of the values for the day plus or minus five times the standard deviation (std) of the value for the day, that is
[
mean−5* ,σ mean+5*σ]
. Daily temperature values outside of these thresholdsare manually checked and corrected accordingly. An assessment of unreasonably long consecutive occurrence of the same value, and times when the daily maxi-mum temperature was less than the minimaxi-mum temperature was done to identify incorrect data entry during the digitization process. The observed errors were corrected using original source of information contained in monthly returns of daily climatological observations report (form no. 626), Synoptic reporting sta-tion (form No. 444) and three hourly observasta-tion report (form No. 10) stored in Tanzania Meteorological Agency data archive.
3.3. Methodology for Computing the National Climate Monitoring
Products for Tanzania (Climate Indices)
Cli-DOI: 10.4236/acs.2017.74038 530 Atmospheric and Climate Sciences mate Change Detection and Indices (ETCCDI) defined and recommended a sort of 27 core climate extreme indices to enhance study on climate extremes [13][14] [15] [16]. Computation of the climate Indices was done using RClimdex and NMCP software, which are R-Based package developed at Climate Research Branch of Meteorological Service of Canada [13]. Consistent computation and re-porting of the indices by countries provide a comprehensive understanding of the regional and global dynamics of the climate extremes and is an important signal for climate change detection. These indices are also used in preparation of various climate-monitoring reports including the reports on status of the global climate, annually produced by the World Meteorological Organization (WMO), and the Bulletin of American Meteorological Society (BAMS). Recently the WMO Com-mission for Climatology Expert Team on Climate Monitoring Products recom-mended six climate indices termed as National Climate Monitoring Products (NCMPs) to be consistently computed and reported by all countries to enhance and harmonize climate monitoring [7]. The computation of the six NCMP involve calculation of the monthly indices for each station or grid point, followed by the interpolation of the station or grid values for each month using ordinary kriging to obtain a spatially-complete analysis on a regular grid. The spatially complete anal-ysis is then averaged across the area covered by the country to calculate the NCMP for that month. The basic steps in computation of the indices involve quality con-trol of the daily data, computation of the indices, computation of the variogram for each Index, interpolation of the data for each Index, and averaging each index across the country. Detailed description of the methods and approach used in the computation of the climate indices using RClimdex and NCMP software is pro-vided in [13][15] and can also be accessed from [16][17][18]. The linear trends presented in this study (Table 3 and Figures 2-10) are computed from the indices series using a Kendall’s tau based slope estimator [19]. This estimator is robust to the effect of outliers in the series. It has been widely used to compute trends in hy-dro-meteorological series, see for example [19][20][21][22][23]. The signific-ance of the trend was determined using the Mann-Kendall test and was estimated at the 5% level [24]. The trend was considered to be statistically significant if it was less than or equal to a level of 5% [24][25][26][27]. This test does not assume an underlying probability distribution of the data series. The description of Climate Indices also classified as the NCMP, computed in this study for Tanzania is pro-vided in Table 2.
4. Results and Discussion
DOI: 10.4236/acs.2017.74038 531 Atmospheric and Climate Sciences Figure 2. Trend in mean annual temperature anomaly for the period 1961-2015.
Figure 3. Trend in the mean percentage of warm days for the period 1961-2015.
4.1. Trends in Temperature Extremes
Trends in mean monthly temperature anomaly averaged over the country for the period 1961-2015 are presented in Table 3 and Figure 2. The bold values represent statistical significant trends at a level of 5% (P < 0.05), while values in italics represent non-statistical significance trends. Mean monthly temperature anomaly averaged over the entire country exhibited a statistical significant in-creasing temperature trends from January to December ranging from 0.8˚C (April) to 1.14˚C (January).
[image:7.595.209.536.336.540.2]exhi-DOI: 10.4236/acs.2017.74038 532 Atmospheric and Climate Sciences bits a statistical significant increasing trends ranging from 6.21% in March to 15.60% in July for the warm days and from 10.49% (June) to 16.52% (January) for the cold nights (Table 3). These results indicate that nights are warming much faster than days, which literary implies that minimum temperature is be-coming warmer than maximum temperature. The percentage of cold days and cold nights are observed to decrease with the decrease being more pronounced in cold nights. The decrease in percentage of cold days ranges from 5.22%
Figure 4. Trend in mean percentage of warm nights for the period 1961-2015.
Table 2. Description of the climate indices, the National Climate Monitoring Products (NCMP).
Index Description NCMP 1-Mean T
emperature anomaly This is the mean temperature anomaly for the month, season or year averaged across the country. It measure the overall warmth or cold relative to the normal conditions. NCMP 2-Total rainfall
anomaly
This is the rainfall anomaly expressed both as a simple difference (anomaly) from the base-period average and as a percentage of the base-period average.
It is the anomaly for the month, season or year averaged across the country. NCMP 3-Standardized
Precipitation Index (SPI)
This is a percentile-based measure of the standardized rainfall anomaly for the month, season or year averaged across the country. It is used to monitor rainfall and drought and it is calculated using rainfall.
NCMP 4: Warm days
This is the warm days index. It is a measure of the country-average percentage of
days that exceeded the 90th percentile of the base period distribution for maximum temperatures.
The number of warm days is a standard index produced by the RCLIMDEX software (created by the Expert Team on Climate Change and Detection Indices) index.
NCMP 5: Cold nights It is the cold nights index. It measures the country-average percentage of days that fell below the 10th percentile of the base period distribution. The number of cold days is a standard
ETCCDI (Expert Team on Climate Change and Detection Indices) index and is widely used. NCMP 6: Temperature and
DOI: 10.4236/acs.2017.74038 533 Atmospheric and Climate Sciences Table 3. Countrywide trends in temperature and rainfall related extreme indices for the period (1961-2015). In bold are statistical significant trends at 95% confidence interval, while in Italics are non-significant trends.
Season Month/ Trends
Mean
Warm Days (%)
Warm Nights (%)
Cold Days (%)
Cold Nights
(%)
Precipitation
Anomaly Standardized Precipitation
Index Temperature
Anomaly
(˚C) (%)
JF Jan 1.14 9.51 16.52 −7.03 −15.36 −17.86 −0.16 Feb 1.09 8.91 11.28 −7.11 −9.54 −28.56 −0.43
MAM
March 0.91 6.21 13.8 −5.22 −11.43 13.02 0.19 April 0.8 6.93 14.15 −8.14 −8.14 −29.22 −0.55
May 0.94 11.35 15.62 −9.51 −8.81 −1.89 −.0.03
JJAS
June 1.1 14.3 10.49 −15.21 −9.09 −6.46 0.01 July 1.04 15.6 13.38 −11.48 −9.31 67.64 −.0.23 Aug 1.01 15.44 13.92 −9.04 −12 −5.91 0.09 Sept 1 11.87 15.9 −8.52 −12.16 −11.57 0.02
OND
[image:9.595.216.531.145.660.2]Oct 1.08 12.82 16.37 −5.88 −9.6 17.07 0.21 Nov 0.93 9.83 16.92 −6.1 −9.69 −11.85 −0.11 Dec 1.05 7.87 17.31 −7.25 −14.47 −13.31 −0.17 Annual 0.69 9.37 12.05 −7.64 −10 −11.03 −.0.5
DOI: 10.4236/acs.2017.74038 534 Atmospheric and Climate Sciences Figure 6. Trend in spatial distribution of the percentage of Warm Nights for the period 1961-2015. Statistical significant trends at 95% level (P < 0.05) are represented by solid triangles. The red symbol for positive trends and blue for negative trends.
Figure 7. Trend in Spatial distribution of the percentage of Cold Nights for the period 1961-2015. Statistical significant trends at 95% level (P < 0.05) are represented by solid triangles. The red symbol for positive trends and blue for negative trends.
[image:10.595.232.515.380.622.2]DOI: 10.4236/acs.2017.74038 535 Atmospheric and Climate Sciences Figure 8. Spatial distribution of the trends in percentage change of rainfall for the period 1961-2015. Statistical significant trends at 95% confidence level/5% significant level (P < 0.05) are presented by solid triangles and non-statistical significant trend in open triangles. The green colour symbol are for positivetrends and brown colour symbol for negative trends.
Figure 9. Trend in mean percentage rainfall anomaly for the period 1961-2015.
results from temperature extreme indices indicates a coherent and widespread warming in both days and nights.
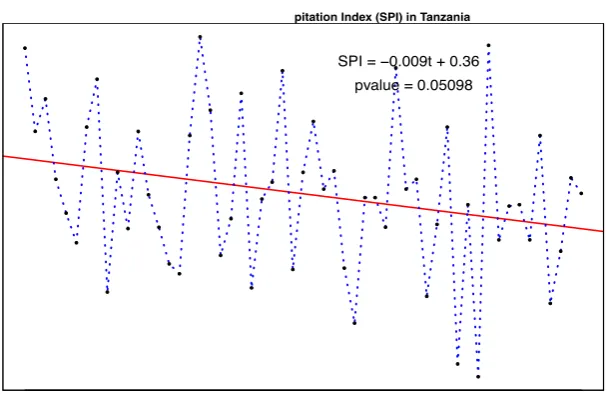
[image:11.595.235.538.388.580.2]DOI: 10.4236/acs.2017.74038 536 Atmospheric and Climate Sciences Figure 10. Trend in Standardized Precipitation Index for the period 1961-2015.
cumented in different IPCC reports [2][3][4], and in a series of WMO publica-tion [5] [6] [7]). The fifth Assessment Report (AR5) of the IPCC indicates a global average warming of 0.85˚C over the period 1880 to 2012, and that the number of cold days and nights has decreased, while the number of warm days and nights has increased on global scale [4].
Spatial distribution of trends in mean percentage of warm days and warm nights are presented in Figure 5 and Figure 6 respectively. A statistical signifi-cant increasing trend in percentage of warm days and warm nights is depicted over the eastern part of the country including areas around Kilimanjaro regions, northern coast, southern coast and south-western highlands. Western and east-ern parts of the Lake Victoria basin are also characterized by increasing trends of warm days. However, non-statistical decreasing trends in the percentage of warm days and warm nights are depicted in the western parts of the country and in some parts of central areas and the southern part of Lake Victoria basin. Moreover, the western and southernparts of the lake victoria basin showed non- statistical significant decreasing trends of warm nights. These results indicate a clear dipole pattern in temperature dynamics between the eastern side of the country mainly characterized and influenced by the Indian Ocean and the Western side of the country largely influenced by the Congo air mass and wes-terlies. Figure 7 represents the spatial distribution of the percentage of cold nights for the same period, whereby a decreasing trends is depicted in the entire country, but being more pronounced and statistically significant over the eastern part of the country.
4.2. Trends in Extreme Rainfall Indices
DOI: 10.4236/acs.2017.74038 537 Atmospheric and Climate Sciences both percentage changes in rainfall anomaly and in Standardized Precipitation Index (SPI). The spatial distribution of percentage change in rainfall anomaly (Figure 8) indicates a non-statistical significant decreasing rainfall trends over the large parts of the country, except in Songea and Pemba regions, where statis-tical significant decreasing rainfall trend is depicted. These results underscore the complexity, mixed pattern of change and un-certainties associated with dy-namics in rainfall patterns in the region and are consistent with observed global trends.
5. Conclusion
This study provides an assessment of the observed trends in key climate extreme indices characterized by maximum and minimum temperature, and rainfall. The analyses were done using daily rainfall and daily temperature datasets from 18 meteorological stations for the period 1961-2015. Five temperature extreme in-dices including temperature anomaly, mean percentages of warm days, warm nights, cold days and cold nights, and two rainfall extreme indices including mean rainfall anomaly and the Standardized Precipitation Index (SPI) were computed and then subjected to trend analysis. It has been observed that both maximum and minimum temperature exhibit statistical significant increasing trends at monthly and annual time scales. Mean annual temperature anomaly has increased by 0.69˚C, while the percentage of warm days has increased by 9.37%. Comparatively mean percentage of warm night has increased by 12.05%, which is relatively faster trend than the trend in warm days. The percentage number of cold days has decreased by 7.64%, while percentage number of cold nights has decreased by 10.0%. Spatial analysis of the observed temperature trend has indicated a coherent and widespread warming over the large part of the country, particularly over the eastern part, while a non-statistical significant decreasing temperature trends is depicted in some few areas over western part of the country. A non-statistical significant decreasing trend is depicted in percen-tage change in mean rainfall anomaly and in Standardized Precipitation Index. These results are consistent with observed global warming trends and unders-core theunderlying complexity and un-certainties in the assessment of precipita-tion patterns as extensively depicted many literaturesin most parts of the world.
Acknowledgements
The authors wishes to thank The Tanzania Meteorological Agency for providing data used in this study and WMO for providing guidance in analysis of climate extreme in climate time series.
References
[1] International Federation of Red Cross and Red Crescent Societies (IFRC) (2014) World Disaster Report.
DOI: 10.4236/acs.2017.74038 538 Atmospheric and Climate Sciences
Managing the Risks of Extreme Events and Disasters to Advance Climate Change Adaptation—Summary for Policymakers, a special Report of Working Groups I and II of the Intergovernmental Panel on Climate Change. World Meteorological Or-ganization, Geneva, Switzerland, 24 p.
[3] Field, C.B., Barros, V., Stocker, T.F., Qin, D., Dokken, D.J., Ebi, K.L., Mastrandrea, M.D., Mach, K.J., Plattner, G.-K., Allen, S.K., Tignor, M. and Midgley, P.M. (2012) Managing the Risks of Extreme Events and Disasters to Advance Climate Change Adaptation. A Special Report of Working Groups I and II of the Intergovernmental Panel on Climate Change. Cambridge University Press, Cambridge, UK, and New York, NY, USA, 582 p.
[4] Stocker, T.F., Qin, D., Plattner, G.-K., Tignor, M., Allen, S.K., Boschung, J., Nauels, A., Xia, Y., Bex, V. and Midgley, P.M. (2013) Climate Change 2013: The Physical Science Basis. Contribution of Working Group I to the Fifth Assessment Report of the Intergovernmental Panel on Climate Change—Summary for Policymakers. Cambridge University Press, Cambridge, United Kingdom; New York, New York, USA. 24 p.
[5] WMO-No. 1152 (2015) WMO Statement on the Status of the Global Climate in 2014.
[6] WMO-No. 1167 (2016) WMO Statement on the State of the Global Climate in 2015. [7] WMO. No. 1189 (2017) WMO Statement on the State of the Global Climate in
2016.
[8] Kijazi, A.L. and Reason, C.J.C. (2009) Analysis of the 1998 to 2005 Drought over the Northeastern Highlands of Tanzania. Climate Research, 38, 209-223.
https://doi.org/10.1007/s00704-012-0746-3
[9] Kijazi, A.L. and Reason, C.J.C. (2009) Analysis of the 2006 Floods over Northern Tanzania. International Journal of Climatology, 29, 955-970.
https://doi.org/10.1002/joc.1846
[10] Changa, L.B., Yanda, P.Z. and Ngana, J. (2010) Spatial and Temporal analysis of re-cent climatological data in Tanzania. Journal of Geography and Regional Planning, 3, 44-65. ISSN 2070-1845© 2010 Academic Journals.
http://www.academicjournals.org/JGRP
[11] Luhunga, P., Botai, J. and Kahimba, F. (2016) Evaluation of the Performance of CORDEX Regional Climate Models in Simulating Present Climate Conditions of Tanzania. Journal of Southern Hemisphere Earth Systems Science, 66, 33-55.
https://doi.org/10.22499/3.6601.005
[12] WMO-No. 488 (2007) Guide to the Global Observing System.
[13] CCL/WCRP/JCOMM Expert Team on Climate Change Detection and Indices (ET-CCDI) (2009) WMO. TD. NO. 1500.
[14] Folland, C.K., Miller, C., Bader, D., Crowe, M., Jones, P., Plumner, N., Richman, M., Parker, D.E., Rogers, J. and Scholefield, P. (1999) Workshop on Indices and indica-tors for Climate Extremes, Asheville, NC, USA, 3-6 June 1997, Breakout Group C: Temperature Indices for Climate Extremes. Climatic Change, 42, 31-43.
https://doi.org/10.1023/A:1005447712757
[15] Jones, P.D., Horton, E.B., Folland, C.K., Hulme, M., Parker, D.E. and Basnett, T.A. (1999) The Use of Indices to Identify Changes in Climatic Extremes. Climatic Change, 42, 131-149. https://doi.org/10.1023/A:1005468316392
DOI: 10.4236/acs.2017.74038 539 Atmospheric and Climate Sciences
(2001) Report on the Activities of the Working Group on Climate Change Detec-tion and Related Rapporteurs 1998-2001. World Meteorological OrganizaDetec-tion, Ge-neva, Rep. WCDMP-47, WMO-TD 1071, 143 p.
[17] Frich, P., Alexander, L.V., Della-Marta, P., Gleason, B., Haylock, M., Klein Tank, A.M.G. and Peterson, T. (2002) Observed Coherent Changes in Climatic Extremes during the 2nd Half of the 20th Century. Climate Research, 19, 193-212.
https://doi.org/10.3354/cr019193
[18] New, M., Hewitson, B., Stephenson, D.B., Tsiga, A., Kruger, A., Manhique, A., Go-mez, B., Coelho, C.A.S., Masisi, D.N., Kululanga, E., Mbambalala, E., Adesina, F., Saleh, H., Kanyanga, J., Adosi, J., Bulane, L., Fortunata, L., Mdoka, M.L. and Lajoie, R. (2006) Evidence of Trends in Daily Climate Extremes over Southern and West Africa. Journal of Geophysical Research, 111, Article ID: D14102.
https://doi.org/10.1029/2005JD006289
[19] Sen, P.K. (1968) Estimates of the Regression Coefficient Based on Kendall’s Tau.
Journal of the American Statistical Association, 63, 1379-1389.
https://doi.org/10.1080/01621459.1968.10480934
[20] Zhang, X., Alexander, L.V., Hegerl, G.C., Klein-Tank, A., Peterson, T.C., Trewin, B. and Zwiers, F.W. (2011) Indices for Monitoring Changes in Extremes Based on Daily Temperature and Precipitation Data. Wiley Interdisciplinary Reviews. Cli-mate Change, 2, 851-870.https://doi.org/10.1002/wcc.147
[21] Vincent, L.A., et al. (2005) Observed Trends in Indices of Daily Temperature Ex-tremes in South America 1960-2000. Journal of Climate, 18, 5011-5023.
https://doi.org/10.1175/JCLI3589.1
[22] Zhang, X., Aguilar, E., Sensoy, S., Melkonyan, H., Tagiyeva, U., Ahmed, N., Kuta-ladze, N., Rahimzadeh, F., Taghipour, A., Hantosh, T.H., Albert, P. and Semawi, M. (2005) Trends in Middle East Climate Extreme Indices from 1950 to 2003. Journal of Geophysical Research, 110, D22104. https://doi.org/10.1029/2005JD006181
[23] Zhang, X., Vincent, L.A., Hogg, W.D. and Niitsoo, A. (2000) Temperature and Pre-cipitation Trends in Canada during the 20th Century. Atmosphere-Ocean, 38, 395-429.https://doi.org/10.1080/07055900.2000.9649654
[24] Mann, H.B. (1945) Non-Parametric Tests against Trend. Econometrica, 13, 245-259.
https://doi.org/10.2307/1907187
[25] Luhunga, P., Mutayoba, E. and Ng’ongolo, H. (2014) Homogeneity of Monthly Mean Air Temperature of the United Republic of Tanzania with HOMER. Atmos-pheric and Climate Sciences, 4, 70-77. https://doi.org/10.4236/acs.2014.41010
[26] Kendall, M.G. (1975) Rank Correlation Methods. Charles Griffin, London.
[27] Onyutha, C. and Willems, P. (2015). Spatial and Temporal Variability of Rainfall in Nile Basin. Hydrology and Earth System Sciences, 19, 2227-2246.
https://doi.org/10.5194/hess-19-2227-2015