J. Range Manage.
56: 218-226 May 2003
Economic and environmental impacts of pasture nutrient management
EDWARD OSEI, PHILIP W. GASSMAN, LARRY M. HAUCK, SUSAN NEITSCH, RON D. JONES, JAN MCNITT, AND HEATHER JONES
Authors are Senior Research Economist, Texas Institute for Applied Environmental Research (TIAER), Tarleton State University, Stephenville, Tex, 76402, Research Agricultural Engineer, Center for Agricultural and Rural Development, Iowa State University, Ames, Iowa 50011, Assistant Director, TIAER, Research Asssociate, Spatial Sciences Laboratory - Texas A&M University, College Station, Tex 77843, Director, TIAER, Worker Advocate, State of Maine, Portland, Maine 04101, and Senior Research Assistant, TIAER.
Abstract
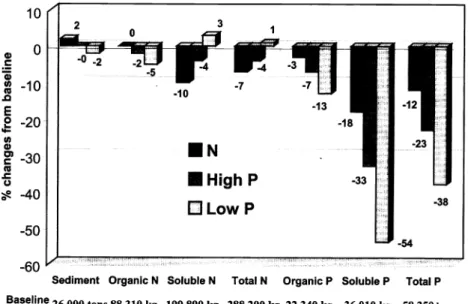
Highly intensive stocking of dairy cattle on continuously grazed pasture coupled with liberal applications of commercial fertilizer can lead to increased losses of agricultural nutrients, which is a concern for water quality of receiving lakes and sur- face water resources. Integrated economic-environmental model simulations performed for the Lake Fork Reservoir Watershed in northeast Texas indicate that appropriate pasture nutrient management including stocking density adjustments and more efficient commercial fertilizer use could lead to significant reduc- tions in nutrient losses. Soluble and organic P losses were pre- dicted to decline by 54 and 13% relative to baseline conditions when manure P was assumed totally plant available (Low P sce- nario). The soluble and organic P loss reductions declined to 33
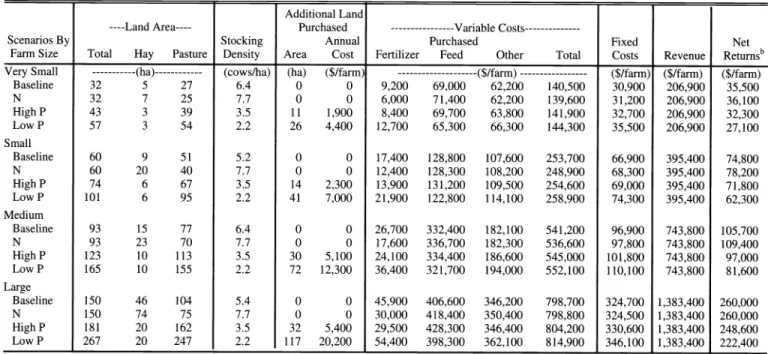
and 7 % when only inorganic P was assumed plant available (High P scenario). Simulation of an N-based manure manage- ment plan resulted in the smallest predicted soluble and organic P loss reductions of 18 and 3%. Nitrogen loss predictions ranged from a 7% decline to a 1% increase for the 3 scenarios as com- pared to the baseline. The High P and Low P scenarios resulted in estimated aggregate profit reductions of 6 and 18% relative to the baseline. These profit declines occurred because the dairies had to acquire additional pasture land to accommodate the expanded area required for the P-based scenarios. In contrast, the N-based stocking density and nutrient management scenario resulted in an aggregate profit increase of 3 % across all dairies.
Variations in economic impacts were also predicted across farm sizes.
Key Words: Stocking density, manure, nutrient losses, nitrogen, phosphorus, economics
Concerns over adverse water quality impacts associated with livestock production have increased dramatically over the past few decades. Much of this concern is due to concentration of livestock production in relatively small areas or specific water- sheds, resulting in problems such as increased nitrogen (N) and
The authors acknowledge support from the U.S. Environmental Protection Agency (USEPA) which provided funding for the project under Contract No. CR 820384-02-7. The views expressed in this paper are not necessarily those of the USEPA.
Manuscript accepted 13 Jul. 02.
Resumen
La carga altamente intensiva de ganado lechero en praderas apacentadas continuamente, acompanado con aplicaciones abun- dantes de fertilizante comercial pueden conducir a un aumento de perdida de los nutrientes agrfcolas, to cual es una preocu- pacion para la calidad del agua de los lagos receptores y los recursos de agua superficial. Simulaciones de un modelo integral ambiental-economico realizadas para la cuenca hidrologica del Lago Fork en el noreste de Texas indican que el manejo apropia- do de los nutrientes de la pradera, incluyendo ajustes en la densi- dad de carga animal y el use de fertilizantes comerciales mas efi- cientes, pudiera conducir a reducciones significantes en las per- didas de nutrientes. Se predijo que las perdidas de P soluble y organico disminuirian en 54 y 13 % en relacion a las condiciones iniciales, esto cuando se asumio que el P del estiercol era total- mente disponible para las plantas (escenario de baja disponibili- dad de P). La reduccion de las perdidas de P soluble y organico disminuyo a 33 y 7% cuando se asumio que solo P inorganico estaba disponible para las plantas (escenario de alta disponibili- dad de P). La simulacion de un plan de manejo de estiercol basa- do en N resulto en las reducciones mas pequenas de perdida de P soluble a inorganico, 18 y 3%. Las predicciones de perdida de N variaron de 7 % de disminucion a 1 % de incremento, esto para
los 3 esenarios y comparando con el contenido inicial. Los esce- narios de P alto y bajo resultaron en reducciones estimadas de la ganancia agregada del 6 y 18% en relacion al contenido inicial.
Estas disminuciones de la ganancia ocurrio porque las lecherias tienen que adquirir terrenos de pradera adicionales para proveer el area expandida necesaria para los escenarios basados en P. En contraste, el escenario de la densidad de carga animal y el manejo de nutrientes basados en N resulto en un incremento de la ganancia agregada del 3% a traves de todas las lecherias.
Variaciones en el impacto economico fueron tambien predichas a traves de todos los tamanos de granjas.
phosphorus (P) loads in surface water from land-applied manure.
Various studies have been performed to evaluate environmental problems related to livestock production (e.g. Dietz and Hoogervorst 1991 - the Netherlands, Hamilton and Sims 1995 -
the southern portion of Delaware, Warrick and Leavenworth 1996 - the Neuse River Watershed in North Carolina, and McFarland and Hauck 1999 - the Upper North Bosque River Watershed (UNBRW) in north central Texas).
218 JOURNAL OF RANGE MANAGEMENT 56(3) May 2003
A National Pilot Project (NPP) on Livestock and the Environment was initi- ated in 1992 to help provide solutions regarding environmental problems associ- ated with livestock manure management (Jones et al. 1993). A major development of the NPP is the Comprehensive Economic and Environmental Optimization Tool - Livestock and Poultry (CEEOT-LP), an integrated modeling system designed to generate economic and environmental indi- cators for different scenarios encompassing alternative manure processing technolo- gies, variations in rates and modes of land- applied manure and commercial fertilizer, and other best management practices. The initial application of the modeling system was for a range of policy scenarios focused on manure management in the upper north Bosque river watershed as described by Pratt et al. (1997) and Osei et al. (2000b).
To evaluate implications of various management practices on dairy pasture operations, the modeling system was next applied to pasture-based dairy operations located in the Lake Fork Reservoir Watershed (LFRW) in northeast Texas (McNitt et al. 1999). In livestock agricul- ture, most nonpoint sources of excessive nitrogen and phosphorus loads have been attributed to confined animal feeding oper- ations whereas pasture-based operations have received relatively minor attention.
However, Bottcher et al. (1995) estimated that significant nutrient losses would occur from grazed pastures with high animal densities in the Lake Okeechobee region of Florida, based on various monitoring results and unpublished computer simula- tions. In a review of several studies, Correll (1996) found that pastures man- aged with high levels of exogenous nutri- ents and high animal densities could seri- ously impact the quality of surface waters.
Belsky et al. (1999), in an extensive review, also report that water quality impacts from livestock grazing have been documented across the United States. The objective of this study was to evaluate the economic and environmental impacts of alternative pasture stocking densities and appropriate commercial fertilizer supple- mentation based on conditions prevailing in the Lake Fork reservoir watershed.
In light of the existing literature, it was hypothesized that low stocking densities and reduced commercial fertilizer supple- mentation on pastures would lead to a decline in nutrient losses. However, these would also have economic implications to producers due to expected per hectare yield declines and the need to obtain larger
pasture area for grazing livestock. To obtain quantitative estimates of these impacts, the following questions were posed:
1. How much change in N and P losses would result from typically suggested pasture nutrient management standards (including stocking density adjustments and commercial fertilizer reductions)?
2. What economic impacts to producers are associated with these standards?
The Lake Fork Reservoir Watershed
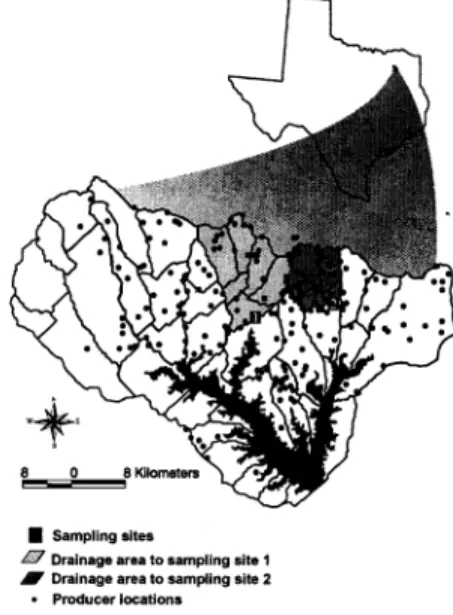
The Lake Fork Reservoir Watershed (LFRW) drains portions of Hopkins, Hunt, Rains, and Wood counties in northeast Texas (Fig. 1). The 127,000 ha watershed
Sampling sites
Drainage area to sampling site 1
® Drainage area to sampling site 2 Producer locations
Fig. 1. The Lake Fork Reservoir Watershed (LFRW) with locations of dairy opera- tions, sampling sites, SWAT subbasins, and the reservoir.
contains an 11,210 ha lake that is used pri- marily for fishing and water supply. Since the early 1990s substantial work done as part of the Lake Fork Creek Hydrologic Unit Area (LFCHUA) project, a coopera- tive interagency project initiated in the study area, has resulted in improvements in water quality (LFCHUA 1995). As part of the Hydrologic Unit Area project, water quality measurements were taken in the watershed, which showed elevated levels of N and P in some of the tributaries of the Lake Fork Reservoir (LFCHUA 1995).
The key problems encountered and addressed within the Hydrologic Unit Area project involved pasture denudation
and over-fertilization of pastures from manure and commercial fertilizer sources.
A total of 205 dairies with a combined herd size of 26,855 cows were located in the watershed at the time of this study.
The majority of the dairies lie within Hopkins County, the second highest milk- producing county in Texas. The vast majority of the dairies in the watershed utilize pasture-based production systems that require confinement of the milking cows only when they are milked. Pasture management consisting of open access grazing (OAG) is used in which cows con- tinuously graze bermuda grass overseeded with winter annuals, primarily winter wheat, rye grass and/or clover. Because pastures are not managed intensively, sig- nificant denudation was observed on these grazing operations prior to initiation of the Hydrologic Unit Area project. Pasture management practices that eliminate denudation were shown by McNitt et al.
(1999) to generally result in significant reductions in nutrient losses for the water- shed. Pasture-based beef production and cow-calf operations that raise calves for slaughter or for replacement of milking cows on dairies are also prevalent in the watershed. Manure deposition and com- mercial fertilizer applications were both sources of nutrients to the improved pas- tures used by the beef and dairy operations.
Approximately 71 % of the watershed land area was used for pasture in 1996, with about 44% classified as improved and the remaining 27% defined as unim- proved (Ewer and Easterling 1998). Forest and brush cover almost 8% of the remain- ing land area; less than 2% of the land area was devoted to cropland. Most of the land is characterized by deep, loamy to sandy soils that are slowly permeable and well drained. Average annual temperature and precipitation are 10° C and 1,118 mm.
Model Framework and Simulation Methodology
Alternative stocking density scenarios for the watershed were performed in a whole-farm manner through an interface of the economic and environmental com- ponents within the modeling system (Fig.
2). The Farm-level Economic Model (FEM) is a representative farm model (Osei et al. 2000a) that is used to simulate farm-level economic impacts in response to different policy scenarios. The environ- mental component consists of 2 models, the field-level Agricultural Policy/Environmental eXtender (APEX) model (Williams et al.
JOURNAL OF RANGE MANAGEMENT 56(3) May 2003 219
Policy scenarios
Farm Economic Model (FEM)
I
Post-simulation comparison of economic and environmental indicators
Input data
SWAT (30-year simulations)
Fig. 2. Schematic of key data flows between models used in the Comprehensive Economic and Environmental Optimization Tool-Livestock and Poultry (CEEOT-LP) modeling system.
1995, 2000) and the watershed-level Soil and Water Assessment Tool (SWAT) model (Arnold et al. 1998). The APEX model is a modified version of the Erosion Productivity Impact Calculator (EPIC) model (Williams 1990, 1995) that is used in the modeling system to simulate alterna- tive management scenarios such as varia- tions in manure and fertilizer application rates, and adoption of structural best man- agement practices (BMPs). Edge-of-field sediment and nutrient losses simulated in APEX, coupled with losses simulated in the SWAT model from other land uses, are routed in SWAT through the stream sys- tem to the watershed outlet. Watershed- level indicators from SWAT were used in this study to assess the environmental impacts of the simulated scenarios.
However, APEX edge-of-field indicators can also be used in conjunction with, or instead of, the SWAT indicators (Fig. 2).
The economic model operates on annual time step and can be executed for extend- ed periods of 30 years or more. Key cate- gories of input data required to simulate a farm in the economic model include type of livestock system, manure management methods, cropping systems, facilities and equipment, field characteristics, and other external factors. Economic outputs gener- ated by the model include total revenue, total cost, net returns, livestock rations, sales, costs of individual production com- ponents (crop and livestock, fertilizer, labor, etc.), debt payment, and owner's equity.
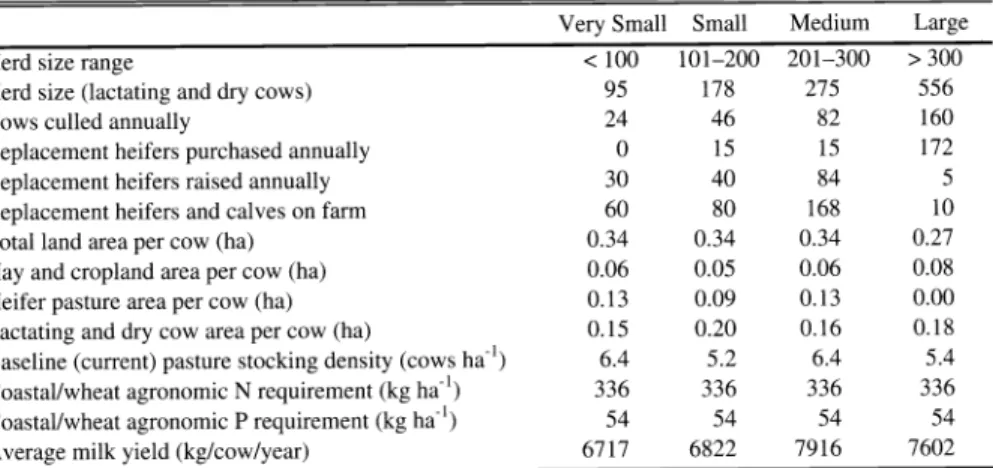
Economic model simulations were per- formed for 4 representative dairy opera- tions, 1 for each of 4 size categories con- structed to help evaluate the impacts of the scenarios across dairies of different size (Table 1). Dairy farm categories and representative sizes were based on data listing the financial profile of dairies in Hopkins County, Tex. (McDonald 1995).
Representative sizes (Table 1) were 95 cows for very small dairies (< 100 cows), 178 cows for small dairies (101 to 200 cows), 275 cows for medium sized dairies (201 to 300 cows), and 556 cows for large dairies (> 300 cows). Land area for each dairy was assumed to consist of both pas- ture and hayland (Table 1). Other charac-
teristics related to cull cows, heifers, and land area for the representative dairies are also listed in Table 1.
The edge-of-field model operates on a daily time step and can be applied for a wide range of soil, landscape, climate, crop rotation, and management practice combinations. It can be executed for a sin- gle field or used for a wide range of multi-
field configurations including whole farms, small watersheds, or filter strip impacts on nutrient losses from waste application fields. The main edge-of-field model components are weather, hydrolo- gy, soil temperature, erosion-sedimenta- tion, nutrient cycling, tillage, management practices, crop management and growth, and pesticide and nutrient fate and trans- port. Choice of simulated cropping sys- tem, manure and/or fertilizer nutrient char- acteristics, tillage practices, soil layer properties, and other characteristics are input for each simulated subarea. Key out- puts include crop yields, edge-of-field nutrient and sediment losses, and other water and nutrient balance indicators.
All 205 dairies were simulated directly in the edge-of-field model instead of using the economic model representative farms.
Dairies were categorized into one of the 4 groups listed in Table 1, based on herd size. Specific pasture and hay field areas could not be obtained for the majority of dairies; however, mean pasture and hay field areas were provided by the Texas State Soil and Water Conservation Board (TSSWCB) for each of the 4 dairy cate- gories. Thus, the pasture and hay field areas simulated for each dairy were deter- mined as a function of the mean herd size, pasture areas, and hay field areas for the respective category. Further description of
Table 1. Herd sizes and other characteristics of the representative watershed dairies simulated in the economic model.
Very Small Small Medium
Herd size range < 100 101-200 300
Herd size (lactating and dry cows) 95 178
Cows culled annually 24 46
Replacement heifers purchased annually 0 15
Replacement heifers raised annually 30 40 5
Replacement heifers and calves on farm 60 80
Total land area per cow (ha) 0.34 0.34
Hay and cropland area per cow (ha) 0.06 0.05
Heifer pasture area per cow (ha) 0.13 0.09
Lactating and dry cow area per cow (ha) 0.15 0.20 Baseline (current) pasture stocking density (cows ha i) 6.4 5.2 Coastal/wheat agronomic N requirement (kg hat) 336 336 Coastal/wheat agronomic P requirement (kg ha l) 54 54
Average milk yield (kg/cow/year) 6717 6822
Source: The information in this table was based on extensive data from the study area.
Environmental component
Input data
1
APEX (30-year simulations)
I
220 JOURNAL OF RANGE MANAGEMENT 56(3) May 2003
the watershed edge-of-field model methodology is given in Osei et al.
(2000a).
The Soil and Water Assessment Tool was developed to simulate continuous- time streamflow with a high level of spa- tial detail by allowing the division of a watershed or river basin into grid cells or sub-watersheds. The model operates on a daily time step and is designed to evaluate management effects on water quality, sed- iment, and agricultural chemical yield in large, ungaged basins. The major compo- nents of the watershed-scale model include hydrology, weather, sedimenta- tion, soil temperature, crop growth, nutri- ents, pesticides, and agricultural manage- ment. The Soil and Water Assessment Tool inputs and outputs are similar to those used in the edge-of-field model.
The remaining land that was not simu- lated in the edge-of-field model was simu- lated in the watershed-scale model, and this constituted the majority of the water- shed land area. Unimproved pasture was simulated as rangeland in the watershed- scale model. Improved pasture, woodland, urban, and the reservoir were the other simulated land use categories. The range- land and improved pasture were assumed grazed by beef cattle according to the stocking rates described by Bailey and Riggs (1996). Simulated N and P applica- tion rates via manure deposition and inor- ganic fertilizer on pastures and rangeland grazed by beef cattle were also based on values reported by Bailey and Riggs (1996). Point source N and P loadings to tributaries of the Lake Fork Reservoir from 4 waste treatment facilities were accounted for in the watershed model. The total N and P loads calculated for the baseline and alternative scenarios were the sum of N and P loadings contributed by 7 different tributaries that drain into the reservoir.
Edge-of-field and Economic Model assumptions
It was estimated that a typical milking cow in the watershed produces 127 kg N and 27 kg P annually in manure based on ASAE standards (ASAE 1995). These estimates were based on the mean plus 1
standard deviation of the ASAE values, following customary practice in formulat- ing dairy waste management plans in the study area. Assuming that the percentage of manure deposited on pasture is directly proportional to amount of time spent there, about 88% of manure nutrient is deposited on pasture and the remainder is collected
from the milking parlor and applied on fields designated for liquid waste. This assumption is based on extensive data in the study area which indicates that cows are confined for milking 3 hours each day and turned out on pasture for the remain- der of the day (TNRCC various years).
Appropriate manure application rates or stocking densities are based on plant avail- able manure nutrients rather than total manure nutrient production because of various losses and transformations that occur prior to plant uptake. Two adjust- ments were incorporated in the simulation of manure nitrogen deposited on pasture in order to estimate the proportion that was available for plant uptake. First, it was assumed that 20% of the manure N would volatilize from the soil surface, based on per- mitting guidelines used by the Texas Natural Resource Conservation Commission (TRNCC) as described by Flowers et al.
(1998). Second, only 50 % of the remaining manure N was assumed to be plant available within the first year after direct deposition on pasture, again following local guide- lines (Flowers et a1.1998).
Subsequent mineralization of the N applied in the manure will release addi- tional plant available N within the soil in the years following deposition (USDA 1979, Flowers et al. 1998). Ideally, this additional N should be factored into deci- sions as to the amount of manure N that would be applied to the same pastures in future depositions. However, a conserva- tive assumption was made that it would be impracticable for producers to keep track of such processes due to inadequate soil testing or irregular use of soil test results.
Thus it was assumed that only 50% of manure N remaining in the soil profile after volatilization would be considered plant available in every year. No losses were assumed for manure phosphorus or commercial fertilizer nutrients.
Heifers were included in the economic model simulations mainly for cost accounting purposes. The percentage of the overall watershed manure load that would be attributed to the heifer portions of the dairy herds is about 20%. Heifer grazing was not simulated in the edge-of- field model, and none of the scenarios dis- cussed in this paper had any impact on heifer pasture area. However, the heifer manure load was indirectly accounted for in the watershed-scale model, because all of the remaining watershed pasture land (including the heifer pasture areas) was assumed to receive beef cattle manure deposition. Although the manure charac- teristics and stocking rates differ between
the 2 species, simulated beef cattle manure depositions accounted for the heifer herd manure loads.
Baseline stocking densities assumed for the dairies varied depending on pasture area available and whether or not a signifi- cant portion of pasture was devoted to raising replacement heifers (Table 1).
Most large dairies devote a greater portion of land to hay fields than smaller dairies, but they also raise fewer replacement heifers. Baseline lactating and dry cow stocking density was estimated by first subtracting hay area from the total land area, then allocating 0.2 ha of pasture for each replacement heifer raised on the farm. The remaining area was divided by the number of lactating and dry cows to obtain baseline stocking densities (Table 1). The number of replacement heifers raised was based on typical culling prac- tices, death losses, and replacement heifer purchases recorded in dairy farm financial
profiles for Hopkins County, Tex.
(McDonald 1995) and from communica- tions with watershed experts. The result- ing average baseline stocking density across the 4 dairy sizes was about 5.7 cows per hectare (Table 2). This stocking
density was corroborated by various experts in the study area who had indicat- ed during independent consultations that stocking densities on dairy pasture in the watershed range from 5 to 7.5 cows per hectare.
The stocking rate of 5.7 cows per hectare results in a total manure N rate of 624 kg ha' and a corresponding manure plant available nitrogen rate of 250 kg ha'
(Table 2). The associated total manure P and mineral P rates were 135 and 88 kg
ha'. It was further assumed for the base- line that producers applied about 247 kg N and about 146 kg P205 (59 kg P) per hectare of pasture each year (Table 2), based again on the judgement of local experts. These application rates were also corroborated by fertilizer cost estimates in dairy farm financial profiles (McDonald 1995) as well as fertilizer sales figures for the 4-county region (Office of the State Chemist 1996). Thus the total plant avail- able nitrogen going on pasture each year from manure and commercial fertilizer sources was about 1.5 times the agronomic rate (Table 2).
Additional Economic Model Assumptions
The scenarios simulated entail various rates of manure and commercial fertilizer nutrients on pasture. To account effective- ly for economic impacts of these scenar-
JOURNAL OF RANGE MANAGEMENT 56(3) May 2003 221
ios, some yield adjustments were made in the economic model to reflect different forage yield responses to manure and commercial fertilizer nutrients. Yield responses were estimated using nitrogen rather than phosphorus application rates.
Using information from the study area, it was estimated that commercial fertilizer N response for Coastal Bermuda grass was 40 kg dry matter yield/kg N. After further
calculations, manure nitrogen yield
response was determined to be 24 kg dry matter yield per kg of manure plant avail- able nitrogen for Bermuda grass. For win- ter wheat pasture, about 10 kg dry matter yield per kg of nitrogen was assumed for commercial fertilizer N as well as plant available manure N. Lower yield respons- es are generally anticipated from manure deposited on pasture than from commer- cial fertilizer because: (1) manure is deposited unevenly, and (2) trampling of pasture grasses by cattle under open access grazing conditions also stifles for- age growth. However, the same winter wheat yield responses were used for manure and commercial fertilizer because the only available information did not sug- gest higher wheat yield responses from commercial fertilizer (Brown, B. 1997.
Personal communication. Texas A&M University System Extension. Sulphur Springs, Tex.).
In spite of these pasture forage yield adjustments, stocking densities and fertil- izer application rates were based on base- line yields to reflect realistic producer behavior since it is impracticable that most producers would estimate yield adjust- ments in advance and modify application rates accordingly. It was important to mimic actual producer behavior to obtain good estimates of the scenario impacts.
Economic modeling accounted for greater forage availability and uptake by cows when total pasture forage production is increased. However, the model did not assume a proportional decrease in feed costs. This is because larger pasture forage production means that cattle would con- sume more coastal and wheat forage, necessitating adjustments in purchase of supplemental feed for the herd. The model includes a comprehensive livestock nutri- tion component that mimics the way pro- ducers (and their nutritionists) determine livestock rations. Based on typical milk yields in the study area (ranging from about 6,700 kg to 7,900 kg per cow annu- ally for the 4 dairy groups), over 50% of dry matter intake of lactating cows is from supplemental feed, which is provided in feed troughs placed on the pasture. In
extreme cases of overabundant pasture and hay forage production some forage raised on hay fields might be sold.
A two-step General Algebraic Modeling System (GAMS) process (Brooke et al.
1992) was used to estimate purchased feed cost and how much forage, if any, is sold.
First, a feed cost minimization process was performed assuming that any unused forage from hay fields or pasture would be sold at a "price" (shadow value) lower than the selling price. During the second step of the process, the unused forage was assumed sold at the selling price rather than the shadow value with adjustments made for marketing expenses. For the watershed simulations, the shadow value for pasture forage was estimated to be $0 per ton based on model calibrations. In other words, dairy producers in the water- shed would use as much pasture and hay field forage as they can on the dairy, and only sell what the cows cannot consume.
Alternative Pasture Nutrient Management Scenarios
The first pasture nutrient management alternative simulated for the watershed was performed by setting the stocking density to 7.7 cows ha', resulting in a manure plant available nitrogen rate of 336 kg ha' that is equal to the nitrogen agronomic requirement of the forage (Table 2). Thus it was assumed that the N needs of the pasture forage were com- pletely met by manure N, eliminating the need for supplemental N fertilizer applica- tions. The N rate scenario also resulted in correspondingly higher inorganic P and total manure P application rates that were 2.2 and 3.3 times greater than the agro-
nomic P rate of the crop (Table 2). Again, supplemental P fertilizer was not required for this scenario, because the crop uptake requirements for P were more than satis- fied by manure P.
Two alternative P-based stocking densi- ty scenarios were also simulated for the watershed, defined as "High P" and "Low P". These scenarios reflected prevailing opinions about how P-based nutrient man- agement plans should be designed. The High P stocking density scenario assumes that the organic (particulate) component of manure P is not readily available for plant uptake resulting in the inorganic P portion in the manure being deposited at a rate equivalent to forage agronomic P require- ments. The calculated High P stocking rate of 3.5 cows ha' results in manure inorgan- ic P and total P deposition rates of 54 and 84 kg ha', and associated manure plant available nitrogen and total N application rates of 155 and 386 kg ha' (Table 2).
Due to the disparity between the NIP ratio of manure nutrients and that of forage requirements, commercial fertilizer N was required at a rate of 182 kg ha' to meet the forage agronomic N requirements.
The Low P option assumes a stocking density and commercial nutrient applica- tion such that manure total P supplies all forage P needs. The resulting stocking rate was estimated to be 2.2 cows ha', with corresponding manure inorganic and total P deposition rates of 35 and 54 kg ha'
(Table 2). In this case, an even higher commercial fertilizer N rate of 235 kg ha'
was simulated to meet the agronomic N requirements of the pasture forage. The Low P scenario entails the least stocking density and consequently the greatest pas- ture area requirement.
Table 2. Key characteristics of alternative pasture management scenariosa.
Scenario Baseline N P P
Average stocking density (cows ha') 5.7 7.7
Commercial fertilizer N rate (kg ha') 247 0
Commercial fertilizer P rate (kg ha') 59 0 0 0
Manure PANb rate (kg ha') 250 336
Total manure N rate (kg ha') 625 841
Manure inorganic-P rate (kg ha') 88 118
Total manure P rate (kg ha') 135 182
Estimated coastal yield (kg dry matter ha') 6,390 3,767 Estimated wheat yield (kg dry matter ha') 3,020 1,872 Ratio of total PAN to agronomic N requirement 1.5 1.0 Ratio of total N to agronomic N requirement 2.6 2.5 Ratio of total inorganic-P to agronomic P requirement 2.7 2.2 Ratio of total P to agronomic P requirement 3.6 3.3
Source: The data in this table was computed from extensive information from the Lake Fork reservoir watershed.
aAll fertilizer and manure application rates simulated on an annual basis bPAN = plant available nitrogen
222 JOURNAL OF RANGE MANAGEMENT 56(3) May 2003
Table 3. Mean values of key measured and simulated water quality indicators for the Lake Fork reservoir watershed.
Indicator Site' Number of observations2
Flow (m3sec') 1 133
NO3 (mg liter') 2 31
Soluble P (mg liter') 2 32
Total P (mg liter') 2 32
Sediment (mg liter') 2 30
1 1 and 2.
Monthly streamflow values were measured between September 1978 and September 1989 at site l; nutrient and sediment measurements were performed between 12 April, 1994 and 11 November, 1996.
3Standard deviations reported for the observed and simulated flows were 0.875 and 0.703; standard deviations were not reported for the other indicators.
Consistent with scenario specifications, alternative stocking densities and associat- ed supplemental commercial N fertilizer rates were simulated in the economic model for the lactating and dry cow pas- tures but not for the heifer pastures. Other assumptions were held at baseline specifi- cations. The stocking density simulated for the N scenario is actually higher than the stocking density assumed for the base- line, which suggests that open access graz- ing operations in the watershed generally have adequate land to manage pasture nutrients according to forage N require- ments. Forage N needs were being exceed- ed in the baseline because of commercial fertilizer rates used on pasture. Producers could, therefore, alternatively reduce com- mercial fertilizer rates, maintain current stocking densities, and still achieve rea- sonable pasture nutrient management regarding forage N requirements.
The P-based scenarios require additional pasture area that is currently not owned or farmed by dairies. Thus moving to the P scenarios may present logistical problems in some cases. Based on land availability and farming practices in the study area, it was assumed that dairy producers would purchase rather than lease additional land when they need to increase pasture area beyond existing levels.
Results and Discussions
Model Testing
Testing of the environmental models for watershed baseline conditions built upon previous testing of the models for the Upper North Bosque River watershed, in
which edge-of-field output was compared -60'
with flow, sediment, and nutrient runoff losses at the edge of 8 field plots (Flowers et al. 1996) and watershed-scale model output (that incorporated edge-of-field loadings) was compared with in-stream observations of flow, sediment, and nutri-
ents (Saleh et al. 2000). Monitoring data available for the Lake Fork reservoir
watershed was relatively sparse, consisting of in-stream flow measurements at 1 site and in-stream sediment and nutrient obser- vations at 5 other sites (3 of which were only monitored for 9 days). Watershed- scale model predictions, that included edge-of-field loadings from dairy pastures and hayfields, were compared with flow measurements at sampling site 1 (Fig. 1) for a 10-year period and with sediment and nutrient measurements at sampling site 2 (Fig. 1) for slightly more than 2.5 years (the site with the longest record of in-stream sediment and nutrient observa- tions). Predicted mean values for flow and other indicators compared favorably with observed means (Table 3), with the great- est difference resulting for sediment which was underpredicted by 50%. Further
description of the model comparisons with measured data is provided by S. Neitsch, (1998. Unpublished research data,
Sediment Organic N Soluble N
Blackland Research Center, Temple, Tex.).
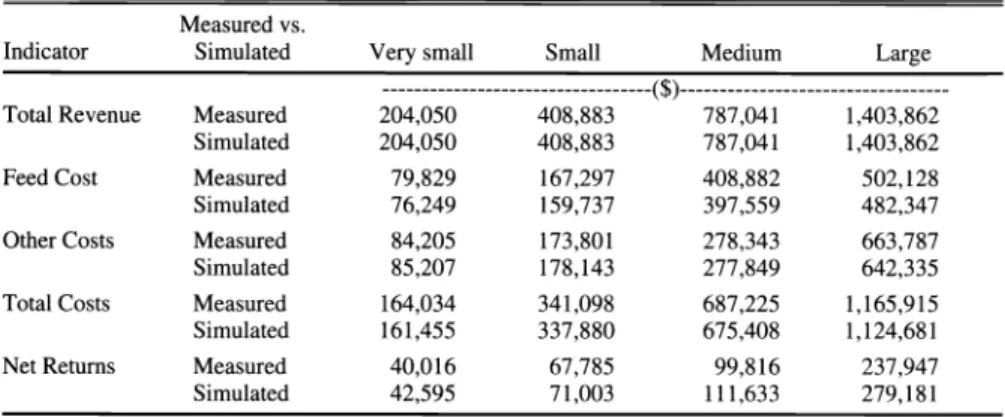
The economic model was also calibrated for the watershed using data pertaining to Hopkins County, which encompasses more than half of the watershed.
Comparisons of simulated and actual val- ues for some economic indicators are given in Table 4. The results indicate that economic model estimates of various indi- cators were reasonably close to measured values. Calibration results are reflective of Hopkins County dairy conditions, rather than the entire watershed. Thus scenario baseline results differ somewhat, as expected, from the calibration output.
Scenario Results
Environmental model simulations were performed for 30 years using daily precip- itation, maximum temperature, and mini- mum temperature data obtained for Sulphur Springs, Texas and other nearby weather stations. Other required weather inputs were generated internally in the environmental models.
Figure 3 shows watershed-scale 30-year average annual baseline loadings, and the resulting impacts of the 3 stocking density scenarios relative to the baseline, for key sediment and nutrient indicators. The results indicate that moderate to signifi- cant reductions in nutrient losses are attainable under all 3 alternative scenarios relative to the baseline. With the exception of N losses for the Low P rate, adopting pasture nutrient management based on for- age N or P needs results unambiguously in
Total N Organic P Soluble P Totai P
Baseline 2 1
values 6,000 tons 88,310 kg 99,890 kg 288,200 kg 22,340 kg Environmental Indicators Fig. 3. Environmental impacts: % changes from baseline values.
36,010 kg 58,350 kg
JOURNAL OF RANGE MANAGEMENT 56(3) May 2003 223