Munich Personal RePEc Archive
Institutional development in Transition
Economies - The role of institutional
experience
Eydam, Ulrich and Gabriadze, Irakli
5 June 2018
Institutional Development in Transition Economies –
The Role of Institutional Experience
*
Eydam, Ulrich
[email protected]
Gabriadze, Irakli
[email protected]
June 5, 2018
We examine the institutional development of a set of transition economies since the
dis-solution of the USSR, with a particular focus on the effect of natural resource dependency,
EU accession and institutional experience. In a cross-sectional analysis these factors show a
significant association with the different dimensions of institutional quality. To provide a more
comprehensive picture of the development and to control for confounding factors, a
Hausman-Taylor estimator on panel data is applied. This analysis confirms the positive relationship
between institutional experience and institutional development; moreover, it also confirms the
positive effects of the EU accession process on institutional development. Finally, resource
dependency, although highly significant in the cross-section, has no significant relationship
with average institutional quality in the panel. However, the panel results suggest that resource
dependency has a negative effect on the quality of political institutions, while it has no
signifi-cant association with administrative or legal institutions. Overall, the analysis highlights the
persistent nature of institutions and indicates that experience of having independent institutions
can affect the pace and path of institutional development.
JEL-Classification: O11, O17, O43, O57, P20, P26, P52
Keywords: Economic Growth, Institutions, Comparative Development, Transition Economies,
Resource curse
*The authors thank James E. Monogan and Temirlan T. Moldogaziev for their helpful comments and
1 Introduction
Over 25 years after the dissolution of the Soviet Union, former member and satellite states (transition economies) have taken different routes in terms of economic and political development.
While some countries have shown rapid economic growth, others lag behind. One potential
explanation for the observed growth differentials is institutional differences across countries.
These differences manifest themselves in different political and economic policies and determine
incentives for citizens to engage in economic activity. Thus, countries with the right set of
institutions prosper and grow, while countries which implement institutions that are less favorable
for growth tend to stagnate. However, this raises the questions of which factors determine the
institutional development of a country, which factors drive the institutions building process, and
why institutions are so persistent in nature.
While there exists a large amount of literature on the relationship between economic growth
and institutions (see for exampleAcemoglu et al.(2005)), rather fewer studies have focused on
the determinants of institutional development (e.g. Beck and Laeven(2006), orSchweickert et
al. (2011)). This paper, contributes to later literature and tests the role of push (internal) and
pull (external) factors for institutional development in transition economies. In particular, the
importance of historical determinants and path dependency, natural resources and accession to
intergovernmental organizations (European Union) in determining institutional quality, are tested.
The basic idea is that the mentioned factors affect the distribution of political and economic power within countries and therefore shape its institutions. The paper closest in topic to this one isBeck
and Laeven(2006), who examine the effect of socialist entrenchment and resource dependence on
institutional and economic development, and document a significant negative effect of both factors.
This paper differs in several dimensions; most strikingly panel data is employed in order to control
for potential unobserved heterogeneity and to provide a more detailed account of the dynamic
effects of the proposed factors. In addition, we focus on the aspect of institutional experience, which
has not yet been examined. Specifically, the importance of the experience of self-administration
before the countries became Soviet states is assessed. The measure of institutional experience
used in this paper has some similarities with the State Antiquity Index developed byBockstette
et al. (2002). However, the measure proposed here captures the existence of an independent
non-Soviet government, while the State Antiquity Index captures general state-level experience
with government.
The experience of transition economies offers several advantages to address questions regarding
institutional development. First of all, these countries started their institution-building processes at
Furthermore, since the dissolution of the USSR, countries have developed in different directions: as
a result, there is substantial variation within economic and institutional factors. To leverage on the
advantages the sample offers and to identify the importance of the proposed factors for institutional
quality in these countries, two steps are taken in proceeding. First, we perform a cross-sectional
regression analysis to test the effects of EU accession, natural resources and institutional experience
on institutional quality. This approach is comparable to previous studies and confirms their results. In addition, we document that the institutional experience of being an independent state is positively
associated with institutional quality today. In the second step, the relationship is analyzed in a panel
framework. This approach allows to control for country specific characteristics and, moreover, for
a more detailed account of the dynamic evolution of institutions. Applying different estimators,
the panel results, by and large, support the evidence of the cross-section. The panel analysis also
suggests that the pre-accession stage and the accession stage are especially important in terms
of institutional development; in contrast, the candidate stage and the post-accession stage show
a smaller impact on institutions. In addition, unlike the cross-section, the panel analysis reveals
that resource dependence is not significantly associated with average institutional quality. This
challenges the idea that the resource curse operates through institutions. However, it is found that resource dependence has a significant negative effect on political institutions.
When discussing institutions, the definition proposed by North (1990) is relied upon, which
states that institutions are the ‘rules of the game’ in a society. According to this broad definition,
institutions shape human interaction by imposing structure, and consequently, determine the cost
and benefits of economic activities. However, political and economic institutions do not evolve
in a vacuum; rather, they are determined in the processes of public debate, negotiations and
compromises, conditional on the economic, political and cultural environment of a country. This
paper examines the importance of institutional experience, natural resources and EU accession for determining institutional development. Two groups of factors are distinguished, namely push
(internal) and pull (external). Push factors refer to a country’s internal political, economic and
cultural aspects which shape its society and institutional framework, while pull factors are those
which influence a country’s institutions from abroad through interaction with other countries or
intergovernmental organizations.
Push factors – Historical determinants and path dependency
One, in principle, internal dimension of factors are historical determinants. As argued by
Ace-moglu et al.(2001), institutional development shows a high degree of path dependency. Institutions
which are in place once are changing slowly, if at all. Hence, historical structures and conditions,
which influence institutions can persist until today. In the context of transition economies,de Melo
institutional and economic development of transition economies. This finding is also supported by
Di Tommaso et al.(2007), who test different potential determinants in a common framework.Beck
and Laeven(2006) test the hypothesis that a stronger entrenchment of socialist elites in combination
with the availability of natural resources gave former elites a superior bargaining position and the
possibility to extract rents from resources without reforming institutions deeply. They find that
years under central planning, their proxy for entrenchment, has a significant negative effect on institutional development in transition economies. This finding confirms that the distribution of
political power plays an important role in the process of institutional development.
In this paper, we propose another historical determinant of institutional quality, namely
in-stitutional experience. Inin-stitutional experience is measured by the time span a country was a
self-administrated, independent, non-Soviet state.1 The argument here is that previous experience
with functioning and stable institutions reduces the cost of building market-compatible institutions.
Furthermore, in a narrow window of opportunity, institutional experience can also speed up
institu-tional development.2 Hence, from a bargaining perspective, institutional experience can enable
citizens to implement institutions before the entrenched elite is able to implement purely extractive institutions. Therefore, countries that could draw on institutional and administrative experience
during the dissolution process were able to implement more efficient institutions in a relatively
shorter time span. In contrast, countries with no previous experience were more susceptible for the
implementation of extractive institutions. Hence, previous experience with institutional design, in
general, can be regarded as an anchor during a turbulent transition period.
A somewhat similar approach has been taken by Bockstette et al.(2002), who construct an
index of State Antiquity, which captures the depth of experience with state-level institutions.
They document high correlations between their index and indicators of political and institutional quality today.3 Furthermore, they find that their index has explanatory power for economic growth,
over and above the effect of the usual growth determinants. However, the measure used differs
conceptually from their index; they focus on the existence of a government above the tribal level
and territorial aspects, hence their measure reflects more general state-level institutions. In contrast,
the measure used in this paper should more closely reflect institutions in a modern sense, taking
into account the existence of an independent non-Soviet government.
1The measure is constructed by counting the number of years of independence from 1918 until a country became a
Soviet state. The methodology is explained in detail in the data section.
2Islam and Montenegro(2002) argue that institution building needs time and that countries with a longer record of
independence should have better institutions.
3In the basic version, the index does not capture the post-communist transition economies. For an extended index,
Beck and Laeven(2006) find no significant relationship between State Antiquity and modern institutions in the
There are two channels through which institutional experience can exert effects on institutional
development. Firstly, there is an indirect effect, which emerges from the collective memory of
societies. If the experience with independent institutions remains deep-rooted in collective memory,
then the public might be more skeptical of the implementation of extractive institutions. The
second channel describes the direct effects which institutional experience can exert on institutional
development. Those direct effects emerge when institutional development is based on previously-installed institutions. For example, the constitutions adopted after independence in countries such
as Estonia, Latvia, Lithuania and Georgia were largely based on the constitutions these countries
had had before they became Soviet states. These are examples wherein countries could directly
draw on their previous institutional experience. However, while the Baltic States could draw on a
relatively longer period of experience, Georgia’s experience with independent institutions was only
a short period between 1918 and 1921. Consequently, the constitution, which was re-implemented
in 1992, had to be adjusted and was finally adopted in 1995. Furthermore, Georgia still struggles
with frequent changes made to the constitution. In contrast, the Baltic States were able to implement
functioning and stable institutions right from the beginning. The case of Georgia illustrates that
institutional experience per se does not guarantee the implementation of efficient institutions, and that the length of the independence period also matters.
Push factors – Natural resources
Another internal dimension potentially affecting institutional quality is dependence on natural
resources. While it seems intuitive that a large endowment of natural resources fosters economic
growth, many economists have challenged this view. In their seminal work,Sachs and Warner
(1995), proposed a resource curse hypothesis, which implies a negative effect of resource
endow-ments on economic growth. However, they do not provide evidence for a connection between the resource curse and institutional development. More recently,Gylfason and Zoega(2006) document
an adverse effect of resource dependence on economic growth, which operates through institutions.
In addition,Mehlum et al. (2006b,a) andRobinson et al. (2006,2014) provide evidence for an
interaction between resource dependence and institutional quality. They argue that countries with
effective institutions should benefit from resource endowments, while countries with a lower
institu-tional quality face a deterioration of economic growth. Finally, as discussed byRoss(2001),Bulte
et al.(2005) andIsham et al.(2005), resource endowments could affect institutional development
directly. In the context of transition economies,Beck and Laeven(2006) test the influence of natural
resource reliance on institution building. According to their results, the reliance on the export of natural resources has a significant negative effect on institutional development. Horvath and
Zeynalov(2016) confirm the presence of a resource curse in post-Soviet countries with low levels
of institutional development. In contrast,Alexeev and Conrad(2011) find no negative effect of
different theories regarding the impact of resource endowments on institutional development, most
theories share a common mechanism. In general, large resource endowments are associated with
an inefficient reallocation of economic and political resources towards the extraction of natural
resources. This shift then leads to a deterioration in economic and political institutions.4
Pull factors – EU accession
Besides the internal factors discussed so far, external factors such as accession to an
intergov-ernmental organization can play an important role in institutional development. Intergovintergov-ernmental
organizations provide economic incentives for potential candidates to implement institutions in
a required way. However, intergovernmental organizations can also be seen as a raw model for
a specific set of institutions and thus lead a candidate to import these institutions. As argued by
Way and Levitsky(2007), this can reduce the costs of institutional development and also accelerate
the institution-building process. Hence, to some extent, relationships with an intergovernmental
organization can be a substitute for a lack of prior experience with institutions. In the context of the
development of transition economies, many studies have treated EU accession merely as a control variable. A more detailed account of the effects of accession to an intergovernmental organization
has been provided bySchweickert et al. (2011). They find that both NATO and EU accession
exert positive effects on the institutional development of transition economies. Sch¨onfelder and
Wagner(2016) assess the role of European integration for the institutional development of transition
economies. Overall, they confirm the positive effect, however they also find evidence of reversals
in institutional development; in particular, the deterioration of institutional quality after joining the
EU.
Overall, there are several dimensions of institutional development which have been examined so far. The goal of the following sections is to put these factors into perspective and provide an
idea of their relative importance in shaping institutions in transition economies. Clearly, those
ideas regarding the quality of institutions are not exclusive: on the contrary, one would most likely
expect those factors to be mutually reinforcing and to depend on each other. Therefore, the aim of
this study is not to provide a definite answer as to which of the aforementioned factors eventually
determines institutional development, but to put the different factors into perspective and assess
their role for determining institutional quality of transition economies.
The remainder of this paper is organized as follows: Section 2 presents the data; Section 3 proceeds with estimation strategy and discusses the empirical findings; and finally Section 4
concludes.
4For example, the theory of rentier effects, delayed modernization and entrenched inequality, for a brief overview
2 Data
The World Governance Indicators (WGI) developed byKaufmann et al. (2010) are used as the
main measure of institutional quality. The data on institutional quality is available for all countries
in the sample from 1996 onward.5 It consists of six indicators, which capture different dimensions
of government perception: (1) Voice and Accountability, (2) Political Stability and Absence of
Violence, (3) Government Effectiveness,(4) Regulatory Quality, (5) Rule of Law, and (6) Control
of Corruption. Those indicators range from−2.5 to 2.5. In order to have an overall measure of
institutions, an unweighted average of these indicators is built.6 Furthermore, the six measures are
grouped into three categories: Political Institutions (1 & 2), Administrative Institutions (3 & 4)
and Legal institutions (5 & 6). For each category the unweighted average of the two indices as a
measure of institutional quality is used.
Years of independence are used as a measure of institutional experience. The measure is
constructed by counting the number of years during which the country was independent after 1918
until a country became a Soviet state (no matter whether it actually joined the Soviet Union or
not). The measure is intended to capture the experience of self-administration, forming functional
institutions and governing an independent sovereign state. The focus is on having experience in
systems which do not correspond to the Soviet system. This experience is important, because
after the dissolution of the Soviet Union, all former Eastern Bloc countries found themselves in
a situation wherein the Soviet economic and political systems were no longer appropriate in a globalized world. The measure is entirely based on the information given in the Encyclopedia
Britannica. The independence status is assigned if the country declared independence and had its
own administration (i.e. its own government) independently from other countries.
Since borders changed frequently and most countries did not exist in today’s borders before
WWI, years of independence are measured from 1918 onwards. As shown in Table1, Russia has
zero years of independence assigned. The reason is that after WWI, Russia adopted the Soviet
constitution, meaning that it became a Soviet state. Therefore, the country had no experience
of self-administration in a system different from the Soviet system. The sample also includes
several countries that were part of smaller unions before they became Soviet states (in some cases, these unions persisted throughout the Soviet era). For example, Croatia, Macedonia and
Slovenia were part of Yugoslavia; Slovakia and Czech Republic constituted Czechoslovakia; and
5Since the WGI data is only available on a two year basis between 1996 and 2002, mean imputation is used to fill the
missing values; a discussion of this can be found inSch¨onfelder and Wagner(2016).
6We also apply the procedure ofWang(2013) and use the first standardized principal component of all indicators
Romania and Moldova (Bessarabia, Bukovina and Transylvania) were part of the Kingdom of
Romania. To determine the years of independence for these countries, we assign weights to each
country according to their respective population shares in the union and multiply it by the years
of independence of the union itself. By applying this rule, we assume that bigger nations in the
union received more knowledge and experience of self-administration than smaller nations. This
assumption builds on the idea that bigger nations were the ones where the capital city was located and representatives of these nations held more positions in public offices. Therefore, we expect
them to get more experience in running the state compared to smaller nations in the union.7
In order to indicate the status or official relationship between the transition countries and the
EU, we follow Sch¨onfelder and Wagner(2016) and use a set of dummy variables. Therefore,
there are five indicators: Potential Candidate for the EU (PCEU), Candidate Country for the EU
(CCEU), Acceding Country for the EU (ACEU), Candidate Country for the euro area (CCEA) and
member state in the euro area (MBEA).8 As a proxy for resource dependence we use the share of
fuel, ores, and metal exports relative to GDP. As a measure of economic development, the average
GDP Growth rate is used. These data series are collected from UNCTAD and the World Bank Development Indicators (WDI) respectively. In the cross section, geographic control variables,
absolute latitude and a landlocked dummy are included. This data stems fromLa Porta et al.(1999)
and the CIA World Factbook webpage respectively. Finally, to control for trade openness we
construct the trade share in GDP from UNCTAD and WDI data.
The data on institutional quality is only available from 1996 onward, therefore the Sample is
restricted from 1996 to 2015. This amounts to a sample of 25 countries with 20 observations per
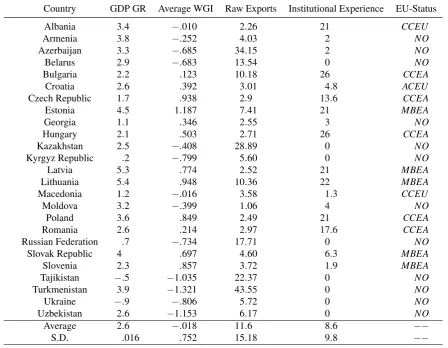
country, and thus gives a total of 500 observations. Table1presents the summary statistics for
the sample. Differences in institutional quality across countries are directly apparent. In 2015, the average institutional quality in Turkmenistan had a rating of−1.321; in contrast Estonia had
an average WGI score of 1.187. One also observes large differences regarding the importance of
resource exports. On average, Turkmenistan generated about 43.5% of its GDP through raw material
exports, while Moldova on average exported raw materials of 1% relative to its GDP. Regarding the
relationship towards the EU, there is again substantial variation across the sample. Estonia, Latvia,
Lithuania, the Slovak Republic and Slovenia became members of the Euro Area. Bulgaria, the
7As a robustness check, we construct years of institutional experience such that the dominant county in the union was
assigned the years and the other countries were assigned zeros. For example, we have assigned zeroes to former Yugoslavian states in our sample, since these countries in the union were dominated by Serbia, and also the center of the union was Belgrade (Serbia). For the Czechoslovakian countries, since the Czech Republic (the dominant country of the union and also the country where the capital was located) is in our sample, we have assigned positive numbers to the Czech Republic and zero to Slovakia. The same rule applied for Romania and Moldova. The regression results using this measure instead of the index are by and large the same.
Country GDP GR Average WGI Raw Exports Institutional Experience EU-Status
Albania 3.4 −.010 2.26 21 CCEU
Armenia 3.8 −.252 4.03 2 NO
Azerbaijan 3.3 −.685 34.15 2 NO
Belarus 2.9 −.683 13.54 0 NO
Bulgaria 2.2 .123 10.18 26 CCEA
Croatia 2.6 .392 3.01 4.8 ACEU
Czech Republic 1.7 .938 2.9 13.6 CCEA
Estonia 4.5 1.187 7.41 21 MBEA
Georgia 1.1 .346 2.55 3 NO
Hungary 2.1 .503 2.71 26 CCEA
Kazakhstan 2.5 −.408 28.89 0 NO
Kyrgyz Republic .2 −.799 5.60 0 NO
Latvia 5.3 .774 2.52 21 MBEA
Lithuania 5.4 .948 10.36 22 MBEA
Macedonia 1.2 −.016 3.58 1.3 CCEU
Moldova 3.2 −.399 1.06 4 NO
Poland 3.6 .849 2.49 21 CCEA
Romania 2.6 .214 2.97 17.6 CCEA
Russian Federation .7 −.734 17.71 0 NO
Slovak Republic 4 .697 4.60 6.3 MBEA
Slovenia 2.3 .857 3.72 1.9 MBEA
Tajikistan −.5 −1.035 22.37 0 NO
Turkmenistan 3.9 −1.321 43.55 0 NO
Ukraine −.9 −.806 5.72 0 NO
Uzbekistan 2.6 −1.153 6.17 0 NO
Average 2.6 −.018 11.6 8.6 −−
[image:10.595.74.523.86.434.2]S.D. .016 .752 15.18 9.8 −−
Table 1: GDP Growth denotes the average growth rate of GDP per capita in percent over the sample period. Average WGI denotes the average WGI score in 2015. Raw exports denotes the average share of ore, metal and fuel exports relative to GDP through the sample period. Years of independence gives the number of years a country has had independent institutions. EU-Status indicates the relationship towards the EU.
Czech Republic, Hungary, Poland and Romania joined the European Union. Albania, Croatia and
Macedonia have signed a treaty of accession or are considered potential candidates. The remaining
countries have no official political association with the EU. The measure of institutional experience
(years of independence) also varies substantially across the sample. While several countries had no
independent institutions before the dissolution, Bulgaria and Hungary have 26 years of institutional
experience. Finally, GDP growth also differs across the sample, while Lithuania’s economy grew
on average at a rate of 5.4% between 1996 and 2016; Ukraine meanwhile, had an average growth
rate of -0.9% during the same time period.
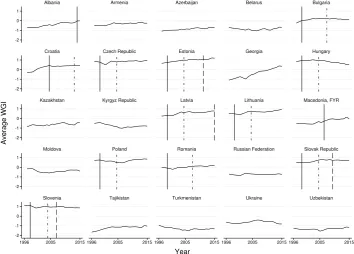
Figure1shows the evolution of institutional quality across countries from 1996 to 2015. The
solid line marks the year in which a country gained candidate status for the EU. The dotted line
shows the year in which a country has joined the EU, therefore, obtains status of candidate for the
euro area and the dashed line indicates membership in the monetary union. It is directly apparent
-2 -1 0 1
-2 -1 0 1
-2 -1 0 1
-2 -1 0 1
-2 -1 0 1
1996 2005 20151996 2005 20151996 2005 20151996 2005 20151996 2005 2015
Albania Armenia Azerbaijan Belarus Bulgaria
Croatia Czech Republic Estonia Georgia Hungary
Kazakhstan Kyrgyz Republic Latvia Lithuania Macedonia, FYR
Moldova Poland Romania Russian Federation Slovak Republic
Slovenia Tajikistan Turkmenistan Ukraine Uzbekistan
Average WGI
[image:11.595.120.475.88.342.2]Year
Figure 1: The graph shows the development of average institutional quality, measured as the unweighted average of the WGI indicators between 1996 and 2015. The vertical lines indicate the relationship towards the EU. The solid line marks the year in which a country has gained candidate status, the dotted line marks the year in which a country has joined the EU, and the dashed line indicates membership in the monetary union.
in institutional quality, others show little development, and some countries display reversals in institutional quality. Furthermore, one directly observes that countries, which gained candidate
status have a higher institutional quality compared to countries which have no official relationship
to the EU. However, some of the reversals in institutional development took place after countries
joined the EU.
Finally, another important aspect of the present sample is that there is clustering along several
dimensions. For example, there is a geographical divide between the countries located in Asia and
Europe, a historical divide between member and satellite states, and a divide between resource-rich
and resource poor countries. Those differences clearly matter for the development of the countries, and might well explain the observed differences in economic and institutional outcomes. It is
very likely that those dimensions are also correlated with other unobservable country-specific
characteristics, which also contributed to the development after the dissolution. For example,
countries located closer to the border of the European Union joined the union faster, but whether
this is a result of geographic proximity or other factors which are correlated to geography is hard to
ascertain. This feature poses a problem for a cross-sectional analysis, where due to the small sample
size those potentially confounding factors cannot be controlled for. Nevertheless, the following
section will present cross-sectional results to provide a more complete picture of the sample and to
3 Estimation
Before we turn to the main model, we want to examine the relationship between the different di-mensions of institutional quality and the aforementioned set of explanatory variables. Furthermore,
it must be established that institutional experience has an effect on the quality of institutions after
the dissolution period. Therefore, we begin by analyzing the correlation between the explanatory
variables and institutional quality.
Avg. WGI Political Administrative Legal Inst. Experience EU Resources
Avg. WGI 1
Political 0.825∗∗∗ 1
Administrative 0.894∗∗∗ 0.937∗∗∗ 1
Legal 0.743∗∗∗ 0.940∗∗∗ 0.895∗∗∗ 1
Inst. Experience 0.682∗∗∗ 0.634∗∗∗ 0.622∗∗∗ 0.501∗ 1
EU 0.806∗∗∗ 0.875∗∗∗ 0.822∗∗∗ 0.810∗∗∗ 0.762∗∗∗ 1
Resources -0.564∗∗ -0.460∗ -0.536∗∗ -0.458∗ -0.373 -0.356 1
[image:12.595.65.528.222.342.2]∗p<0.05,∗∗p<0.01,∗∗∗p<0.001
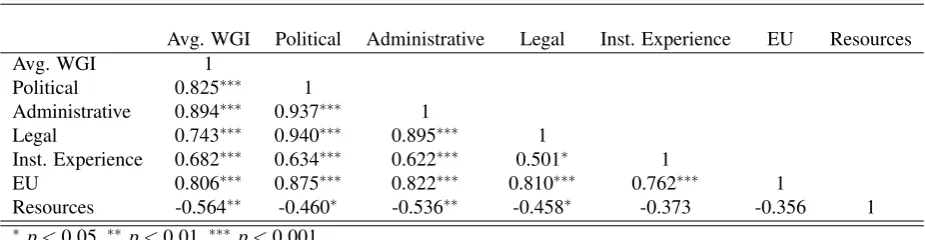
Table 2: The correlation matrix shows the correlation between the dependent variables and the main factors outlined in the discussion. Avg. WGI is the average of all six WGI indicators in 2015, Political refers to the average of Voice and Accountability and Political Stability in 2015, Administrative refers to the average of Government Effectiveness and Regulatory Quality in 2015 and Legal refers to the average of Rule of Law and Control of Corruption in 2015. Inst. Experience represents the measure of institutional experience, EU represents EU membership and Resources refers to the measure of resource dependence.
Table2shows the correlation matrix of the main variables. EU membership has a high positive
correlation of 0.8 to 0.87 with all measures of institutional quality. In contrast, resource dependency
has a moderate negative correlation of -0.56 with average institutional quality and somewhat
smaller negative correlations of -0.53 with administrative institutions, -0.46 with legal institutions
and -0.46 with political institutions. Furthermore, we observe that there is a positive correlation
between institutional experience and average institutional quality of 0.68. The correlation between
institutional experience and political institutions is 0.63 and 0.62 between institutional experience and administrative institutions. Moreover, correlation between institutional experience and legal
institutions is smaller, with a correlation coefficient of 0.5. Institutional experience also shows a
high positive correlation with EU membership. To some extent this might indicate that countries
with more institutional experience were more likely to join the EU. As expected, all measures of
institutional quality show a high positive correlation with each other. Overall, the correlation matrix
indicates that the relationship between the explanatory variables and institutional quality runs into
Determinants of institutions – cross-section
While the correlation matrix indicates that there is a relationship between the variables of
interest, this should be interpreted with caution. As argued, within the sample there are several
dimensions along which clustering is taking place. Hence, in order to find the effect of each factor
of interest while controlling for other variables, we run a cross-sectional regression which includes economic and geographical control variables. However, due to the sample size, only two controls
at a time are included. The dependent variable here is average institutional quality in 2015. This
yields the following regression specification:
Yi=β0+β1Xi+β2Z1,i+β3Z2,i+εi
whereYidenotes the measure of institutional quality in 2015,Xidenotes the variable of interest,
Z1,iandZ2,idenote the control variables andεidenotes the residuals. In all estimations we apply
bootstrapping with 200 replications.
(1) (2) (3) (4) (5) (6)
VARIABLES Average WGI Average WGI Average WGI Average WGI Average WGI Average WGI
Inst. Experience 0.0456*** 0.0422***
(0.0149) (0.0131)
EU 1.138*** 1.105***
(0.223) (0.197)
Resources -0.0393*** -0.0308***
(0.0112) (0.0110)
Constant -1.057*** -0.545 -0.727 -1.242 -0.257 -1.397
(0.396) (0.395) (0.469) (1.233) (0.968) (1.192)
Observations 25 25 25 25 25 25
R-squared 0.515 0.667 0.575 0.554 0.716 0.479
Standard Errors Bootstrapped Bootstrapped Bootstrapped Bootstrapped Bootstrapped Bootstrapped
Controls ECON ECON ECON GEO GEO GEO
Standard errors in parentheses
[image:13.595.69.546.354.556.2]*** p<0.01, ** p<0.05, * p<0.1
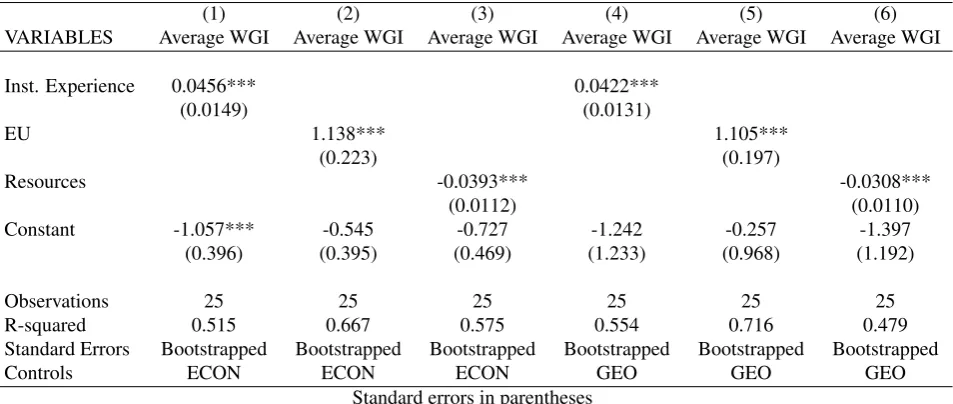
Table 3: Average WGI denotes the average of the six components of the World Governance Indicators, Inst. Experience denotes institutional experience measured as years of independence. EU denotes EU membership and Resource denotes resource dependency measured as raw material exports over GDP. The control variables for ECON are average GDP growth between 1995 and 2015 and openness, measured as the sum of imports and exports over GDP. The control variables for GEO are absolute latitude and Landlocked.
Table3shows the results of the cross-sectional regression. It is apparent that the three factors,
outlined above, possess the expected sign and are statistically significant. Column (1) shows that
having one more year of institutional experience is on average associated with a 0.046 points higher
average institutional quality in 2015. Column (2) shows that being an EU member is on average
associated with a 1.1 points higher average institutional quality, and column (3) shows that a 1
average institutional quality. It is found that all coefficients are significantly different from zero on
a 1% level when controlling for average GDP growth and openness. Column (4) shows that, when
controlling for geographic factors, the association between institutional experience and average
institutional quality reduces to 0.042 but is still highly significant. Column (5) shows that the
association between EU membership and institutional quality remains stable and highly significant
when controlling for geographic factors. Finally, column (6) shows that the association between resource dependency and average institutional quality decreases in magnitude but is still significant
on a 1% level when changing the control variables. Overall, the results show that all factors possess
a significant association with average institutional quality, even when controlling for confounding
economic and geographic factors. Furthermore, it is apparent that there is a clear divide between
EU members and non-members, which amounts to more than a one standard deviation difference
in average institutional quality. Also, the effect of institutional experience and resource dependence
seem to play a role in institutional development.
RUS UKR SVN BLR KAZMDA GEOHRV KGZ
UZBTKMTJK
MKD AZE ARM SVK EST LVA CZE LTUPOL ROUALB HUNBGR -1. 5-1 -.5 0 .5 1
-20 -10 0 10 20
e( Inst. Experience | GEO ) coef = .04025636, se = .01183039, t = 3.4
TKM
ARMMDA
UZBBLRAZEKAZ SVN
SVKHRV
RUSMKDKGZ
GEO
TJKUKR
LVALTU
CZE
ESTPOL
ALB ROU BGRHUN
-2
-1
0
1
-10 0 10 20
e( Inst. Experience | ECON ) coef = .04408206, se = .01247383, t = 3.53
RUS BLR
UKR
KAZMDAHRVGEOALB
MKD KGZ UZB AZEARM TKMTJK EST
LVALTU POL
CZESVK
ROU
SVNHUNBGR
-1. 5-1 -.5 0 .5 1
-1 -.5 0 .5 1
e( EU | GEO ) coef = 1.1052404, se = .19766868, t = 5.59
TKM
MDABLR AZEARM
ALB KAZ
HRVMKD
UZB GEO
KGZTJKUKRRUS
ESTLTU
SVKLVA HUNSVNBGR
CZEPOL ROU -2 -1 0 1
-1 -.5 0 .5 1
e( EU | ECON ) coef = 1.1381102, se = .21835617, t = 5.21
MDA
HUNCZE
MKDARMSVK
KGZ UZB
ALBGEOPOL
BGR
LVAROUHRV
SVN UKRBLR ESTLTU TJK RUS KAZ AZE TKM -1. 5-1 -.5 0 .5 1
-10 0 10 20 30
e( Resources | GEO ) coef = -.03082715, se = .01129109, t = -2.73
MDA HUN
CZE LVAGEOSVNALBSVKPOLHRVMKDROU
ARMKGZUKR
EST
UZB
LTUBGR
BLR
RUSTJK KAZ
AZE TKM -2 -1 0 1
-10 0 10 20 30
e( Resources | ECON ) coef = -.03929225, se = .00960044, t = -4.09
[image:14.595.99.491.337.603.2]e ( A verage W G I | X )
Figure 2: Adjusted partial residual plot of the models presented in table3. The top panels depict the specification
with institutional experience and geographic control variables (left) and economic control variables (right). The mid panels depict the specification with EU membership and geographic control variables (left) and economic control variables (right). The bottom panels depict the specification with resource dependence and geographic control variables (left) and economic control variables (right).
In order to illustrate the fit of the model, Figure 2 presents adjusted partial residual plots
of the regression. It is apparent that the models fit the data rather well. However, it is also
institutional experience and EU membership, clustering is directly apparent when considering
resource dependency. A large group of countries is exporting almost no raw materials, which
probably just reflects the lack of available natural resources in these countries. Furthermore, for
all variables some outliers are still present. However, removing the outliers from the sample does
not alter the regression results. Normality of the errors is also tested for, as is the presence of
heteroscedasticity and other potential misspecifications. The usual tests do not indicate problems with the proposed specification for EU membership and institutional experience, but the normality
of the residuals is rejected for resource dependence. Hence, results regarding resource dependence
should be taken more cautiously.9
The relationship between the set of explanatory variables and different dimensions of
institu-tional quality is also examined, and for reasons of clarity the regression tables are delegated to
appendix A.1. By and large the results are in line with those presented in Table3. However, some
findings are at least noteworthy. Regarding institutional experience, we find that the association
with political and administrative institutions is comparable to the association between institutional
experience and average institutional quality. However, the association between institutional experi-ence and legal institutions is weaker and statistically significant on a 5% level. With respect to EU
membership, the results for the different dimensions of institutional quality are comparable to the
results presented in Table3. Finally, the findings regarding the effect of resource dependency on the
different dimensions of institutional quality are mixed. We find that resource dependency possesses
the expected sign in all regressions, yet when controlling for geographic factors, the significance of
the association between resource dependency and the quality of legal institutions reduces to 5%.
Moreover, when considering the association between political institutions and resource dependency,
the significance level reduces further to 10%. Those differences in the significance levels potentially
result from the aforementioned clustering. Additionally, to account for the possibility that our results regarding institutional experience are driven by the divide between member countries and
satellite states, we run a regression and control for membership in the Soviet Union separately in
addition to economic and geographic controls. By and large, the results remain unchanged. The
main difference in comparison to the results in Table3is that the association between institutional
experience and legal institutions is statistically not significant, nor is the association between
re-source dependence and political institutions. The coefficient on EU membership remains significant
in all regressions but decreases in magnitude. Finally, for comparison, the effect of including the
state antiquity index ofBockstette et al. (2002) is also tested, and it is found that the index has
no significant relationship with institutional quality in the sample. Furthermore, when including the state antiquity index as a control, the positive association between institutional experience and
institutional quality remains statistically significant on a 5% level.
Determinants of institutions – panel
While the cross-sectional approach has revealed some effects it has several potential
shortcom-ings. From a data perspective, a cross-sectional approach does not utilize all available information.
In the present context, this is especially important, since institutional quality is not evolving
monotonically. As documented bySch¨onfelder and Wagner(2016), institutional development also exhibits reversals: for example, control of corruption exhibited reversals after countries became
member of the EU. Therefore, observing the overall trend alone might be misleading. Another
problem with the cross-sectional approach is omitted country-specific characteristics. As outlined
before, clustering takes place along several dimensions, and while we try to capture some aspects
which could affect institutional development in the cross-section, it might well be the case that there
are additional factors which we cannot control for. Panel data offers the possibility to eliminate
this potential confounding factors. Therefore, to give a more nuanced picture of the influence of
the factors on institutional development and to control for omitted variables, we use the additional
time-series information and estimate a panel model.
An important aspect of the estimation involves the choice of the estimator. In the given context,
with a small cross-sectional dimension (n=25), this is especially problematic. The fixed-effects estimator offers the possibility to control for time invariant country specific characteristics: however
by construction, the fixed-effects estimator renders the estimation of time invariant regressors
impossible. An alternative is the estimator proposed byHausman and Taylor(1981), which allows
to control for country-specific characteristics and provides estimates of time invariant regressors.
Furthermore, it has the additional advantage that it can also address the problem of reversed
causality by using internal instruments. Therefore, we followSchweickert et al.(2011) and apply a
Hausman-Taylor estimator. The estimation equation will be:
yit =x1,itβ1+x2,itβ2+z1,itδ1+z2,itδ2+µi+εit
whereµidenotes the country-specific characteristics,x1,it is a vector containing the time-varying
exogenous variables, the vectorx2,it includes all time-varying endogenous regressors,z1,it includes
all exogenous time-invariant variables, and finallyz2,it includes the endogenous time-invariant
variables. The Hausman-Taylor estimator allows for correlation between the endogenous variables
and the country-specific characteristics, however all components must be uncorrelated with the
idiosyncratic errorεit. The approach builds upon a two-stage estimation strategy, where on the first
stage the within-estimator is used to obtain consistent estimates ofβ1andβ2. On the second stage,
after a GLS transformation, exogenous variables serve as their own instruments. The time-varying
endogenous variables are instrumented by their deviation from individual means as in the fixed
average of the exogenous time-varying regressors. In the given context, the estimator should yield
consistent results.
The dependent variables are average institutional quality and the other dimensions of
institu-tional quality. We follow the literature and treat the early accession status ofPCEU andCCEU
as exogenous. Furthermore, we argue thatMBEA(membership in the European monetary union)
can also be treated as exogenous, since EU members are designated to join the common currency.
Resource dependency is included as an endogenous variable. In addition, the economic control
variables, cumulative GDP growth and trade openness are treated as endogenous. This choice
reflects the widely-accepted reversed causality between economic factors and institutional quality.
Since an LR test indicates the presence of heteroscedasticity, clustered standard errors are used.
(1) (2) (3) (4)
VARIABLES Average WGI Legal Inst. Administrative Inst. Political Inst.
Inst. Experience 0.0289*** 0.0241** 0.0289*** 0.0327***
(0.00847) (0.00935) (0.00915) (0.00832)
PCEU 0.249*** 0.252*** 0.262*** 0.246***
(0.0604) (0.0690) (0.0399) (0.0772)
CCEU 0.510*** 0.481*** 0.551*** 0.523***
(0.0823) (0.0943) (0.0666) (0.101)
ACEU 0.599*** 0.575*** 0.660*** 0.588***
(0.102) (0.107) (0.0993) (0.117)
CCEA 0.615*** 0.602*** 0.713*** 0.556***
(0.106) (0.134) (0.105) (0.113)
MBEA 0.665*** 0.678*** 0.762*** 0.587***
(0.126) (0.170) (0.129) (0.125)
Resources -0.00259 -0.00109 -0.00116 -0.00571**
(0.00269) (0.00282) (0.00370) (0.00228)
Growth 0.152 -0.174 -0.183 0.820***
(0.223) (0.254) (0.305) (0.211)
Openness 0.000553 0.000561 0.000378 0.000752
(0.00155) (0.00203) (0.00181) (0.00116)
Constant -0.688*** -0.806*** -0.602*** -0.661***
(0.139) (0.155) (0.176) (0.120)
Observations 422 422 422 422
Number of Countries 25 25 25 25
Standard Errors Clustered Clustered Clustered Clustered
Hansen J (p-value) .2617 .2933 .2535 .2559
Waldchi2 169.5 134.6 563.4 242.6
Robust standard errors in parentheses
[image:17.595.113.490.293.647.2]*** p<0.01, ** p<0.05, * p<0.1
Table 4 shows the results of the estimation.10 Column (1) shows the results with average
institutional quality as dependent variable. Regarding the effects of EU accession the panel is inline
with the cross section. It is found that potential candidates have on average a 0.25 points higher
average institutional quality compared to non-candidates. The effect of being a candidateCCEU
is almost twice as large and also significant on a 1% level, and there seems to be little difference
in average institutional quality between countries that already joined the European UnionCCEA
and countries in the pre-accession stageACEU; both coefficients are similar in magnitude, and
statistically significant on a 1% level. Members of the monetary unionMBEAhave on average a
0.67 higher average institutional quality compared to non-candidates. With respect to resource
dependence, the panel does not confirm the cross-section. While resource dependence has the
expected negative sign, the coefficient is not statistically significant. Finally, it is observed that
institutional experience has a significant positive effect on institutional quality.
When the dependent variables are legal or administrative institutions, column (2) and (3)
re-spectively, the general pattern is the same. Here it seems noteworthy that administrative institutions
benefit more from being in the EU accession process compared to legal institutions. Again, resource dependence possesses the expected negative sign but is statistically not significant. Institutional
experience has a statistically significant effect on both measures, although when considering the
quality of legal institutions the coefficient is only significant on a 5% level. Column (4) shows
the estimation results with political institutions as dependent variable. The results with respect to
the EU status variables are comparable to the previous results. However, in contrast to the other
specifications, a statistically significant negative effect of resource dependence on the quality of
political institutions is found. According to Hansen’s J statistic, the validity of the overidentification
restrictions imposed by the HT estimator cannot be rejected.
Overall, the cross section and the panel show that EU accession is an important determinant
of institutional quality in this subset of transition economies. While several studies already
documented this for EU membership in general, we followedSch¨onfelder and Wagner (2016)
and established that this also holds for different stages of the accession process. We find that all
stages of the EU accession are associated with significantly higher institutional quality compared
to non-candidates. In addition, this approach elucidates that the early stages of accession seem to
be more important for institutional development compared to later stages. Furthermore, the results
regarding the relationship between resource dependency and political institutions are notable. Using
the same estimator,Schweickert et al.(2011) find no significant effect of resource endowments on institutional development. This might either depend on the choice of variable (they use an
endowment dummy), or on the shorter sample length. Furthermore, they focus only on average
institutional quality, where we cannot find a significant effect either.Alexeev and Conrad(2011) use
a cross-sectional setup and also find a negative relationship between voice and accountability and
resource endowments in a larger sample of countries. Our findings support the idea that resource
dependence does not per se deteriorate the quality of institutions but has a negative effect on the
quality of political institutions. This potentially reflects the need for efficient administration and
a coherent legal framework in resource-rich countries, while in contrast, elites in those countries have no reason to facilitate political participation. Finally, the results of the cross-section and the
panel also support the idea that institutional experience is important in shaping modern institutions.
This can, at least partly, explain the persistent nature of institutions and the divergence in terms of
institutional quality within the sample.
4 Conclusion
It has now been 25 years since the transition economies started the process of transformation from
the Soviet economic and political system towards more liberal and market-oriented structures.
Although these countries had almost identical starting conditions in terms of economic and
insti-tutional development, the transition process was different for every country. For some of them,
the process was relatively smooth: they managed to quickly put in place stable and functioning
institutions which supported fast and sustainable economic development. Other countries, however,
found themselves in a long and painful process of transition with poor and unstable institutions
and slow economic development (even stagnation in some cases). As a result, today, two and a
half decades later, significant differences in levels of economic and institutional developments are observed in these countries.
In this paper, we assess the role of different internal and external political and economic factors
in shaping institutions in 25 transition economies. A novel aspect of our approach is the focus on
institutional experience, which we define as years of independent non-Soviet governance. A
cross-sectional analysis confirms the findings of previous studies with respect to the relationship between
EU membership and resource dependency. Furthermore, it reveals that the proposed measure
of institutional experience has a statistically significant positive association with institutional
quality. However, the limitations of the cross-sectional approach in the present context do not allow for a more sophisticated analysis, therefore we also utilize the time dimension and examine the
relationship in a panel setup.
accession and institutional experience on institutional development, we do not find a statistically
significant relationship between resource dependence and average institutional quality; however,
when we focus on the different dimensions of institutions, this pattern changes. Whereas, we find
no statistically significant association between legal or administrative institutions and resource
dependence, there is a significant negative relationship between the quality of political institutions
and resource dependence. One rationale for these findings could be that elites in resource-rich countries need to implement legal and especially administrative institutions in order to be able to
exploit resources and to consolidate their power. In contrast, political participation could undermine
their power and threaten their ability to fully exploit a country’s resource endowments. In the
discussion centered on the relationship between the resource curse and institutional quality, this
result might explain parts of the contradictory findings.
The findings regarding the importance of institutional experience in shaping institutional
struc-tures support the idea of highly persistent institutions. From a policy perspective, the findings
suggest that countries with a lack of experience in terms of institutions building should be
particu-larly targeted for assistance during the early stages of the institution-building process. Furthermore, the availability of requirements and the prospects of becoming a member of intergovernmental
organization could complement any given assistance, and partly substitute the missing experience
of those countries. Our analysis has revealed that rather short periods with independent and
func-tioning institutions could potentially serve as an anchor for institutional quality, and thus foster the
Appendix A.1: Robustness Checks
This Appendix presents some of the additional regressions and robustness checks discussed in the
paper. Tables5to7depict the additional cross-sectional regressions with different dimensions of
institutional quality as dependent variables.
(1) (2) (3) (4) (5) (6)
VARIABLES Legal Inst. Administrative Inst. Political Inst. Legal Inst. Administrative Inst. Political Inst.
Inst. Experience 0.0325** 0.0367*** 0.0434*** 0.0320** 0.0446*** 0.0452***
(0.0163) (0.0135) (0.0146) (0.0139) (0.0154) (0.0119)
Constant -2.440* -3.021** -2.669* -1.820*** -1.587*** -1.736***
(1.390) (1.221) (1.401) (0.415) (0.459) (0.387)
Observations 25 25 25 25 25 25
R-squared 0.313 0.553 0.500 0.391 0.493 0.535
Standard Errors Bootstrapped Bootstrapped Bootstrapped Bootstrapped Bootstrapped Bootstrapped
Controls GEO GEO GEO ECON ECON ECON
[image:21.595.80.517.174.291.2]Standard errors in parentheses *** p<0.01, ** p<0.05, * p<0.1
Table 5: Legal Inst., Administrative Inst. and Political Inst. denotes the measure of legal administrative and political institutions respectively. Inst. Experience denotes institutional experience measured as years of independence. Economic controls are Growth which stands for the average GDP growth between 1995 and 2015 and Openness, measured as the sum of imports and exports over GDP. The control variables for GEO are absolute latitude and Landlocked.
(1) (2) (3) (4) (5) (6)
VARIABLES Legal Inst. Administrative Inst. Political Inst. Legal Inst. Administrative Inst. Political Inst.
EU 1.184*** 1.073*** 1.332*** 1.112*** 1.197*** 1.315***
(0.255) (0.204) (0.180) (0.238) (0.238) (0.166)
Constant -1.280 -2.030** -1.420* -1.337*** -1.053*** -1.155***
(0.875) (0.844) (0.827) (0.288) (0.408) (0.238)
Observations 25 25 25 25 25 25
R-squared 0.661 0.741 0.783 0.678 0.689 0.786
Standard Errors Bootstrapped Bootstrapped Bootstrapped Bootstrapped Bootstrapped Bootstrapped
Controls GEO GEO GEO ECON ECON ECON
Standard errors in parentheses *** p<0.01, ** p<0.05, * p<0.1
Table 6: Legal Inst., Administrative Inst. and Political Inst. denotes the measure of legal administrative and political institutions respectively. EU denotes EU membership status. Economic controls are Growth which stands for the average GDP growth between 1995 and 2015 and Openness, measured as the sum of imports and exports over GDP. The control variables for GEO are absolute latitude and Landlocked.
Table8presents results of the panel regression. The model is identical to the model discussed
in the text. Column (1) to (4) are estimated using a fixed-effects estimator and controlling for
cumulative GDP growth and openness. We find that all EU accession indicators are statistically significant on a 1% level. Again we do not find a significant effect of resource dependence on
institutional quality, nor on the more specific measures of institutions (legal or administrative).
However, also the fixed-effects panel shows a significant negative association between resource
[image:21.595.86.514.387.504.2](1) (2) (3) (4) (5) (6) VARIABLES Legal Inst. Administrative Inst. Political Inst. Legal Inst. Administrative Inst. Political Inst.
Resources -0.0299** -0.0321*** -0.0294* -0.0321*** -0.0393*** -0.0360***
(0.0141) (0.0109) (0.0178) (0.00839) (0.0110) (0.0107)
Constant -2.521* -3.124*** -2.844** -1.557*** -1.258** -1.428***
(1.322) (1.153) (1.421) (0.455) (0.555) (0.499)
Observations 25 25 25 25 25 25
R-squared 0.334 0.556 0.410 0.484 0.560 0.543
Standard Errors Bootstrapped Bootstrapped Bootstrapped Bootstrapped Bootstrapped Bootstrapped
Controls GEO GEO GEO ECON ECON ECON
[image:22.595.86.515.112.228.2]Standard errors in parentheses *** p<0.01, ** p<0.05, * p<0.1
Table 7: Legal Inst., Administrative Inst. and Political Inst. denotes the measure of legal administrative and political institutions respectively. Resource denote resource dependency measured as raw material exports over GDP. Economic controls are Growth which stands for the average GDP growth between 1995 and 2015 and Openness, measured as the sum of imports and exports over GDP. The control variables for GEO are absolute latitude and Landlocked.
(1) (2) (3) (4)
VARIABLES Average WGI Legal Inst. Administrative Inst. Political Inst.
PCEU 0.229*** 0.226*** 0.239*** 0.222***
(0.0626) (0.0720) (0.0410) (0.0783)
CCEU 0.474*** 0.430*** 0.511*** 0.481***
(0.0801) (0.0867) (0.0635) (0.100)
ACEU 0.561*** 0.522*** 0.618*** 0.544***
(0.0965) (0.0976) (0.0921) (0.112)
CCEA 0.576*** 0.546*** 0.670*** 0.511***
(0.103) (0.126) (0.101) (0.111)
MBEA 0.621*** 0.615*** 0.712*** 0.535***
(0.127) (0.170) (0.129) (0.124)
Resources -0.00230 -0.000698 -0.000837 -0.00537** (0.00267) (0.00281) (0.00371) (0.00222)
Growth 0.146 -0.183 -0.190 0.812***
(0.223) (0.252) (0.305) (0.213)
Openness 0.000513 0.000499 0.000335 0.000705
(0.00155) (0.00203) (0.00181) (0.00116) Constant -0.413*** -0.564*** -0.322** -0.353***
(0.122) (0.154) (0.141) (0.100)
Observations 422 422 422 422
R-squared 0.204 0.154 0.182 0.173
Number of id 25 25 25 25
Standard Errors Clustered Clustered Clustered Clustered Robust standard errors in parentheses
*** p<0.01, ** p<0.05, * p<0.1
[image:22.595.151.446.389.654.2]Appendix A.2: Diagnostics
This section presents regression diagnostics for the cross-sectional analysis. First, we turn to the
models in table3.
Normality of the residuals
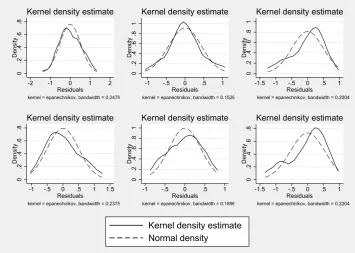
Figure3presents kernel density plots of regression3.
0 .2 .4 .6 .8 Densit y
-2 -1 0 1 2
Residuals
kernel = epanechnikov, bandwidth = 0.2478
Kernel density estimate
0 .2 .4 .6 .8 1 Densit y
-1 -.5 0 .5 1 Residuals
kernel = epanechnikov, bandwidth = 0.1526
Kernel density estimate
0 .2 .4 .6 .8 1 Densit y
-1.5 -1 -.5 0 .5 1 Residuals
kernel = epanechnikov, bandwidth = 0.2004
Kernel density estimate
0 .2 .4 .6 .8 Densit y
-1 -.5 0 .5 1 1.5 Residuals
kernel = epanechnikov, bandwidth = 0.2375
Kernel density estimate
0 .2 .4 .6 .8 1 Densit y
-1 -.5 0 .5 1 Residuals
kernel = epanechnikov, bandwidth = 0.1896
Kernel density estimate
0 .2 .4 .6 .8 Densit y
-1.5 -1 -.5 0 .5 1 Residuals
kernel = epanechnikov, bandwidth = 0.2204
Kernel density estimate
Kernel density estimate Normal density
Figure 3: Shows the kernel density plots of the residuals for the regressions in table 3.
It is apparent that the assumption of normality of the residuals might not hold.While the
residuals of the regressions with EU membership and institutional experience appear rather normally
distributed, the regressions with resource dependence seem particularly problematic. In order to examine this further, the following table presents results of the Sapiro-Wilk test for normality.
Model Shapiro-Wilk W Pr>z
Column 1 .97 .83455
Column 2 .98 .93952
Column 3 .93 .11371
Column 4 .96 .42767
Column 5 .95 .29716
Column 6 .91 .03861
[image:23.595.120.476.254.507.2]but does not hold in specification (6). In order to overcome potential problems resulting from
non-normality of the errors and to address the small sample size we use bootstrapped standard
errors.
Homoscedasticity
In order to detect potential heteroscedasticity we apply the Breusch-Pagan test for heteroscedasticity. The following table presents the p-values of that test for different specifications.
Model χ2 Pr>χ2
Column 1 .2 .6460
Column 2 1.86 .1722
Column 3 .72 .3950
Column 4 .58 .4479
Column 5 .77 .3808
Column 6 .97 .3243
Overall, heteroscedasticity does not seem to play a role here.
Multicollinearity
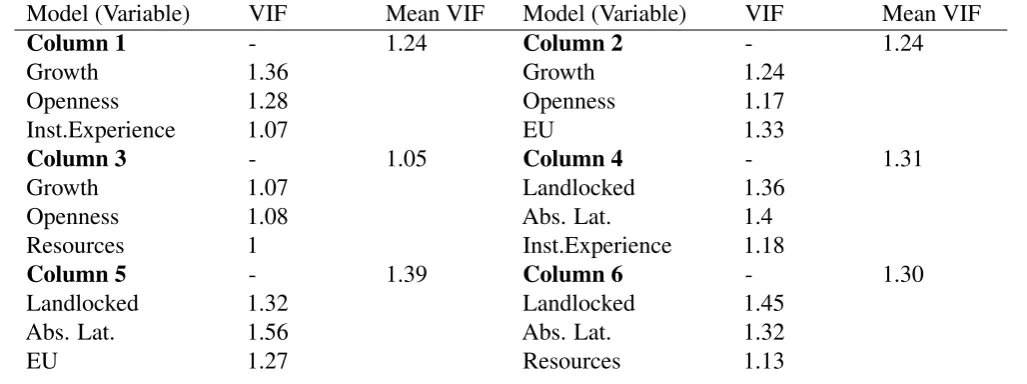
[image:24.595.58.572.440.632.2]In order to detect multicollinearity we compute the VIF for the regressions in3. The following table presents the VIFs:
Model (Variable) VIF Mean VIF Model (Variable) VIF Mean VIF
Column 1 Growth Openness Inst.Experience -1.36 1.28 1.07
1.24 Column 2
Growth Openness EU -1.24 1.17 1.33 1.24 Column 3 Growth Openness Resources -1.07 1.08 1
1.05 Column 4
Landlocked Abs. Lat. Inst.Experience -1.36 1.4 1.18 1.31 Column 5 Landlocked Abs. Lat. EU -1.32 1.56 1.27
1.39 Column 6
Landlocked Abs. Lat. Resources -1.45 1.32 1.13 1.30
Appendix A.3: Data
Variable Description Source
Inst. Experience Number of years country was independent
from 1918 until Soviet
Based on Encyclopedia
Bri-tannica
Average WGI Unweighted average of the six World Bank
Worldwide Governance Indicators
(WB-WGI): Voice and Accountability, Political
Stability and Absence of Violence,
Gov-ernment Effectiveness, Regulatory Quality,
Rule of Law, and Control of Corruption
World Bank Worldwide
Gov-ernance Indicators website
Legal Inst. Unweighted average of the two WBWGI:
Rule of Law and Control of Corruption
World Bank Worldwide
Gov-ernance Indicators website
Administrative Inst. Unweighted average of the two WBWGI:
Government Effectiveness and Regulatory
Quality
World Bank Worldwide
Gov-ernance Indicators website
Political Inst. Unweighted average of the two WBWGI:
Voice and Accountability and Political
Sta-bility and Absence of Violence
World Bank Governance
Indi-cators website
PCEU Potential Candidate for the EU Sch¨onfelder and Wagner
(2016)
CCEU Candidate Country for the EU Sch¨onfelder and Wagner
(2016)
ACEU Acceding Country for the EU Sch¨onfelder and Wagner
(2016)
CCEA Candidate Country for the euro area Sch¨onfelder and Wagner
(2016)
MBEA Member state in the euro area Sch¨onfelder and Wagner
(2016)
EU EU membership status EU webpage
Resources Share of fuel, ores, and metal exports
rela-tive to GDP
UNCTAD
Landlocked Landlocked dummy; Takes value 1 if the
country is landlocked, otherwise zero
Variable Description Source
Absolute latitude Absolute latitude La Porta et al.(1999)
Openness Export and import of goods and services
over current GDP
UNCTAD and World
Devel-opment Indicators
GDP Growth Average growth rate of GDP between 1995
and 2015
World Development
Indica-tors
Growth Geometric mean of the last three years
GDP growth rate
References
Acemoglu, Daron, Simon Johnson, and James A. Robinson, “The Colonial and Origins of
Comparative and Development: An and Empirical Investigation,”American Economic Review,
December 2001,91(5), 1369 – 1401.
, , and , “Institutions as a fundamental cause of long-run growth,” in Philippe Aghion and
Steven N. Durlauf, eds.,Handbook of Economic Growth, Vol. 1A, Elsevier, 2005.
Alexeev, Michael and Robert Conrad, “The natural resource curse and economic transition,”
Economic Systems, 2011,35, 445–461.
Beck, Thorsten and Luc Laeven, “Institution building and growth in transition economies,”
Journal of Economic Growth, jun 2006,11(2), 157–186.
Bockstette, Valerie, Areendam Chanda, and Louis Putterman, “States and Markets: The
Ad-vantage of an Early Start,”Journal of Economic Growth, 2002,7, 347–369.
Bulte, Erwin H., Richard Damania, and Rober T. Deacon, “Resource Intensity, Institutions,
and Development,”World Development, 2005,33(7), 1029–1044.
Campos, Nauro F., Ahmad Saleh, and Vitaliy Kuzeyev, “Dynamic ethnic fractionalization and
economic growth,” Journal of International Trade & Economic Development, 2011, 20 (2),
129–152.
de Melo, Martha, Cevdet Denizer, Alan Gelb, and Stoyan Tenev, “Circumstance and Choice:
The Role of Initial Conditions and Policies in Transition Economies,”World Bank Economic
Review, 2001,15(1), 1–31.
Di Tommaso, Maria L., Martin Raiser, and Melvyn Weeks, “Home Grown or Imported? Initial
Conditions, External Anchors and the Determinants of Institutional Reform in the Transition
Economies,”The Economic Journal, April 2007,117, 858–881.
Egorov, Georgy, Sergei Guriev, and Konstantin Sonin, “Why Resource-poor Dictators Allow
Freer Media: A Theory and Evidence from Panel Data,”American Political Science Review,
Gylfason, Thorvaldur and Gylfi Zoega, “Natural Resources and Economic Growth: The Role of
Investment,”The World Economy, 2006,29(8), 1091–1115.
Hausman, Jerry A. and William E. Taylor, “Panel Data and Unobservable Individual Effects,”
Econometrica, 1981,49(6), 1377–1398.
Horvath, Roman and Ayaz Zeynalov, “Natural resources, manufacturing and institutions in
post-Soviet countries,”Resources Policy, 2016,50, 141–148.
Isham, Jonathan, Michael Woolcock, Lant Pritchett, and Gwen Busby, “The Varieties of
Re-source Experience: Natural ReRe-source Export Structures and the Political Economy of Economic
Growth,”The World Bank Economic Review, 2005,19(2), 141–174.
Islam, Roumeen and Claudio E. Montenegro, “What Determines the Quality of Institutions?,”
World Bank Policy Research Working Paper, 2002, (2764).
Kaufmann, Daniel, Aart Kraay, and Massimo Mastruzzi, “The worldwide governance
indica-tors : methodology and analytical issues,”World Bank Policy Research Working Paper, 2010,
(5430).
La Porta, Rafael, Florencio Lopez de Silanes, Andrei Shleifer, and Robert Vishny, “The
Quality of Government,”Journal of Law, Economics and Organization, 1999.
Mehlum, Halvor, Karl Moene, and Ragnar Torvik, “Cursed by Resources or Institutions?,”The
World Economy, 2006.
, , and , “Institutions and the Resource Curse,”The Economic Journal, January 2006,116,
1–20.
Mundlak, Yair, “On the Pooling of Time Series and Cross Section Data,”Econometrica, January
1978,46(1), 69–85.
North, Douglass C.,Institutions, Institutional Change and Economic Performance, Cambridge
University Press, 1990.
Robinson, James A., Ragnar Torvik, and Thierry Verdier, “Political foundations of the
, , and , “Political foundations of the resource curse: A simplification and a comment,”
Journal of Development Economics, 2014,106.
Ross, Michael Lewin, “Does Oil Hinder Democracy?,”World Politics, 2001,53(3), 325–361.
Sachs, Jeffery D. and Andrew M. Warner, “Natural Resource Abundance and Economic Growth,”
NBER Working Paper Series, 1995, (Working Paper 5398).
Sch¨onfelder, Nina and Helmut Wagner, “Impact of European Integration on Institutional
Devel-opment,”Journal of Economic Integration, September 2016,31(3), 472–530.
Schweickert, Rainer, Inna Melnykovska, Ansgar Belke, and Ingo Bordon, “Prospective NATO
or EU membership and institutional change in transition countries,”Economics of Transition,
apr 2011,19(4), 667–692.
Wang, Cong, “Can institutions explain cross country differences in innovative activity?,”Journal
of Macroeconomics, 2013,37, 128–145.
Way, Lucan A. and Steven Levitsky, “Linkage, Leverage, and the Post-Communist Divide,”East