UNIVERSITY OF
PADOVA
DEPARTMENT OF
I
NFORMATIONENGINEERING
Ph.D. Course in Information Engineering
Curriculum:
Bioengineering
Series:
XXIX
Improving the RNA-Seq analysis
pipeline: read alignment and expression
level quantification
Ph.D. Candidate:
Giacomo BARUZZO
Advisor:
Prof. Barbara DI
CAMILLO
Co-Advisor:
Francesca FINOTELLO
Course director:
Prof. Matteo B
ERTOCCOCoordinator:
Prof. Giovanni SPARACINO
This dissertation is submitted for the degree of
Philosophiae Doctor
“The way we do RNA-Seq now is... you take the transcriptome, you blow it up to pieces and then you try to figure out
how they all go together again... if you think about it, it’s kind of a crazy way to do things.”
Michael Snyder
Nawy, Tal. "Sequencing: End-to-end RNA sequencing." Nature Methods 10.12 (2013): 1144-1145.
Abstract
DNA and RNA play an essential role in the life of each living organism. The two molecules have different characteristics and properties but their functions are strictly related. DNA encodes all the genetic instructions needed by the main cell activities in the so-called genome. DNA is related to RNA through the gene expression process, which transcribes the information encoded by DNA into RNAs. Opposite to the static information provided by DNA, the set of transcribed RNAs at a specific instant represents the current state of each cell and, at the end, it provides a dynamic characterization of its activity. For this reason, transcriptome analysis represents a powerful tool to identify the dynamic behavior of an organism, such as the response to environmental stimuli or the pathological mechanisms involved in diseases.
In recent years, transcriptomic analyses were revolutionized by the advent of RNA sequencing(RNA-Seq), a new methodology that applies current Next Generation Sequencing (NGS) techniques to RNA molecules. RNA-Seq enables to investigate at high resolution all the RNA species present in a sample, characterizing their sequences and quantifying their abundances at the same time. In practice, millions of short transcript sub-sequences, calledreads, are sequenced from random positions of the input RNAs using the same NGS platforms employed in DNA sequencing. Unfortunately, no information is provided about which transcripts have generated the reads or from which part of the transcripts they come from. For this reason, reads represent at the same time the output of the sequencing process and the input of complex RNA-Seq data analysis pipelines. The first task in many RNA-Seq data analysis pipelines consists in identifying the relation between the sequencing output (i.e. reads) and the sequenced transcripts. The most common approach to this problem consists in aligning the reads against a reference genome. Once the reads are positioned in the genome, it is possible to infer which transcripts have generated them analyzing the read locations. The information coming from the positions and the number of reads could be employed in a wide range of downstream analyses. For example, counting the number of reads aligned to a gene could give a measure of its expression level, whereas studying which reads are located across exon junction could identify different isoforms. At first glance, these tasks may seem very
simple, but the implementation of both the single steps and the whole analysis workflow are in fact complex and still not well defined.
The aim of this Ph.D. research project was the improvement and the assessment of the computational methods involved in the RNA-Seq data analysis pipeline. Among all the analysis steps in the pipeline, this thesis is focused on the read alignment problem. Read alignment is identified as one of the most critical steps, both for its almost ubiquitous presence in the different RNA-Seq analysis workflows and for its complexity. The study of this pivotal task was carried out through several steps. First, a complete characterization of the problem was performed, analyzing the alignment challenges both from a methodological and a computational point of view. In addition, the algorithms and data structures employed in the alignment process were analyzed together with different ways of modeling the read alignment problem. Then, state of the art methods for RNA-Seq read alignment were identified performing a thorough literature search about RNA-Seq, which revealed the presence of many available methods. At the same time, the literature search highlighted that the identification of a suitable alignment method for a specific application is challenging, mainly due to the lack of accurate comparative analyses. Thus, a comprehensive benchmark analysis of fourteen splice aware alignment methods and four splice unaware tools was designed and performed. The simulation of several datasets describing real scenarios and the definition of a comprehensive set of accuracy and efficiency metrics were performed in order to assess the different alignment methods. The assessment revealed considerable differences between methods’ performance, highlighting often a poor correlation between accuracy and popularity. Finally, the effect of the alignment accuracy on the reliability of an expression level quantification study was assessed for a subset of alignment methods.
Overall, this thesis considers the RNA-Seq read alignment problem and presents a thorough characterization of its characteristics and challenges. In a fast evolving research field such as RNA-Seq, the information resulting from the assessment of state of the art methods provides some valuable guidelines for the definition of robust and accurate analysis pipelines.
Ringraziamenti
Durante questi ultimi tre anni, molte persone mi hanno aiutato e accompagnato nel mio percorso di dottorato. La loro presenza e il loro contributo hanno reso possibile questo lavoro di tesi e mi sento di dover loro un ringraziamento speciale.
Vorrei in primo luogo ringraziare mio padre Gianni e mia madre Alessandra, per il loro continuo e incondizionato supporto. La loro vicinanza e il loro affetto sono stati fonte di forza e incentivo a migliorare continuamente come uomo e come ricercatore.
Un ringraziamento speciale va al mio supervisore Barbara per l’aiuto e la guida in questi tre anni di lavoro insieme. I risultati ottenuti e la mia crescita accademica e professionale sono merito del suo ottimo lavoro e della sua grande competenza.
Un grazie ai membri del mio gruppo di ricerca Alberto, Alessandra, Elif, Francesco, Gianna, Ilaria e Tiziana. Un grazie particolare a Francesca, che è stata la mia guida nel primo periodo e da cui ho imparato moltissimo.
Un ringraziamento agli amici e colleghi Alberto G., Alberto D., Alessandra, Alessandro, Alessia, Chiara, Davide, Elif, Erica, Francesca, Giacomo C., Giacomo T., Giada, Ilaria M., Ilaria P., Marco, Maria, Martina, Matteo e Tiziana per i tanti bei momenti passati insieme.
La bioinformatica è un campo di ricerca che richiede notevole potenza di calcolo e una complessa gestione delle risorse computazionali. Il lavoro svolto in questi anni è stato reso possibile dalla competenza e disponibilità di Paolo, che ringrazio infinitamente per il fondamentale aiuto nella gestione delle piattaforme di calcolo.
Un grandissimo ringraziamento e profonda gratitudine a Greg per l’opportunità che mi ha concesso ospitandomi nel suo gruppo di ricerca. Una buona parte di questa tesi è nata dal lavoro svolto nei sei fantastici mesi trascorsi a Philadelphia, periodo che mi ha fatto crescere umanamente e professionalmente.
Il lavoro sui metodi di allineamento non sarebbe stato lo stesso senza il fondamentale contributo di Katharina, che ringrazio per la disponibilità, l’eccellente lavoro e le tante ore passate con me a sviluppare questo importante progetto.
Un grazie particolare anche agli altri autori, Eun Ji e Garret, per aver reso possibile questo fantastico lavoro. Il periodo a Philadelphia è stato reso speciale anche e soprattutto per le
splendide persone che ho conosciuto lì tra cui voglio ricordare, in aggiunta a chi già citato sopra, Anand, Dimitra, Elisabetta, Emanuela, Faith e Nick.
Da ultimo, ma non per importanza, un ringraziamento lo voglio riservare ai miei amici, sia dentro che fuori l’università, che mi sono stati sempre vicini in questi anni.
Table of contents
Abstract vii
1 Introduction 1
1.1 Motivations and objectives . . . 3
1.2 Structure of the thesis . . . 5
2 RNA sequencing background 7 2.1 Biological context . . . 8
2.2 Next Generation Sequencing . . . 10
2.2.1 Next Generation Sequencing platforms review . . . 11
2.2.2 Typical RNA sequencing experiment . . . 21
2.2.3 RNA processing . . . 21
2.2.4 Library preparation . . . 22
2.2.5 Sequencing . . . 24
2.3 RNA sequencing analysis pipeline . . . 25
2.3.1 Data preprocessing . . . 26
2.3.2 Data analysis . . . 28
3 Read alignment 31 3.1 The read alignment problem . . . 32
3.1.1 From DNA to RNA read alignment . . . 32
3.1.2 RNA sequencing read alignment challenges . . . 33
3.1.3 An alternative solution: de-novo transcriptome assembly . . . 37
3.2 Data structures and algorithms . . . 39
3.2.1 Hashing methods . . . 39
3.2.2 Suffix array and Burrows–Wheeler transform methods . . . 40
3.2.3 Implementation choices . . . 42
3.3.1 Splice aware methods . . . 45
3.3.2 Splice unaware methods . . . 51
4 Design of a benchmark analysis for RNA sequencing read alignment methods 55 4.1 Data simulation . . . 56
4.1.1 RNA sequencing data simulators . . . 56
4.1.2 Simulated data for splice aware methods comparison . . . 58
4.1.3 Simulated data for splice unaware methods comparison . . . 59
4.2 Assessment metric definitions . . . 60
4.2.1 Base level metrics . . . 60
4.2.2 Read level metrics . . . 62
4.2.3 Junction level metrics . . . 62
4.2.4 Computational burden metrics . . . 63
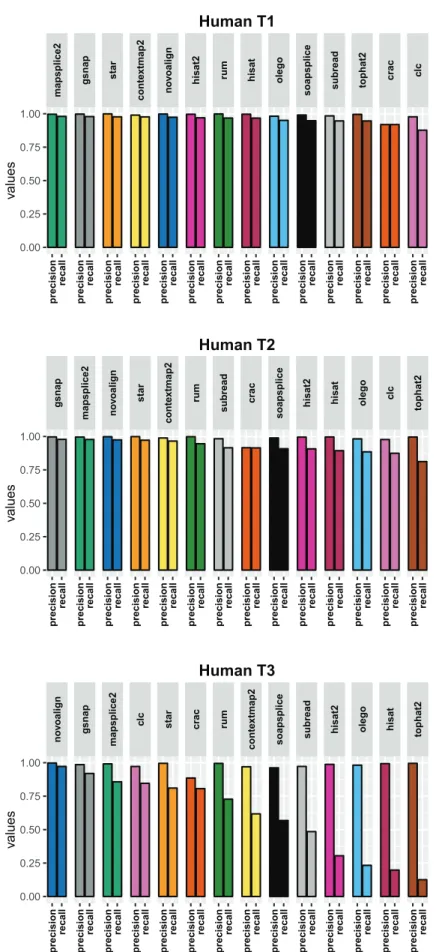
5 Comparative analysis of splice aware alignment methods 65 5.1 Tested scenarios . . . 66
5.2 Results using the aligner tools default parameters . . . 68
5.2.1 Base level . . . 68
5.2.2 Read level . . . 71
5.2.3 Junction level . . . 74
5.3 Effect of input annotation . . . 76
5.3.1 Short anchored read . . . 77
5.3.2 Canonical vs. non canonical junctions . . . 79
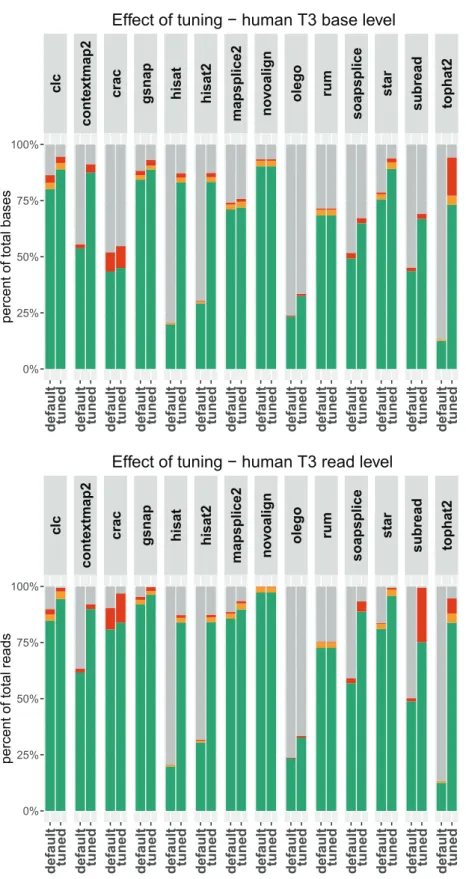
5.4 Effect of parameters tweaking . . . 81
5.5 Effect of read preprocessing . . . 85
5.6 Multimappers . . . 87
5.7 Insertions and deletions . . . 90
5.8 Alignment speed and memory requirement . . . 93
6 Comparative analysis of splice unaware alignment methods 99 6.1 Tested scenarios . . . 100
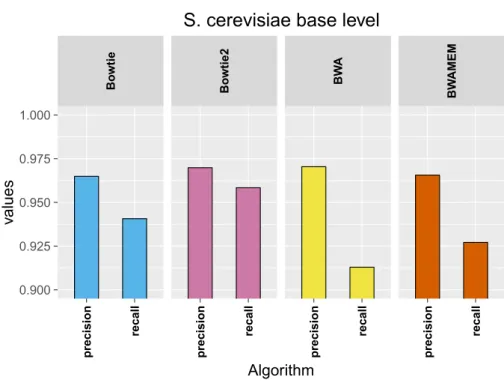
6.2 Results using the aligner tools default parameters . . . 101
6.2.1 Base level . . . 101
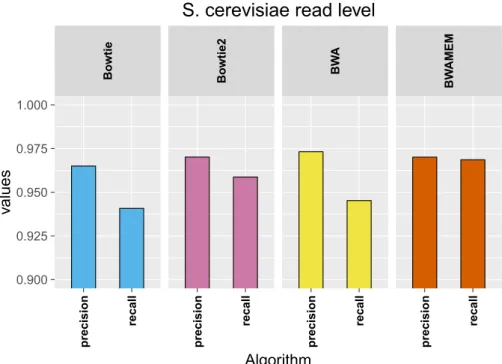
6.2.2 Read level . . . 103
Table of contents xiii
7 Effects of read alignment on expression level quantification 109
7.1 Selection of test datasets . . . 110
7.1.1 Real data . . . 110
7.1.2 Simulated data . . . 112
7.2 Metric definitions . . . 112
7.3 Quality control and read preprocessing . . . 113
7.4 Read mapping . . . 116
7.5 Quantification and normalization . . . 119
7.6 Results of quantification assessment . . . 119
8 Conclusions 123 Appendix A SAM file format 131 A.1 Header section . . . 131
A.2 Alignment section . . . 132
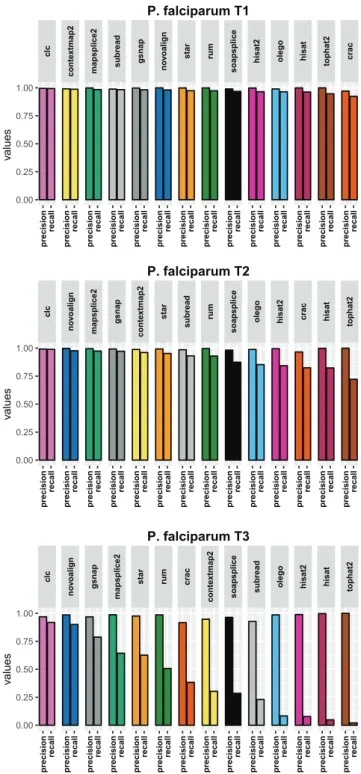
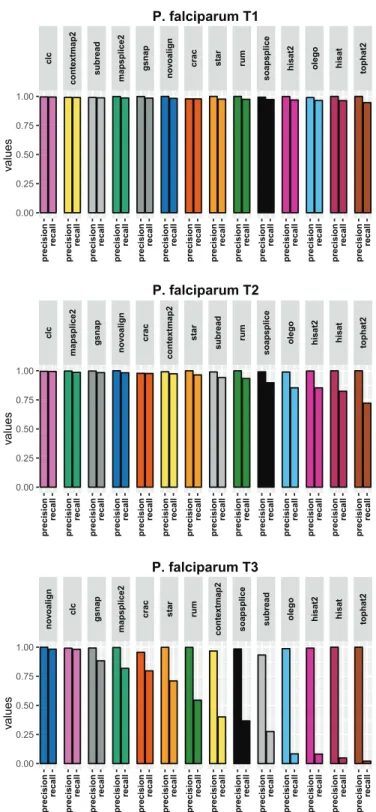
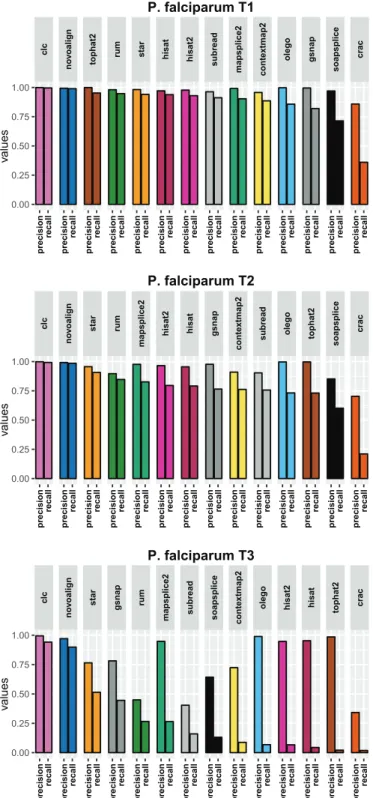
Appendix B P. falciparum results figures 135 B.1 Results using the aligner tools default parameters . . . 136
B.1.1 Base level . . . 136
B.1.2 Read level . . . 138
B.1.3 Junction level . . . 140
B.2 Effect of input annotation . . . 141
B.3 Effect of parameters tweaking . . . 142
B.4 Insertions and deletions . . . 145
B.5 Alignment speed and memory requirement . . . 147
Appendix C Parameters tweaking 151 C.1 CLC Genomic Workbench . . . 151 C.2 ContextMap2 . . . 153 C.3 CRAC . . . 155 C.4 GSNAP . . . 156 C.5 HISAT . . . 158 C.6 HISAT2 . . . 160 C.7 MapSplice2 . . . 162 C.8 Novoalign . . . 164 C.9 Olego . . . 166 C.10 RUM . . . 168
C.11 SOAPsplice . . . 169
C.12 STAR . . . 170
C.13 Subread(Subjunc) . . . 175
C.14 TopHat2 . . . 177
Appendix D Alignment notes for splice unaware tools 179 D.1 Bowtie . . . 179
D.2 Bowtie2 . . . 179
D.3 BWA . . . 180
D.4 BWAMEM . . . 180
Appendix E Publications and side projects 181 E.1 Journal papers . . . 181
E.2 Abstracts and short papers . . . 181
E.3 Commentary articles . . . 182
Chapter 1
Introduction
In every living organism, DNA molecules encode all the genetic instructions required to build the RNAs and proteins that are needed to the growth, development, functioning and reproduction of the cell. However, DNA represents a static set of instructions and so is not able to explain the dynamic behavior of an organism, such as the evolution through diverse developmental stages or the response to environmental stimuli. Great part of organisms’ dynamicity and complexity is indeed explained by gene expression, i.e. the process that transforms the information encoded in the genome into a functional product. In the gene expression process, each cell can activate a specific set of genes required for executing regulatory actions as well as functions or responses to stimuli; the genes are activated through their transcription into RNA copies. Since RNA transcription is the activation of several processes and control mechanisms that make up the complex gene expression machinery, substantial insights can be drawn from the study of organisms’ transcriptomes.
Hybridization-based approaches such as microarrays, have been the most used solutions for gene expression profiling and differential expression (DE) analysis for many years, thanks to their high throughput and relatively low costs [1].
In 2008, the advent of a new methodology called RNA sequencing (RNA-Seq), has revolutionized transcriptomics research enabling the simultaneous characterization of the sequences of the transcripts present in a cell and the quantification of their expression levels [1–5]. Compared to previous approaches, RNA-Seq methodology offers several key advantages:
• It is not limited to the detection of transcripts corresponding to well-annotated genomic sequences, but can be used to perform novel transcript discovery or to sequence non-model organisms;
• It does not have an upper limit for quantification, thus ensuring a large dynamic range of expression levels over which transcripts can be detected;
• It achieves high levels of reproducibility for technical replicates [2, 6]; • Transcript sequences can be read at single-base level.
The possibility of sequencing transcriptomes at single-base resolution is borrowed from Next-Generation Sequencing (NGS) platforms, which represent the technological framework of the RNA-Seq methodology. Next-Generation Sequencing technologies produce enormous amount of data, enabling to sequence entire genomes and transcriptomes in a single instru-ment run at dramatically reduced time and costs. In practice, millions of short sequences, calledreads, are sequenced from random positions of the input RNAs using the same NGS platforms employed in DNA sequencing.
Despite being already widely used, RNA-Seq is a very recent methodology that is experiencing a fast and continuous development of both experimental and computational procedures. In particular, the number of available methods for performing each step of RNA-Seq data analysis has grown at such a fast pace so to prevent the definition of a unified and standardized computational pipeline.
In this scenario, the research described in this thesis was originally motivated by the need of identifying robust computational methods for the analysis of RNA-Seq data, focusing on one of the most critical and widely performed tasks such as the alignment of RNA-Seq reads. All the contributions described in this thesis, and related to the study, improvement and assessment of the RNA-Seq analysis pipeline, are the results of the research activity carried out within this Ph.D. program.
This chapter provides a brief overview of the RNA-Seq read alignment problem, high-lighting challenges and open issues. The motivations of the research are described together with the aim and the main objectives of the thesis. In addition, the structure of the thesis is presented in the last section.
1.1 Motivations and objectives 3
1.1
Motivations and objectives
RNA-Seq provides nearly unlimited possibilities in modern transcriptome analyses, resulting in a wide variety of applications. However, the study of high-throughput RNA sequencing data requires the design of sophisticated analysis pipelines involving many computational steps.
While many downstream steps in the pipeline are specific for the particular application, few preliminary tasks are common to the great majority of studies. These common steps involve the processing of sequencing reads and have a pivotal role in the accuracy and reliability of the several downstream analyses.
The millions of reads produced by current NGS technologies are sequenced from random positions of the input RNAs. So, the output of the sequencing process are just millions of transcript sub-sequences, but no information is provided about which transcripts have generated them or from which part of the transcripts they come from. Therefore, the first step in any RNA-Seq data analysis consists in identifying the relation between the available reads and the transcripts present in the sequenced sample.
The most common approach to this problem consists in aligning the reads against a reference sequence, such as a genome or a transcriptome. Once the reads are positioned in the genome, it is possible to infer which transcripts have generated them by analyzing the read locations. The information coming from the positions and the number of reads are then employed by the different downstream analyses. For example, counting the number of reads aligned to a gene could give a measure of its expression level, whereas studying which reads are located across an exon junction could identify different isoforms. At first glance, identifying the position of each read in the reference genome may seem very simple, but the alignment of RNA-Seq reads is in fact complex and challenging, both in terms of accuracy and efficiency.
The source of such complexity are both biological and technical factors. For example, the presence of low complexity regions and polymorphisms such as insertions, deletions and single nucleotide polymorphisms (SNP) makes challenging the identification of a perfect match between the read and the reference sequence. Furthermore, the sequencing process is not error free, resulting in reads that are not perfect copies of the transcript sub-sequence which generated them and requiring some flexibility during the alignment process. In addition, the presence of splicing and alternative splicing makes it impossible to find a continuous location in the genome for reads covering an exon junction. Indeed, the removal of introns during the splicing process requires the identification of long gaps during the alignment of such reads against a genome. In particular, it is the need for RNA-Seq alignment methods to handle intronic gaps (i.e. splice awareness) which makes the alignment problem even harder.
From the computational point of view, the sizes of the reference genomes (from hundreds of thousands up to billions of bases) and the large amount of reads (tens or hundreds of millions) makes the read mapping a computationally intensive task. Typically, finding the correct positions of available reads in a large reference genome requires tens of GB of RAM and many CPU hours on a multicore machine.
In order to achieve feasible resource requirement and provide a rigorous modeling of the mapping process, current alignment methods exploit efficient data structures and algorithms employed in many string alignment contexts. The first generation of alignment methods employed a hash table to create an index of the genome, using short nucleotide sequences as table’s keys and coding in each table’s entry the locations of the associated key. The second generation of mapping methods exploited suffix arrays and suffix trees to index the genome and modeled the alignment process as the traversal of such data structures. Both class of methods have strengths and weaknesses and allow achieving different trade-off between efficiency and accuracy. Currently, the modeling of the alignment process and the research of efficient data structures, algorithms and strategies are still open problems.
Due to the pivotal importance of read alignment in the RNA-Seq analysis pipeline and the challenges in terms of accuracy and efficiency described above, in recent years there was a considerable effort of the research community in the development of splice aware alignment methods. However, the complexity of the alignment problem and the increasing number of available methods have prevented the definition of a unified and standardized computational pipeline and the possibility to assess the performance of the different methods. In this uncertain scenario, this thesis is aimed at achieving the following objectives:
• a thorough definition of the read alignment problem, identifying the most important characteristics and challenges
• the identification of the state of the art RNA-Seq read alignment methods and the assessment of their performance, both in terms of alignment accuracy and efficiency • the assessment of the role of RNA-Seq read alignment in the accuracy of expression
level quantification analyses
These objectives are designed to assess and improve the reliability of the alignment step consequently increasing the accuracy of the overall RNA-Seq analysis pipeline.
1.2 Structure of the thesis 5
1.2
Structure of the thesis
In order to better outline the RNA-Seq scenario, in Chapter 2 some prerequisite topics such as transcription and gene expression, Next Generation Sequencing technology, RNA-Seq experimental procedures and data analysis are introduced. In Chapter 3, the read alignment problem is presented, analyzing its characteristics and challenges from both a methodological and a computational complexity point of view. In addition, the available alternatives to read alignment are briefly described and discussed. State of the art methods for RNA-Seq read alignment are then identified performing a thorough literature search that involved more than 2000 peer reviewed publications in the context of RNA-Seq. The literature search highlights that RNA-Seq alignment, a common task in the great majority of RNA-Seq analysis pipelines, remains in a state of confusion mainly due to a lack of accurate and systematic benchmarking studies. With the purpose of addressing this issue, in Chapter 4 a thorough benchmark analysis of read alignment methods is designed. In this chapter, the simulation of datasets representing several real scenarios is described together with the definition of a complete set of accuracy and efficiency metrics. In Chapter 5, these metrics and datasets are then employed to assess the performance of fourteen splice aware algorithms. The same analysis is performed also on four splice unaware tools and it is described in Chapter 6. The effects of employing some of these mapping methods on the accuracy of a common downstream analysis are then assessed in Chapter 7. Specifically, the effects on the expression level quantification are investigated, using both real and simulated data together with different read preprocessing policies and read alignment strategies. Finally, strengths, limitations and future developments of the present study are discussed in Chapter 8.
Chapter 2
RNA sequencing background
Four topics are at the basis of this thesis: RNA and gene expression, Next-Generation Sequencing technologies, RNA-Seq experiment and RNA-Seq data analysis pipelines.
RNA and gene expression represent the biological context of a RNA-Seq study. The identification and quantification of transcripts performed through the RNA-Seq methodology enable a thorough characterization of the cell’s activities. Due to the fundamental role of RNA in many cell’s functions and processes, the study of this molecule has a pivotal role in many research fields such as medicine, biology and pharmacology.
Next-Generation Sequencing technologies represent the technological framework of the RNA-Seq methodology and they have a major role in many strengths and weaknesses of this novel methodology. Several NGS platforms exist, each one achieving unique characteristics and features that should be related to the specific objective of the RNA-Seq study.
RNA sequencing shares many experimental steps with DNA sequencing and requires only few specific experimental procedures. Unfortunately, both the common and specific steps involved in a RNA-Seq experiment are the source of many biases that are impossible to eliminate. Therefore, it is important to know the different sources of bias and design the experiment to minimize the ones which could impact the final results.
Once the experiment is completed, RNA-Seq data are processed through a complex analysis pipeline. Several step and computational methods are involved in the analysis of RNA-Seq data, in order to both mitigate the experimental biases and fully exploit the information contained in the sequenced sample.
The RNA-Seq experiment and data analysis as well as the employed Next-Generation Sequencing technologies are strictly related to the overall accuracy and reliability of a RNA-Seq study. For this reason, an introduction to these topics is provided in the following sections.
2.1
Biological context
In all known living organisms, DNA stores the whole information needed to make functioning the cells. DNA (deoxyribonucleic acid) is a nucleic acid and its molecule is composed by monomer units called nucleotides; each nucleotide consists of a deoxyribose sugar, a phosphate group and a nitrogenous base. Nucleotides can be of four different kinds, depending on the base that they comprise: adenine (A), cytosine (C), guanine (G) or thymine (T). The nucleotides are concatenated to one other by a phosphodiester bond which joins the 5’ end on one nucleotide to the 3’ end of the previous one, forming a strand. In each molecule, two strands are then bound together through hydrogen bonds between the corresponding nitrogenous bases, following a precise base pairing rule: adenine only matches thymine, while cytosine only binds to guanine. Due to the fixed base pairing rule, the two strands are complementary since one DNA strand could univocally determine the sequence of its antiparallel strand. The DNA molecule stores the biological information through the specific sequence in which the four nucleotides appear, encoding in such sequences all the organism’s hereditary information.
A specific DNA region which encodes a particular functional product or a regulatory function is called gene and the process which converts the encoded information into the final product is calledgene expression. The conversion is performed through a first step of
transcription in which the genetic information encoded in the DNA is transcribed into a RNA molecule. Similarly to DNA, Ribonucleic acid (RNA), is a nucleic acid and has a very similar chemical structure. However, RNA differs from DNA:
• strand structure: RNA is single stranded, DNA is double stranded • base composition: RNA contains uracil (U) in place of thymine
• sugar composition: RNA contains ribose sugar instead of deoxyribose, which makes it less stable than DNA
Depending of the final product, the transcribed RNAs molecules could be classified as: • coding RNA: RNAs whose final product is a protein. The results of transcription is
a messenger RNA (mRNA), which would be decoded by a ribosome into an amino acid sequence through thetranslationprocess. In eukaryotic organisms, the result of transcription is a precursor mRNA (pre-mRNA) which would be processed to obtain the final mRNA.
• non-coding RNA: RNAs which do not code for a protein. Non-coding RNAs (ncRNAs) have control and regulatory functions and are involved in many cellular processes.
2.1 Biological context 9
Examples of ncRNAs are ribosomal RNAs (rRNAs), transfer RNAs (tRNAs), microR-NAs (miRmicroR-NAs), piwi-interacting RmicroR-NAs (piRmicroR-NAs), small interfering RmicroR-NAs (siRmicroR-NAs), small nuclear RNAs (snRNAs), small nucleoar RNAs (snoRNAs) and long ncRNAs (lncRNAs).
In regards to coding RNA, mRNAs have a pivotal role in the translation of the genomic information encoded in the DNA (genotype) into the physical characteristics of an organism (phenotype). Proteins are one of the most important macromolecules in a living organism, accomplishing several functions such as responding to stimuli, transporting molecules and catalyzing metabolic reactions. Although several molecules, such as minerals, water and fats, shape the organisms’ cells, proteins provide the framework for their correct functioning and organization. Different from prokaryotes transcription, which create a mature mRNA, in eukaryotic organisms the result of transcription is a pre-mRNA which has to undergo some post-transcriptional modifications. The first modification consists in the addition of a methylated guanine nucleotide at the 5’ end of RNA, through a process called “capping”; the 5’ methylated cap would help the cell to recognize mRNA from other molecules and protects it from degradation. The 3’ end of mRNA is modified as well, adding a long tail of adenine bases, called poly-A tail. Similar to capping, this modification prevents mRNA to be quickly degraded: the longer the poly-A tail is, the longer the mRNA resists to degradation and the more it is translated into proteins. The last modification step is calledsplicingand consists in removing the non-coding regions (i.e. introns) and concatenating together the remaining coding sequences, called exons. During the splicing process, the order of exons is always preserved, while some exons can be removed along with introns, giving rise to different RNAs. This process, calledalternative splicing, enables the production of different proteins (isoforms) starting from the same gene, dramatically increasing the coding potential of eukaryotic genomes. For example, in human ~95% of genes having more than one exon are alternatively spliced [7], allowing to produce more than 200000 protein coding transcripts from about 22000 genes [8].
On the other hand, non-coding RNAs are not translated into a protein but they have a fundamental role in cell development and differentiation. In addition, they are involved in several cellular processes such as RNA processing (snRNAS and snoRNAs), translation (rRNAs and tRNAs), gene expression and transcription (lncRNAs) [9–12].
2.2
Next Generation Sequencing
Since the discovery of the structure of DNA [13], huge progress have been made in under-standing the complexity and diversity of living organism genomes. In this context, a major role is played by DNA sequencing, i.e. the determination of the precise order of nucleotides that constitute a DNA molecule. The first sequencing technique was developed in 1975 by Frederick Sanger [14], in which E. coli DNA polymerase was used to copy single-stranded DNA molecules. Just two years later, Sanger’s group was able to sequence the first genome using this technique [15]. However, this sequencing method achieved low automation and throughput, allowing to sequence just few hundreds of nucleotides at a time.
The major breakthrough happened some time later, when the same research group introduced the “dideoxy chain-termination” method for sequencing DNA molecules, also known as the “Sanger method” or "Chain termination method" [16]. The new method allowed a faster and more accurate DNA sequencing, even if the low throughput still remained the main issues.
In early 90’, the advent of capillary electrophoresis defined the first milestone in the so-called “high-throughput” sequencing, allowing to sequence up to 96 DNA sequences in parallel. The method records the light emission signal produced by labelled deoxynucleotides (dNTPs) during the synthesis of the DNA template complementary strand. Finally, an algorithm translates the recorded fluorescent emissions into DNA sequences, called “reads”.
Between 2007-2008, the continuous trend in increasing the sequencing throughput leaded to the development of the so called “Next-Generation Sequencing” (NGS) technologies, which at the same time greatly reduced sequencing costs and increased the throughput by a factor of 100-1000 [17, 18]. The main advantage of this new sequencing techniques is a massive parallelization which allows sequencing of millions of fragments at the same time. The high parallelization reduces the costs due to the reagents needed and drastically increases the throughput per run.
Nowadays, these advances have brought the cost of sequencing a human genome down to around US$1,000 and they have enabled the use of sequencing as a clinical tool [19]. On the other hand, these advancements are not without limitations since some existing problems are exacerbated and new problems arise. For example, data produced by NGS platforms show a higher error rate (0.1–15%) and read lengths generally shorter (35–700 bp for short-read approaches) than those of traditional Sanger sequencing platforms [20]. Although some long-read sequencing technologies mitigate the length limitation, they remain considerably more expensive and at the same time show lower throughput than other platforms. A complete characterization of modern NGS technologies is presented in the next section.
2.2 Next Generation Sequencing 11
2.2.1
Next Generation Sequencing platforms review
Many NGS platforms share some common steps, such as DNA template fragmentation, adapter ligation and clonal amplification. However, each technology exploits different techniques and strategies [21–23].
Short read next generation sequencing technologies fall under two broad classes: sequenc-ing by synthesis (SBS) and sequencsequenc-ing by ligation (SBL). In the first class of methods, a polymerase is used and a signal (e.g. a fluorophore or a change in ionic concentration) reveals the strand elongation through the incorporation of a nucleotide. In SBL approaches, the DNA fragment is hybridized with a probe sequence bound to a fluorophore which is then ligated to an adjacent oligonucleotide for imaging. The base complementary to specific positions within the probe is then identified through the emission spectrum of the fluorophore. In order to better distinguish signal from background noise, both classes of methods usually create many identical copies of the DNA fragment exploiting bead-based or solid-state generation strategies (Figure 2.1).
Fig. 2.1Amplification strategiesa)Bead-based amplification methods,b)Solid state amplifi-cation methods. Image taken from [23].
Bead-based preparation methods use beads covered with deoxynucleotides (dNTPs), primers, DNA polymerase and oligonucleotide fragments complementary to adapters. DNA templates are then ligated to adapters sequences and are captured in micelles along with
the beads. Finally, emulsion PCR (emPCR) [24] is performed within the micelle, resulting in many copies of the same DNA template on each bead. In solid-state methods [25] the amplification is performed directly on a solid support containing forward and reverse primers complementary to DNA templates. PCR is then used to create the second strand from the immobilized primers and the unbound DNA templates are then removed. Template concentration and location should be properly handled to avoid overlapping clonal cluster. In order to increase the cluster density, and consequently the sequencing throughput, some NGS platforms have recently introducedpatterned flow cells. Patterned flow cells are prearranged microwells on the solid support that optimize the cluster spacing. The area between the microwells is devoid of DNA probes, ensuring that DNA clusters only form within the wells. The microwells fixed locations provide even and consistent spacing between adjacent clusters, allowing accurate resolution of clusters during imaging.
In the context of long-read technologies, the leading approach is single-molecule real-time (SMRT) sequencing, in which the sequence of nucleotides is detected in real-time. SMRT methods differ from short-read approaches in that they do not require chemical cycling for each dNTP added and they do not perform a clonal amplification of DNA fragments to generate a stronger signal.
In the next sections are described four short-read platforms (SOLiD, Illumina, 454 and Ion Torrent) and two long-read platforms (PacBio and Oxford Nanopore).
2.2 Next Generation Sequencing 13
SOLiD
The SOLiD platform exploits a sequencing by ligation approach employing a two-base-encoded probe [26], i.e. each fluorometric signal represents a dinucleotide. After cluster generation or bead deposition onto a slide, the two-base-encoded probe is added to the DNA library (Figure 2.2), followed by degenerate or universal bases. The probe is ligated onto an adapter complementary anchor and then imaged. Next, some degenerate bases and the fluorophore are cleaved from the probe, leaving a 5’ phosphate. The process is repeated several times until the entire strand is elongated. At this point, all anchors and probes are removed and many other rounds are performed to ensure every base in the template is sequenced. Since each signal represents a dinucleotide, the output is not directly associated with a single nucleotide. To identify which of the 16 possible dinucleotide combinations is the correct one, four fluorescent signals are employed, each one representing a subset of four dinucleotide combinations. This technique allows decoding the information during the data analysis and leads to the term color-space data, in opposition with classic base-space data, to identify the SOLiD output.
Fig. 2.2SOLiD sequencing. Main steps involved in the SOLiD sequencing process. Colored elements: probe (dark blue), degenerate bases (pink), anchor (light purple), adapter (red). Image taken from [23].
Illumina
The Illumina system is a sequencing by synthesis platform using a cyclic reversible termina-tion (CRT) approach. Similar to Sanger sequencing, a CRT approach prevents the elongatermina-tion using terminator molecules in which the ribose 3’-OH group is blocked [27, 28]. After solid-state template amplification, a mixture of DNA polymerase, primers and modified nucleotides are added to the flow cell. The modified nucleotides are 3’ blocked and labelled with a base-specific cleavable fluorophore. At each cycle, fragments in each cluster incorporate just one nucleotide while the unbound dNTPs are washed away (Figure 2.3). The slide is then imaged and the dNTPs are identified through total internal reflection fluorescence (TIRF) microscopy using either two or four laser channels. The fluorophores are then cleaved and removed and the 3’-OH group is regenerated with the reducing agent tris(2-carboxyethyl)phosphine (TCEP). Several cycles of nucleotide addition, strand elongation and cleavage are performed until the end of the sequencing process.
Fig. 2.3Illumina sequencing. Main steps involved in the Illumina sequencing process. Image taken from [23].
2.2 Next Generation Sequencing 15
Ion Torrent
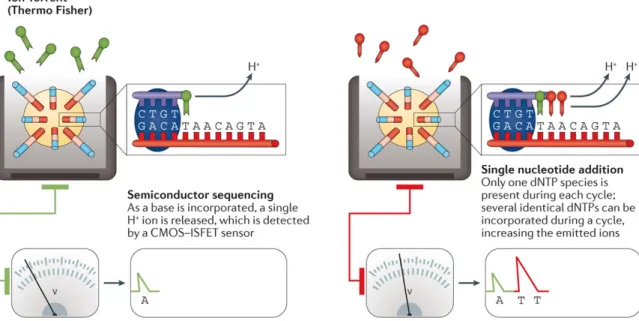
Ion Torrent is a sequencing by synthesis platform employing a bead-based template enrich-ment and a single-nucleotide addition (SNA) approach. Unlike CRT, the SNA approach requires that each of the four dNTPs is added iteratively during the sequencing reaction. As a consequence, the SNA approach does not require the nucleotides to be 3’ blocked, since the elongation is prevented by the absence of the next dNTP in the sequencing reaction. In the particular case of homopolymer regions, the nucleotides identification relies on the detection of a proportional increase in the signal due to the incorporation of multiple dNTPs. Ion Torrent is the first NGS system without optical sensing [29], exploiting the detection of H+ ions that are released during each dNTP incorporation. As each dNTP is incorporated, the H+ion release results in a variation of 0.02 unit in pH, which is detected by an integrated complementary metal-oxide semiconductor (CMOS) and an ion-sensitive field-effect tran-sistor (ISFET) device (Figure 2.4). However, the pH variation detected by the sensors is imperfectly proportional to the number of dNTPs detected, resulting in limited accuracy in measuring homopolymer regions.
Fig. 2.4Ion Torrent sequencing. Main steps involved in the Ion Torrent sequencing process. Image taken from [23].
454
454 pyrosequencing [30] is the first NGS instrument ever developed. It belongs to the sequencing by synthesis class and exploits a single-nucleotide addition approach. After bead-based template amplification, beads are distributed on a microplate along with primers and beads containing an enzyme cocktail. A single nucleotide species is then added to the plate and DNA polymerase synthesizes the complementary strand incorporating the available dNTPs. A pyrophosphate molecule is the by-product of this reaction and along with ATP sulfurylase transforms adenosine 5’ phosphosulfate (APS) into ATP. ATP is involved in the conversion of luciferin to oxyluciferin by luciferase, resulting in a bioluminescence signal. Finally, incorporated bases are degraded using apyrase and the next dNTP is added to the wells. The light emissions due to the incorporation of one or more identical dNTPs is then detected by a charge-coupled device (CCD) camera (Figure 2.5).
Fig. 2.5454 sequencing. Main steps involved in the 454 pyrosequencing process. Image taken from [23].
2.2 Next Generation Sequencing 17
PacBio
PacBio is currently the most widely used long-read platform employing a SMRT approach [31]. The process starts with the ligation of the DNA templates to hairpin adapters at each end, resulting in the ’SMRTbell’, a circular DNA molecule containing the double-stranded DNA template in the middle and constant single-stranded DNA (ssDNA) regions at each end. A size selection protocol is then performed, followed by the attachment of primers and DNA polymerase to the ssDNA regions of the SMRTbell. The library is added to a particular flow cell with several thousands of individual picolitre wells with transparent bottoms, called zero-mode waveguides (ZMW) [32]. Polymerase is fixed to the bottom on the well and allows the DNA strand to progress through the ZMW (Figure 2.6). A mixture of labelled dNTPs is added and the nucleotide incorporation per well is monitored with a laser and a camera. The sensors allow detecting the color and the duration of the emitted light as the nucleotide momentarily pauses during the activity of the polymerase at the bottom of the ZMW. Before the next labelled nucleotide is incorporated, the polymerase cleaves the fluorophore during strand elongation, allowing it to diffuse away from the sensor area. In addition, the circular shape of the SMRTbell allows each template to be sequenced many times since the polymerase would repeat the traverse through the circular molecule. These multiple passes are exploited to create a consensus read of insert, called circular consensus sequence (CCS).
Fig. 2.6PacBio sequencing. Main steps involved in the PacBio process. Image adapted from [23].
Oxford Nanopore
Oxford Nanopore platform is different from any other sequencing system since it does not monitor incorporations or hybridizations of nucleotides guided by a template DNA strand. A nanopore sequencer directly identifies the DNA sequence of a native ssDNA molecule passing it through a protein pore as current is passed through the pore [33]. In details, while a motor protein moves the DNA into the pore, a voltage change occurs modulating the current passing through the pore (Figure 2.7). Various parameters, including the duration and magnitude of the current shift, define the so-called squiggle space. Through the analysis of the squiggle space data it is possible to identify the particular DNA sequence passing through the pore. In the library preparation process, DNA is fragmented to 8–10 kb and two different adapters, a leader and a hairpin, are ligated to either end of the fragmented dsDNA. The leader adapter consists of a double-stranded fragment containing a tether sequence to help direct the DNA to the membrane surface and a sequence to direct the DNA into the pore. The harping links the two DNA strands, allowing for both the full forward and full reverse strand of a double-stranded DNA molecule to be sequenced and associated.
Fig. 2.7Oxford Nanopore sequencing. Main steps involved in the Oxford Nanopore process. Image taken from [23].
2.2 Next Generation Sequencing 19
Platforms comparison
As summarized in Table 2.1, each sequencing platform achieves different throughput, cost and error profile. Even if the SOLiD platform shows one of the highest accuracies, the short read length and some known substitution errors and AT/GC-rich under representation biases [35, 36] limit its popularity. Similarly to SOLiD, the Illumina platform shows some under-representation in AT/GC-rich regions [36–38] and a tendency towards substitution errors [39]. However, Illumina dominates the short-read sequencing industry, probably due to the maturity of its technology and the wide range of platform options. Both the Ion Torrent and the 454 platforms achieve higher read lengths compared to the other short read systems, but the employed SNA approach results in a higher indel error rate and a difficult handling of homopolymer regions [40].
In the context of long read platform, PacBio is the most widely used platform. One of the main limitation of this system in the high indel error rate (up to 15%) for a single-pass sequencing (i.e. the molecule is not sequenced multiple times) [41]. However, if the molecule is sequenced more times the accuracy quickly increases, reaching 99.999% for a molecule sequenced 10 times [42]. Compared to PacBio, Oxford Nanopore technologies are not very widespread, mainly due to several limitations on fragment size and accuracy on homopolymer regions [43]. On the other hand, the small dimension of the USB-based ONT MinION platform (MK1 dimension are 3 cm × 10 cm) could be a benefit in several scenarios, such as rapid clinical responses and hard-to-reach field locations.
Table 2.1 Summary of NGS platforms. Data taken from [23] and [34]; 2016 update.
Platform Read length
(bp)
Reads Throughput (Gbp/run)
Runtime Error profile Instrument cost (US$)
Cost per Gb (US$)
SOLiD 5500xl 50(SE) ~1400M 160Gb 10d ⩽0.1%, AT bias $251000 $70
SOLiD 5500xl 75(SE) ~1400M 240Gb 10d ⩽0.1%, AT bias $251000 $70
Illumina MiSeq v2 150(PE) 24-30M 4.5-5.1Gb 24h 0.1%, substit. $99000 $212 Illumina MiSeq v2 250(PE) 24-30M 7.5-8.5Gb 39h 0.1%, substit. $99000 $142 Illumina MiSeq v2 75(PE) 44-50M 3.3-3.8Gb 21-56h 0.1%, substit. $99000 $250 Illumina MiSeq v3 300(PE) 44-50M 13.2-15Gb 21-56h 0.1%, substit. $99000 $110 Illumina NextSeq 500/550 High output 75(PE) 800M 50-60Gb 18h <0.1%, substit. $250 $41 Illumina NextSeq 500/550 High output 150(PE) 800M 100-120Gb 29h <0.1%, substit. $250 $33 Illumina HiSeq 2500 v2 Rapid run 100(PE) 600M 50-60Gb 27h 0.1%, substit. $690 $52 Illumina HiSeq 2500 v2 Rapid run 150(PE) 600M 75-90Gb 40h 0.1%, substit. $690 $45 Illumina HiSeq 2500 v2 Rapid run 250(PE) 600M 125-150Gb 60h 0.1%, substit. $690 $40 Illumina HiSeq 2500 v3 50(PE) 3000M 135-150Gb 5.5d 0.1%, substit. $690 $78 Illumina HiSeq 2500 v3 100(PE) 3000M 270-300Gb 11d 0.1%, substit. $690 $45 Illumina HiSeq 2500 v4 50(PE) 4000M 180-200Gb 2.5d 0.1%, substit. $690 $58 Illumina HiSeq 2500 v4 100(PE) 4000M 360-400Gb 5d 0.1%, substit. $690 $45 Illumina HiSeq 2500 v4 125(PE) 4000M 450-500Gb 6d 0.1%, substit. $690 $30 Illumina HiSeq 3000/4000 150(PE) 2500B 650-750Gb 1-3.5d 0.1%, substit. $900 $22 Illumina HiSeq X 2 flow cells 150(PE) 6000B 1800Gb 3d 0.1%, substit. $1000 $7 454 GS Junior+ 400 avg. (SE, PE) 0.1M 70Mb 18h 1%, indel $108000 $19500 454 GS FLX Titanium XL+ 700 avg. (SE, PE) 1M 700Mb 23h 1%, indel $45000 $9500
Ion PGM 314 200(SE) 0.4-0.5M 30-50Mb 23h 1%, indel $49 $25-3500
Ion PGM 314 400(SE) 0.4-0.5M 60-100Mb 3.7h 1%, indel $49 $25-3500
Ion PGM 316 200(SE) 2-3M 300-500Mb 3h 1%, indel $49 $700-1000
Ion PGM 316 400(SE) 2-3M 600-1Gb 4.9h 1%, indel $49 $700-1000
Ion PGM 318 200(SE) 4-5.5M 0.6-1Gb 4h 1%, indel $49 $450-800
Ion PGM 318 400(SE) 4-5.5M 1-2Gb 7.3h 1%, indel $49 $450-800
Ion Proton 200(SE) 80M Up to 10Gb 4h 1%, indel $224 $80
Ion S5 520 200(SE) 3-5M 0.6-1Gb 2.5h 1%, indel $65 $2400
Ion S5 520 400(SE) 3-5M 1.2-2Gb 4h 1%, indel $65 $1200
Ion S5 530 200(SE) 15-20M 3-4Gb 2.5h 1%, indel $65 $950
Ion S5 530 400(SE) 15-20M 6-8Gb 4h 1%, indel $65 $475
Ion S5 540 200(SE) 60-80M 10-15Gb 2.5h 1%, indel $65 $300
Pacific BioSciences RS II ~20Kb ~550000 0.5-1Gb 2.5h 13% single pass, ⩽1% circular consensus read, indel $695 $1000 Oxford Nanopore MK 1 MinION Up to 200Kb >100000 Up to 1.5Gb Up to 48h ~12%, indel $1000 $750
bp, base pairs; d, days; Gb, gigabase pairs; h, hours; AT, adenine thymine; indel, insertions and deletions; Kb, kilobase pairs; M, million; Mb, megabase pairs; PE, paired-end; SE, single-end; substit, substitutions.
2.2 Next Generation Sequencing 21
2.2.2
Typical RNA sequencing experiment
RNA-Seq data can be employed in several downstream analyses and the design of the RNA experiment should reflect the specific goal of the study. Indeed, the choice of the right RNA preparation techniques, library preparation procedures and sequencing technologies can considerably affect the reliability and accuracy of the final analyses. The choices of sequencing depth, read coverage, read length, coverage uniformity, number of replicates (technical / biological), library type, etc. allow to shape the experiment to better fit specific requirements. For example, long reads are very important for de novo transcript assembly, while they have a minor effect on gene quantification. Conversely, the presence of replicates is extremely important for differential expression analysis, whereas they are less useful in de novo transcript assembly. The best tradeoff between these options highly depends on the available budget and the kind of downstream analysis. By the way, the different procedures for RNA processing, library preparation and sequencing introduce several experimental biases that are impossible to eliminate. For this reason, it is important to know the different sources of bias and design the experiment to minimize the ones which could impact the final analysis.
2.2.3
RNA processing
The first step in a RNA-Seq experiment is isolating and purifying RNAs. First, the cells are disrupted and the RNAs are extracted from the total cell lysate. The cell disruption is achieved using chaotropic agents and detergents and, depending on the sample / experimental protocol, a mechanical disruption could also be performed. The extraction of RNA from the cell lysate is usually performed by organic solvents or solid-phase extraction onto silica. In order to assess how the isolation step achieves both a preservation of RNA integrity and a separation of RNA from cellular materials, the RNA quality and quantity is usually assessed at the end of these steps.
The RNA extracted using the above procedure consists of several types of RNAs: more than 80-90% of total RNA is ribosomal RNA (rRNA) while messenger RNA (mRNA) represents less than 5% of the total RNA. If the study is not focused on rRNA, then a rRNA removing step is mandatory otherwise the great majority of reads would come from ribosomal RNAs. Moreover, the increased sequencing depth allows the identification of low expressed transcripts and rare variants. There are two methods that are commonly used for rRNA depletion: selection of target RNAs via hybridization to oligo-dT and removal of not-target RNAs via hybridization [44]. They work following opposite approaches, since the first one allows directly selecting mRNA while the second one selectively removes ribosomal RNA.
The first method uses oligo-dT to recover poly-adenylated RNAs by duplexing with their poly-A tails. For instance, mature mRNAs are selected by this process, while immature mRNAs and non-polyadenylated ncRNAs are lost. Poly-A selection method requires a high proportion of mRNA with minimal degradation and usually produces a higher overall fraction of reads falling onto known exons. The second method uses oligos that are complementary to highly conserved rRNA sequences. Different from the first method, this technique allows preserving non-polyadenylated RNAs and it is widely used for prokaryotic organism.
The last step before library preparation is RNA fragmentation. The RNA sequences are usually longer than current read lengths, therefore a fragmentation step is useful to both improve the transcriptome coverage and reach the appropriate size for sequencing. The original protocols performed the fragmentation step after the cDNA conversion, which is still mandatory when the first strand synthesis is performed using oligo-dT or when the goal is to sequence full length RNA transcripts. However, in recent years fragmentation of RNA before cDNA conversion is becoming more popular. The most commonly used RNA fragmentation techniques are enzymatic, heat, metal ion and sonication. The fragment sizes is determined by the NGS platform and the specific sequencing application. For example, gene expression analysis does not require long fragments while for analysis of transcription start and stop sites or alternative splicing a large insert size would be advisable.
2.2.4
Library preparation
The RNAs obtained by the previous steps are still not suitable for the sequencing process. Since RNA is much more labile than DNA and RNases are harder to inactivate compared to DNases, RNA extraction is a critical procedure.
Current sequencing technologies work with DNA as input, so the RNA must be converted to double stranded complementary DNA (cDNA). The conversion of RNA into cDNA ensures the stability of the sample’s information content. The current protocols use a particular type of polymerase known as reverse transcriptase (RT) to synthesize DNA from a RNA template. Reverse transcriptase requires a primer annealed to DNA or RNA to initiate the polymerization. There are several techniques for first-strand priming, the most used areoligo-dT andrandom primers. The first technique is one of the oldest first strand priming methods and uses oligo-dT to prime synthesis of the poly-A tail of mature RNA. Since the priming sequence is the same for all the mRNAs, they should be equally primed independently from their coding sequence. On the other hands, this technique works only for polyadenylated RNAs; for instance, not mature mRNAs or bacterial mRNAs are lost by this method. Obviously, this method requires to not fragment the RNA before the priming process. An important problem that affects this priming technique is the not uniformity
2.2 Next Generation Sequencing 23
in sequence coverage [1]. Indeed, the RT is not a highly processive polymerase and so it could prematurely terminate resulting in a higher coverage in the 3’-end compared with the 5’-end. The second technique employs primers with random sequences and it is probably the most used first strand synthesis method. Compared with oligo-dT, this technique shows a reduced 3’ coverage bias since the random primers could anneal throughout the length of the RNA. However, the priming process is not completely random and some nonuniformity in transcript coverage is still present [45]. Other advantages of this technique are the possibility to use RNA fragmentation and the recovering of non-polyadenylated RNAs.
After the first strand synthesis is completed, the second cDNA strand must be synthesized. As for the first strand synthesis, several options exist. One of the oldest and most used techniques employs E. coli DNA polymerase I for the synthesis, while E. coli RNase H is used to nick the RNA template and creates the RNA fragments that act as primers. The last step consists in the repairing of nicks and it is performed by T4 DNA ligase. This second strand synthesis procedure is highly efficient and well optimized, but has the major drawback of losing the RNA 5’ end. This disadvantage was tackled by some new techniques, which pre-ligates an adapter to the 5’ end of the RNA template and uses oligos that are complementary to this adapter to prime the second strand synthesis.
Once the cDNAs are ready, the next step in library preparation consists in adding adapter sequences at the ends of the fragments. Adapters are required by the different sequencing platforms both for clonal amplification and for priming the sequencing reaction. Even if they have the same function, the adapter composition is specific for the particular sequencing platform. Moreover, adapters could contain several optional elements employed by particular techniques (e.g. multiplexing, paired-end sequencing). For instance, adding to each library a specific tag (called index or barcode) in the adapter sequence allows the identification of which sequence comes from which library. This procedure allows to pool different libraries in a single sequencing reaction, saving both time and money. The process of pooling libraries from different experiments is known as multiplexing. Another useful procedure involves adapters containing sequencing priming sites for the opposite sides of the fragment. These adapter elements allow sequencing of both ends of the fragment (paired-end sequencing), resulting in a higher coverage. The additional information coming from having both ends of the fragments could be used to increase the accuracy in isoform detection [46] and in the mapping/assembly process [47].
Additional information about RNA strandedness could be collected by using so called
strand-specific protocols[48], i.e. protocols which allow creating libraries that retain the strand orientation of the original RNA. Several strand specific protocols exist [49], falling into two main classes. The first class works marking one strand, either through a bisulfite
treatment on the RNA or during the synthesis of the second strand, and performing then a degradation of the unmarked strand. The second class of methods marks the 5’ end and the 3’ end of the original mRNA with different adapters, employing a known orientation pattern in the attaching process. One of the most used protocols belongs to the first class and is based on the idea of performing the cDNA conversion and removing one of the two strands selectively, by using dUTP for the synthesis of the second strand. The knowledge of which strand a read comes from may be exploited by many applications such as the identification of antisense transcripts, the determination of expression levels of coding/noncoding overlapping transcripts and the determination of the transcribed strand of noncoding RNAs.
The final step in library preparation entails a number of PCR cycles to enrich for product that has adapters ligated to both ends. However, amplification is the source of several biases, as the well documented relation between GC content and PCR amplification efficiency [37, 50]. For this reason, it is advisable to minimize the amplification steps, even if it is challenging for samples with low input.
2.2.5
Sequencing
Sequencing is the last step in the data production process. There are several sequencing platforms available, each one using different proprietary technologies and chemistries. The current leading platform is Illumina, followed by IonTorrent and PacBio. Legacy platforms such as SOLiD and 454 are still used, even if they have been employed less frequently in recent years. Each sequencing platform has unique strengths and weaknesses, so the choice of platform depends on the goal of the study. For instance, a transcriptome assembly study could benefit from PacBio long reads, while for a differential expression study the Illumina high sequencing depth could be the best choice.
2.3 RNA sequencing analysis pipeline 25
2.3
RNA sequencing analysis pipeline
The output of a RNA-Seq experiment, as any other NGS experiment, consists of one or more read files. In order to achieve useful information from the reads, the analysis of RNA sequencing data requires the design of a complex analysis pipeline (Figure 2.8). The first part
Sequencing
Quality control and read preprocessing Read alignment Postprocessing Quan�fica�on and differen�al expression Gene fusion discovery
Medicine, Biology, Pharmacology, etc.
…
Da
ta
pre
pr
oc
essin
g
Da
ta
an
aly
sis
Alterna�ve splicing analysisFig. 2.8RNA-Seq analysis pipeline.Flowchart of a typical RNA-Seq analysis pipeline. The first part of the pipeline (Data preprocessing) handles sequencing reads. The second part (Data analysis), exploits the processed RNA-Seq data to perform a variety of downstream analyses.
of the pipeline (Data preprocessing) analyzes the available reads, with the goal of accurate identification of the relation between the read sequences and the sequenced transcripts. Once the raw RNA-Seq data are processed, the second part of the pipeline (Data analysis) exploits the collected information to perform a wide range of downstream analyses, depending on the particular application. A more detailed description about data preprocessing and data analysis stages is provided in the next sections.
2.3.1
Data preprocessing
Once the reads are produced by the sequencing platform, many processing steps are per-formed in order to exploit the information contained in the reads sequences. Except for some conversion format procedures, the first task in the read analysis is a quality control step to assess the overall outcome of the sequencing process. This step allows the identification of possible issues and the application of a specific set of corrections. Once the quality of the reads is assessed, the next step involves the identification of which transcripts are present in the sequenced sample. This goal is achieved by aligning the available reads against a reference sequence such as a genome or a transcriptome. A brief description of the steps involved in the data preprocessing stage is presented below.
Quality control and reads preprocessing
Reads coming from sequencing output are usually analyzed in order to assess the quality of the dataset and identify potential sequencing errors, contamination and PCR artifacts. The quality control step involves the analysis of GC content, sequence quality (bases quality values), overrepresented k-mers, duplicated reads and adapters presence. Unfortunately, the evaluation of the previous elements is not trivial due to the dependency of many of these metrics on the particular experiment and organism. For example, the threshold for GC content level should be set depending on the organism, while the rate of duplicated reads would be different in experiment involving low or high input quantities. Once the correct scenario for the particular dataset is defined, there are many tools to perform reads quality control, as the popular software FASTQC [51].
When one or more of the previous analyses highlight some issues, several procedures could be adopted depending on the detected problem. For example, once an adapter sequence is detected at the end of a read or poor quality bases are identified, a common action consists in trimming this part of the read. On the other hand, in the case of contamination or a low quality read the usual procedure consists in removing the entire read from the dataset. Software such FASTX-Toolkit [52], NGS QC Toolkit [53], CutAdapt [54] and Trimmomatic [55] can be used to perform trimming and filtering. However, the definition of a robust procedure for read trimming and deleting is challenging and it is often specific for the particular dataset and experiment. In addition, the chosen tradeoff between overall quality and number of preserved reads could have a major role in the accuracy of many downstream analyses.
2.3 RNA sequencing analysis pipeline 27
Read alignment
After quality control, the next step of read processing is theread alignment. The termread alignmentorread mappingrefers to the process of finding the read locations in a reference sequence such as a genome.
Read alignment has a pivotal role in the RNA-Seq analysis because it represents the step which extracts the information produced by sequencing and finally makes the reads usable and informative. Therefore, alignment accuracy would heavily affect the reliability of many downstream analyses, making this process the most critical step in the data preprocessing part of the RNA-Seq analysis pipeline.
The read alignment process is particularly challenging both in terms of efficiency and accuracy. The sizes of the reference genomes (from hundreds of thousands up to billions of bases) and the large amount of reads (tens or hundreds of millions) make read mapping a com-putationally intensive task. Typically, finding the correct positions of available reads in the reference genome requires tens of GB of RAM and many CPU hours on a multicore machine. What makes alignment even harder is the presence of sequencing errors, low complexity sequences, polymorphisms, insertions and deletions which require inexact matches between the read and the reference sequence and smart alignment strategies to avoid repetitive regions. In addition, the main challenge is identifying splice junctions correctly, since the reads come from transcriptome but the alignment reference sequence is the genome. For this reason, the alignment process should properly handle intron sized gaps, intron signals, incomplete annotation, alternative splicing and pathological splicing events. The alignment methods able to performspliced alignmentare calledsplice awaretools, as opposed to classic DNA aligners identified assplice unawaretools. Software such as STAR [56] and TopHat2 [57] are examples of widely used splice aware aligners.
Even though a genome is employed as reference sequence is the great majority of RNA-Seq studies, few alternatives exist. First, reads can be mapped to the transcriptome using a splice unaware tool such as BWA [58] and Bowtie2 [59], with the main advantage of requiring a low computational effort. However, aligning reads against a transcriptome has the main limitation to preclude the discovery of new and unannotated transcripts and its accuracy is heavily affected by the reliability of the available annotation. The second option consists in de novo assembly of the reads into a transcriptome using tools such as SOAPdenovo-Trans [60], SOAPdenovo-Trans-ABySS [61] and Trinity [62] and then performing an unspliced alignment against the inferred transcriptome. Although assembly methods allow de-novo transcripts discovery, they are more computationally intensive than read alignment, resulting in efficient applications only on small genomes (e.g. archaea genomes).
The pivotal importance of the alignment step and the consequent big effort of the bioin-formatics community resulted in the availability of a large number of splice aware methods. Since 2009, more than 20 splice aware software were developed by the research community, making the choice of the right aligner a non-trivial step.
Postprocessing
Depending on the particular downstream analysis, a read alignment postprocessing step may be necessary. Typical postprocessing actions involve file format conversion, alignment sorting, alignment filtering and generation of alignment statistics. Alignment statistics usually report the number of aligned/unaligned reads, reads mapped to multiple locations, potential PCR duplicates, etc. These statistics are useful to identify potential issues (e.g. very low percentage of mapped reads) rather that to assess the accuracy of the alignment process (e.g. a high percentage of mapped reads does not necessarily mean that the reads are mapped correctly). Software such as SAMTOOLS [63] and Picard [64] are commonly used for read alignment postprocessing.
2.3.2
Data analysis
Once the reads are aligned to a reference sequence, and an optional preprocessing step is performed, the second part of the RNA-Seq analysis pipeline exploits this information through a wide range of analyses. Preprocessed RNA-Seq data could be employed in several applications to both identifying transcript characteristics and quantifying transcript abundances.
The most common application involves the quantification of gene/transcript expression levels among samples followed by differential expression analyses. A brief description of this analysis is presented below. However, RNA-Seq data are suitable for many other analyses such as alternative splicing analysis, gene fusion discovery, allele specific expression, non-coding RNA discovery, single nucleotide variants identification, etc. making RNA-Seq one of the most powerful and flexible techniques for transcriptomic studies.
Quantification and differential expression analyses
Estimation of gene/transcript expression level is the most common application of RNA-Seq studies. The idea behind expression level quantification is that the number of reads that map to each transcribed sequence is a good proxy of its expression level. Quantification could be performed at the transcript, gene or exon level, depending on which coding units is employed to summarize the raw counts of mapped reads. The number of reads overlapping the chosen
2.3 RNA sequencing analysis pipeline 29
feature is used as a digital measure of its expression level and is calledcounts. Provided with the read alignment file and an annotation file, usually in GTF, GFF or BED format, tools such as featureCounts [65], HTSeq-count [66] and BedTools [67] are able to compute the counts of each feature included in the input annotation. As any other downstream analysis, the reliability of expression level quantification heavily relies on the accuracy of the read alignment step. In addition, it was demonstrated that even the choice of annotation has a strong impact on the quantification results [68].
Unfortunately, raw read counts are not suitable for comparing expression levels within and between samples since these values are affected by several biases. In order to remove or at least mitigate these effects, several normalization techniques were developed to both handle within-sample and between-sample biases. Within-sample normalization allows an unbiased comparison of expression levels within the sample, handling effects such as the different feature lengths. Instead, between-sample normalizations like TPM (transcripts per million) [69], TMM [70], DESeq[71] and UpperQuantile [6] allow a fair comparison of expression levels between the samples, correcting effects such as differences in the library sizes. In the context of DE analysis, between-sample differences have to be corrected while some within-sample biases may cancel out when comparing samples. Finally, the widely used RPKM (reads per kilobase of exon model per million reads) [2] and FPKM (fragments per kilobase of exon model per million mapped reads) [72] are examples of approaches that perform both types of normalizations. Sophisticated tools such as Cufflinks [72], RSEM [73] and eXpress [74] are able to quantify at the gene/transcript level and at the same time perform a normalization procedure.
Finally, differential expression analysis is performed employing a test statistics which selects the genes/transcripts for which expression levels (i.e. normalized counts) are signifi-cantly different between the compared conditions. Several tools have been developed for this task, both using parametric and non-parametric approaches. Methods such as edgeR [75] and DESeq2 [76] employ a negative binomial model to describe the data, while EBSeq [77] and baySeq [78] exploit a Bayesian approach, also based on the negative binomial model. Other approaches exploit the sample variance to create discrete expression level distributions and analyze them using a regular linear model [79]. On the other hand, non-parametric methods such as NOISeq [80] or SAMseq [81] estimate the null distribution from the counts alone with minimal assumptions about the data. Several independent studies have revealed that no single method clearly outperforms the others and performance is highly dependent of the particular dataset [82–84].
Chapter 3
Read alignment
The output of the sequencing process consists of millions of reads, short sequences repre-senting fragments of the transcripts in the original sample. As seen in the previous chapter, the ali
![Fig. 2.3 Illumina sequencing. Main steps involved in the Illumina sequencing process. Image taken from [23].](https://thumb-us.123doks.com/thumbv2/123dok_us/467359.2555097/28.892.124.762.533.852/illumina-sequencing-main-involved-illumina-sequencing-process-image.webp)
![Table A.1 Overview of SAM file mandatory fields. Table adapted from [63]](https://thumb-us.123doks.com/thumbv2/123dok_us/467359.2555097/146.892.106.762.310.554/table-overview-sam-file-mandatory-fields-table-adapted.webp)