Assessing Recent Selection and Functionality at Long
Noncoding RNA Loci in the Mouse Genome
R. Axel W. Wiberg
1,4,*, Daniel L. Halligan
1, Rob W. Ness
1, Anamaria Necsulea
2, Henrik Kaessmann
3,
and Peter D. Keightley
11Institute of Evolutionary Biology, University of Edinburgh, United Kingdom
2School of Life Sciences, Ecole Polytechnique Fe´de´rale Lausanne, Lausanne, Switzerland
3
Center for Integrative Genomics, University of Lausanne, Switzerland
4
Present address: Centre for Biological Diversity, School of Biology, University of St. Andrews, United Kingdom
*Corresponding author: E-mail: [email protected].
Associate editor:Josefa Gonzalez
Accepted:August 3, 2015
Abstract
Long noncoding RNAs (lncRNAs) are one of the most intensively studied groups of noncoding elements. Debate continues over what proportion of lncRNAs are functional or merely represent transcriptional noise. Although characterization of individual lncRNAs has identified approximately 200 functional loci across the Eukarya, general surveys have found only modest or no evidence of long-term evolutionary conservation. Although this lack of conservation suggests that most lncRNAs are nonfunctional, the possibility remains that some represent recent evolutionary innovations. We examine recent selection pressures acting on lncRNAs in mouse populations. We compare patterns of within-species nucleotide variation at approximately 10,000 lncRNA loci in a cohort of the wild house mouse, Mus musculus castaneus, with between-species nucleotide divergence from the rat (Rattus norvegicus). Loci under selective constraint are expected to show reduced nucleotide diversity and divergence. We find limited evidence of sequence conservation compared with putatively neutrally evolving ancestral repeats (ARs). Comparisons of sequence diversity and divergence between ARs, protein-coding (PC) exons and lncRNAs, and the associated flanking regions, show weak, but significantly lower levels of sequence diversity and divergence at lncRNAs compared with ARs. lncRNAs conserved deep in the vertebrate phylogeny show lower within-species sequence diversity than lncRNAs in general. A set of 74 functionally characterized lncRNAs show levels of diversity and divergence comparable to PC exons, suggesting that these lncRNAs are under substantial selective constraints. Our results suggest that, in mouse populations, most lncRNA loci evolve at rates similar to ARs, whereas older lncRNAs tend to show signals of selection similar to PC genes.
Key words:long noncoding RNAs, selection, genomics, functionality.
Introduction
Noncoding RNAs (ncRNAs), including transfer RNAs and ribosomal RNAs, are well established as key functional elements of the cellular machinery (Mattick and Makunin 2006). Recently, large-scale transcriptomics studies have revealed that a high proportion of the eukaryotic genome is transcribed, and this has led to the proposal of new classes of ncRNAs and to the addition of many new members to already existing classes. One of the most interesting classes is the long ncRNAs (lncRNAs) (Okazaki et al. 2002;Carninci et al. 2005; Mattick and Makunin 2006;Mercer et al. 2009), which are typically defined as transcribed RNA fragments exceeding a
length threshold of 200 bp (Amaral et al. 2011;Brown et al. 2012;Kapusta et al. 2013). Many lncRNAs have been shown to be important regulators of gene expression (Ilik and Akhtar 2009;Rinn and Chang 2012). Increasing numbers have been predicted in various genomes, including a recent estimate of approximately 58,000 lncRNA loci in the human genome (Iyer et al. 2015). More recently, lncRNAs have been the topic of much debate concerning their functionality.
Large sets of lncRNAs and other noncoding transcripts have been identified by high-throughput genomic methods. Thousands of lncRNAs have been identified and annotated using methods such as DNA sequence tagging that indicate
GBE
ßThe Author(s) 2015. Published by Oxford University Press on behalf of the Society for Molecular Biology and Evolution.
This is an Open Access article distributed under the terms of the Creative Commons Attribution Non-Commercial License (http://creativecommons.org/licenses/by-nc/4.0/), which permits non-commercial re-use, distribution, and reproduction in any medium, provided the original work is properly cited. For non-commercial re-use, please contact [email protected]
at St Andrews University Library on September 25, 2015
http://gbe.oxfordjournals.org/
50and 30transcript boundaries (Okazaki et al. 2002;Carninci
et al. 2005; Ponjavic and Ponting 2007), “chromatin state maps” that reveal regions of chromatin suggestive of active transcription (Guttman et al. 2009) and, more recently, RNA sequencing (RNA-seq) to directly investigate the transcriptome (Necsulea et al. 2014). To assess the noncoding status of a region of interest, the potential for a DNA sequence to encode a protein can be assessed by a variety of algorithms (Lin et al. 2008). One example is the codon substitution frequency (CSF) metric, which assesses protein-coding (PC) potential by examining the relative frequency of synonymous and nonsynonymous codon substitutions (Lin et al. 2007).
Although little is known about the function for most identified lncRNAs, several individual loci are now known to be important in the control of gene expression, suggesting that they could constitute an important set of regulatory elements (Rinn and Chang 2012). One example is that of theAirlocus in mice (AntisenseIgf2rRNA), which is involved in silencing the paternalIgf2rallele incis.Airalso silences the paternal alleles of other, nearby genes (Sleutels et al. 2002; Nagano et al. 2008;Latos et al. 2012). The human homolog ofAir,AIRN, was found to have conserved function (Yotova et al. 2008). Another well-known example isXist, which is involved in X-chromosome inactivation in mammals by localizing to multiple regions on the X chromosome and recruiting other molecules that repress transcription (Nesterova et al. 2001; Engreitz et al. 2013). Several other examples are detailed in table 1of Ilik and Akhtar (2009) and in the online lncRNA database (Amaral et al. 2011; Quek et al. 2014).
The involvement of individual lncRNAs in gene regulation leads to the question of the relative importance of lncRNAs evolution and PC gene evolution to adaptation (Kapranov et al. 2007; Mercer et al. 2009; Ponting et al. 2009; Guttman et al. 2009;Brown et al. 2012;Kutter et al. 2012; Kapusta et al. 2013). An extreme view proposes that lncRNAs represent mostly “transcriptional noise” from an inherently stochastic transcription machinery (Ponjavic et al. 2007; Doolittle 2012). Efforts to study functionality have mostly consisted either of the detailed characterization of individual lncRNAs or surveys of large sets of lncRNAs to search for evolutionary signals indicative of function. Although initial large-scale studies found little evidence of evolutionary constraint (Okazaki et al. 2002;Wang et al. 2004;Carninci et al. 2005;Maeda et al. 2006;Ponjavic et al. 2007;Marques and Ponting 2009;Guttman et al. 2009;Derrien et al. 2012), evidence is mounting that at least some lncRNAs are conserved (Sleutels et al. 2002;Espinoza et al. 2004,2007; Nagano et al. 2008;Yotova et al. 2008;Ilik and Akhtar 2009; Necsulea et al. 2014).
Early work on approximately 15,800 FANTOM 2 ncRNA transcripts identified in mice found that they did not differ in level of sequence conservation compared with a putatively neutrally evolving set of control sequences (Wang et al. 2004).
In further analysis of the most stringently annotated set of lncRNAs from the FANTOM 2 and 3 project data sets (Okazaki et al. 2002; Carninci et al. 2005; Maeda et al. 2006;Ponjavic et al. 2007) substitution rates were found to be depressed by approximately 10% between mouse and rat, relative to putatively neutrally evolving ancestral repeat (AR) sequences (Ponjavic et al. 2007).Ponjavic et al.(2007)also found conservation in both the sequence of the ncRNAs themselves and their promoter regions (taken to be the 400 nt immediately upstream of the ncRNA transcriptional start site). Similarly, analysis of a novel set of lncRNAs identified byGuttman et al. (2009)revealed that both the sequence of the lncRNAs and promoter regions were conserved compared with random genomic fragments. Taking advantage of both the FANTOM and Guttman et al. data sets, Marques and Ponting (2009)found that substitution rates were depressed by approximately 10–12% relative to ARs. More recently, a study of approximately 9,000 human lncRNA loci from the GENCODE consortium showed higher PhastCons scores than ARs, but conservation was still substantially lower than PC loci (Derrien et al. 2012). Furthermore, derived allele frequencies in a human polymorphism data set were significantly lower at lncRNA loci than for random intergenic regions, though differences were small (Necsulea et al. 2014). However, results appear to vary across lineages: Approximately 35.8% of mutations within Drosophila melanogaster lncRNAs have been found to be weakly deleterious, whereas in Homo sapiens all mutations have been estimated to be effectively neutral, an effect that could be attributed to differences in effective population sizes (Haerty and Ponting 2013).
Here, we test for evidence of recent selection on lncRNAs using a genome-wide polymorphism data set from the wild house mouse speciesMus musculus castaneusand a newly described, large data set of lncRNAs identified in the mouse genome (Necsulea et al. 2014). The house mouse represents an excellent study system for evolutionary analysis, due to its large effective population size (Ne) in the wild, which is
expected to reduce the effects of genetic drift and increase the efficacy of selection compared with species with lowerNe,
such as humans (Charlesworth 2009;Phifer-Rixey et al. 2012; Haerty and Ponting 2013). Furthermore, extensive functional genomics and genetic resources are available for the mouse, which has become an important model species for functional investigation of lncRNAs.
We assess the evidence for recent purifying selection at lncRNA loci and compare the extent of selection at lncRNAs with functional loci known to be under evolutionary constraints, such as PC genes. We examine patterns of diversity in regions flanking the focal loci to investigate selection at these loci. We also examine the extent of recent purifying selection within modern wild mouse populations at lncRNA loci of varying evolutionary ages and at lncRNAs expressed in different tissue types.
lncRNA Loci in the Mouse Genome
GBE
at St Andrews University Library on September 25, 2015
http://gbe.oxfordjournals.org/
Materials and Methods
lncRNA Data Set
In this study, we focus on a set of 10,088 mouse lncRNAs from a recent large-scale evolutionary study (Necsulea et al. 2014). This data set provides an estimate of the evolutionary age of lncRNA loci, allowing us to test for a relationship between within-species diversity and long-term evolutionary conservation. The evolutionary ages used here were determined by the phylogenetic distribution in species in which homologous sequence was detected and for which there was evidence of transcription at orthologous lncRNA loci (Necsulea et al. 2014). If homologous sequences and transcription evidence could be found across all amniotes, but not in the nonamniote species, then the age of the locus was set as the approximate age of the amniote lineage. This therefore represents a minimum estimate of the evolutionary age, because the reliable detection of transcription becomes difficult for genes that are not highly expressed and because homologous sequence identification is difficult for fast-evolving loci (Necsulea et al. 2014). Additionally, in the current data set it is possible to divide lncRNAs depending on the tissue in which they are maximally expressed, as measured by reads per kilobase per million mapped reads. Such a division might uncover selection acting on biologically important groups of lncRNAs. Finally, to partly control for potentially higher levels of conservation at lncRNAs near protein-coding genes, lncRNAs were also grouped into intronic or intergenic lncRNAs. Intergenic lncRNAs are defined here as any lncRNA that did not overlap with an Ensembl annotation protein-coding gene.
We analyzed sequence diversity in this set of lncRNAs using the genome sequences of ten wildM. m. castaneusaligned to the NCBIM37 mm9 mouse reference genome (Halligan et al.
2013). Additionally, we examine nucleotide divergence between mouse and rat using the alignment of the mm9 mouse reference genome to the rat (rn4,Rattus norvegicus) reference genome. These alignments are available from the UCSC Genome Browser (Kent et al. 2002). We compare levels of diversity and divergence at lncRNA loci with levels at putatively neutrally evolving AR loci and evolutionarily conserved PC loci. We also investigate the patterns of diversity and divergence in the genomic regions flanking these loci to determine to what extent characteristic signals of selection are present at these loci.
[image:3.595.51.546.121.269.2]To ensure that the sequences analyzed are correctly assigned to the above groups, a number of filtering steps were applied prior to analysis. The regions corresponding to the most divergent lncRNAs from the mm9–rn4 alignments were visually inspected to ensure that extreme divergence was not due to unreliable alignments, and none were rejected. We note that the use of a single rat genome as an outgroup does not allow for discrimination between diversity within rat and divergence between mouse and rat, thus we likely overestimate the extent of between-species divergence. Some lncRNAs overlap with known PC exons. To avoid confounding diversity at lncRNA loci with diversity at neighboring PC loci, a procedure for removing known elements from the data sets was carried out. Overlapping elements were always completely removed regardless of annotated strand. If neutrally evolving sites are considered in flanking regions it is possible to determine the effect of selection at a focal locus on diversity at linked neutral sites, either through genetic hitchhiking (Maynard-Smith and Haigh 1974) or through background selection (Charlesworth et al. 1993). Both of these mechanisms are expected to lead to diversity reductions at linked sites resulting in a dip around the selected site. Examining diversity in sequences surrounding
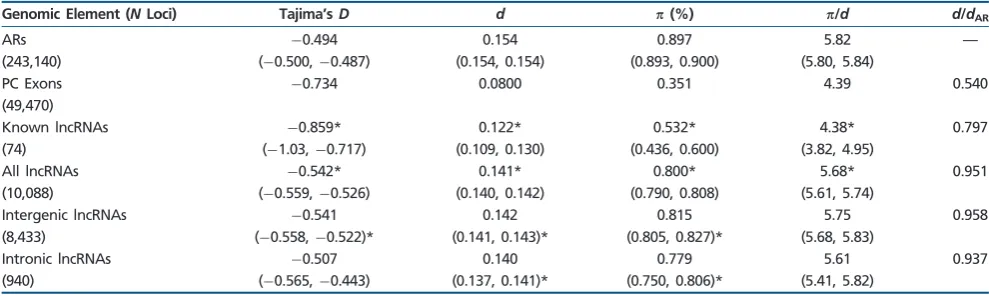
Table 1
Point Estimates and Number of Loci (N) for Divergence and Diversity (%) Measures across Groups of Genomic Elements and Divergence Ratios (Ratio of Median Divergence across Loci to Median Divergence at ARs)
Genomic Element (NLoci) Tajima’sD d p(%) p/d d/dAR
ARs 0.494 0.154 0.897 5.82 —
(243,140) (0.500,0.487) (0.154, 0.154) (0.893, 0.900) (5.80, 5.84)
PC Exons 0.734 0.0800 0.351 4.39 0.540 (49,470)
Known lncRNAs 0.859* 0.122* 0.532* 4.38* 0.797 (74) (1.03,0.717) (0.109, 0.130) (0.436, 0.600) (3.82, 4.95)
All lncRNAs 0.542* 0.141* 0.800* 5.68* 0.951 (10,088) (0.559,0.526) (0.140, 0.142) (0.790, 0.808) (5.61, 5.74)
Intergenic lncRNAs 0.541 0.142 0.815 5.75 0.958 (8,433) (0.558,0.522)* (0.141, 0.143)* (0.805, 0.827)* (5.68, 5.83)
Intronic lncRNAs 0.507 0.140 0.779 5.61 0.937 (940) (0.565,0.443) (0.137, 0.141)* (0.750, 0.806)* (5.41, 5.82)
NOTE.—Bootstrapped 95% confidence intervals are given in brackets. Age group-specific estimates of diversity measures with significantly different distribution of values, after a Bonferroni correction, when compared with the bootstrap distribution of ARs are denoted with * (actualPvalues are reported insupplementary table S5, Supplementary Materialonline).
Wiberg et al.
GBE
at St Andrews University Library on September 25, 2015
http://gbe.oxfordjournals.org/
a focal site allows the identification of signals of selection (Sattath et al. 2011;Hernandez et al. 2011;Halligan et al. 2013). To this end, sites that could potentially be under selec-tion in the flanking regions of all focal loci (PC exons, lncRNAs, and ARs) were removed as follows. At lncRNA loci, PC loci and their associated untranslated regions (UTRs) were removed, resulting in the complete removal of 51 lncRNA loci. Conserved noncoding elements (CNEs), PC exons, and UTRs were removed from flanking regions of lncRNA loci. At AR loci, PC loci, associated UTR, and lncRNA loci were removed to ensure that ARs analyzed were as far as possible neutrally evolving. CNE loci, lncRNAs, PC exons, and UTRs were removed from the flanking regions of AR loci. At PC loci and their UTRs, overlapping lncRNA loci were removed. CNEs and lncRNA loci were removed from the flanking regions of PC loci. Loci that mapped to sex chromosomes (191 loci) were excluded from the analyses, because such loci are likely to have had different selective and mutational pressures (Charlesworth et al. 1987;Baines and Harr 2007; Kousathanas et al. 2014). This resulted in a data set comprising 10,088 lncRNA loci from an initial set of 10,330.
To establish the level of evolutionary signal that can be expected from functional lncRNAs, a set of 108 well-characterized lncRNAs from the mouse were downloaded from the lncRNA database (Amaral et al. 2011;Quek et al. 2014). As some of these loci may have been selected for further experiments based on their evolutionary conserva-tion, we note that they are potentially biased toward more conserved sequence. We used BLAT (Kent 2002) with default settings to determine the genomic positions of exons in these loci. A single best hit for each locus was chosen on the basis of highest bit score and sequence identity. Many of the entries in the database represent al-ternative isoforms of the same locus. If the best hit locations of two or more isoforms overlapped the same region in the mouse genome, the longest isoform was kept and the others discarded from further analysis. The final set was manually checked and ambiguously defined and overlapping loci removed. A total of 74 autosomal loci were recovered (supplementary table S1, Supplementary Material online) and analyzed as described below. Of these 74 loci of known function, the positions of 23 loci overlap with coun-terparts in the larger data set of 10,088. The remaining 51 are not present in our selected data set, generally due to the lack of detectable expression in the transcriptome data set used byNecsulea et al. (2014)or because they could not be unambiguously assigned to one-to-one orthologous gene families across species. In some cases, these lncRNAs were filtered out of the original data set due to overlap with annotated PC genes, or because they were classified as PC based on their CSF score or based on the presence of sequence similarity with known protein and protein domains (Necsulea et al. 2014).
Signatures of Selection
As a putatively neutrally evolving standard against which to compare the lncRNA loci, a set of ARs were used. ARs are transposable elements inserted in the genome before the split between two lineages (in this case mouse and rat) that have remained at that location. Although there are some ARs that show evidence of functionality, the available evidence suggests that the majority evolves at similar rates to that expected under neutrality (Mouse Genome Sequencing Consortium 2002; Chiaromonte et al. 2003; Lunter et al. 2006;Marques and Ponting 2009;Eo¨ry et al. 2010; Kutter et al. 2012). Because the mutation rate, and therefore the rate of neutral evolution, varies across the genome, we examined closely linked ARs and focal loci. To this end, only AR loci within 10,000 bp up or downstream of a lncRNA locus were used in this study. Additionally, the set of all known PC exons and UTRs from the Ensembl 62 database was used as an example of loci believed to be under both negative and positive selections (Halligan et al. 2013).
Nucleotide diversity around the different genomic elements (lncRNAs, PC exons and ARs) was estimated with set of custom Python scripts from pooled, folded site frequency spectra (SFSs) across the loci. Estimating diversity and divergence from a pooled SFS across loci should reduce the effect of variation in estimates that is to due short alignments. Nucleotide diversity (), divergence to rat (d),/d, an estimate of diversity corrected for regional variation in the mutation rate, and Tajima’s D statistics were calculated for all focal loci individually and for a series of 50 nonoverlapping 1,000 nt windows upstream and downstream flanking regions of these loci (lncRNAs, PC exons, and ARs). CpG sites are known to be hypermutable in mammals and can thus lead to biases in the estimates of substitution rates if some regions are more enriched for CpG sites. Analyses were therefore carried out excluding CpG-prone sites (defined as any site either preceded by a C or followed by a G). Examining diversity in sequences surrounding a focal class of sites has previously been employed in other studies to identify signals of selection (Sattath et al. 2011;Hernandez et al. 2011; Halligan et al. 2013), because both genetic hitchhiking (Maynard-Smith and Haigh 1974) and background selection (Charlesworth et al. 1993) are expected to cause diversity reductions at linked sites resulting in a characteristic “dip” around the selected site.
Statistical Tests of Diversity and Divergence Estimates
Formal tests of differences in conservation were performed using the estimates of divergence and diversity calculated as described above. Divergence ratios (dfocal/dneutral) measure the extent of depression in nucleotide divergence at a locus compared with a putatively neutrally evolving reference. These depressions were assessed by taking the ratio of divergence at lncRNA or PC loci to the median value for a
lncRNA Loci in the Mouse Genome
GBE
at St Andrews University Library on September 25, 2015
http://gbe.oxfordjournals.org/
set of ARs,dAR, that is,dlocus/dAR, wheredlocusis the median (d) from the distribution ofdacross all the focal loci (all other numbers reported below are estimates from a pooled SFS across loci). Regression models were used to investigate the relationship between evolutionary age and diversity. Two models were built for each of the diversity-related statistics (Tajima’sD,, and/d), one including a quadratic term and a linear term, and one including only a linear term. The best-fitting models were chosen by F-tests comparing nested models. Nonparametric 95% confidence intervals were obtained by 1,000 rounds of bootstrap sampling of the loci, allowing an unpaired two-tailed test of the degree of overlap between distributions of divergence and diversity statistics between different groups of lncRNAs and ARs. Patterns of diversity in flanking regions around focal loci can be described by nonlinear least squares models. Parameters were estimated for the equation/d& A(1Bexp(abs(x)/q)) wherexis the distance from the focal locus. The termAestimates the neutral level of/dasx
tends toward infinity. The termBestimates the reduction in /dwhenx= 0. Finally,qestimates the distance over which neutral levels of /d is recovered (Hernandez et al. 2011; Halligan et al. 2013). This model was compared with a nested model including only the term A (i.e., where B= 0) by anF-test which tests whether a model with a reduction in diversity closer to the focal loci is better than a model without such a reduction. All statistical tests and calculations were performed in R (R Development Core Team 2008).
Results
Summary statistics for the data sets (and subsets) analyzed in this study are shown in supplementary tables S2–S4, Supplementary Materialonline. In total, 10,088 lncRNA loci (and 74 loci of known function) are considered in this study. These loci have been split on the basis of the estimated minimum evolutionary age, ranging from 370 to 12 Myr, and on the basis of expression in different tissue types (Adkins et al. 2001; Springer et al. 2004; Necsulea et al. 2014). The “mouse” group is given an age of 12 Myr, as evidence of transcription of these lncRNAs comes only from contemporary mouse populations and 12 Myr is the earliest estimated split between mouse and rat (Adkins et al. 2001; Springer et al. 2004). However, RNA-seq data for these loci are not available for rat and these loci may not all be mouse-specific. The age groups differ in the number of lncRNAs they contain, ranging from 7,306 to 62 loci, but neither the average nor the median lengths of lncRNA loci vary substantially across the different age groups (supplementary table S3,Supplementary Materialonline). In total, 423 loci in the data set show evidence of transcription in primates only, although homologous sequences could be identified in the mouse. These loci are included in the group of all lncRNAs, but have been excluded from the analyses of different age
groups to include only the loci from different age groups that are most likely to be active in the contemporary mouse genome. Of the 22 lncRNA loci of known function that also occur in the larger data set, 12 are described as mouse-specific in the annotation of the larger data set. A further six loci are found across the Eutherian lineage and the remaining two loci across Tetrapods and across Mammals.
Patterns of Diversity at Focal Loci
ARs show the highest level of diversity (= 0.897%), PC exons show the lowest level (= 0.351%), and the group of all lncRNAs shows a level of diversity slightly, though significantly, lower than ARs (= 0.800%) (table 1). Similar patterns (highest in ARs, lowest in PC exons, and an intermediate level in lncRNAs) hold for all measures of diversity and divergence (, d, /d, and Tajima’s D) (table 1). For all lncRNA loci, unpaired two-tailed tests indicate that there is a significant reduction for all diversity measures (,d,/d,and Tajima’sD) of lncRNAs compared with distributions for ARs (table 1, supplementary table S5, Supplementary Material online, all P<0.01). The divergence ratio (measured as
dlocus/dAR) at lncRNAs is approximately 0.95 (table 1). For comparison, the divergence ratio for PC exons is 0.540 (table 1). The divergence ratio for the 74 lncRNAs of known function is also lower than that for set of all lncRNAs (0.797; table 1). Differences in diversity and divergence measures between intergenic and intronic lncRNAs are small although intronic lncRNAs did show consistently lower levels of diversity and divergence (table 1,figs. 1and2).
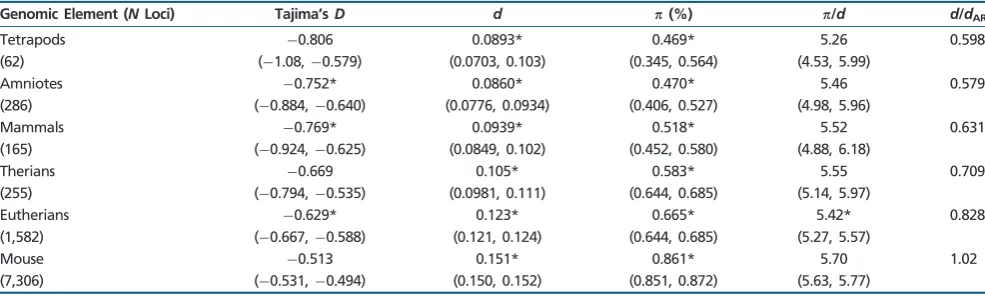
Patterns of variation in the different lncRNA age groups suggest a trend of decreasing within-species diversity with increasing age (table 2andfig. 1). Linear regression models describing the relationship between the diversity estimates (,
d,/d,and Tajima’sD) and evolutionary age support this trend of reduction of,d,and Tajima’sDwith age (supplementary figs. S1–S4andtables S6–S9,Supplementary Materialonline). However, this trend is marginally nonsignificant for /d
(diversity controlled for substitution rates) (supplementary table S9 and fig. S3, Supplementary Material online). Similarly, pairwise comparisons between the bootstrap distri-butions of diversity and divergence measures (,d,/dand Tajima’s D) for each age group and the distributions for ARs give statistical support for most differences, except in the cases of/dand Tajima’sD (table 2). The greatest reductions in diversity (/d= 5.26) are seen in lncRNAs common to all Tetrapods, representing about 0.6% of the total number of lncRNAs in the data set. The value of /d is significantly different between lncRNAs and ARs in the case of only one age group (Eutherians = 5.42 vs. ARs = 5.82, P<0.0001; table 2) which represents about 16% of the total number of lncRNAs in the data set. These patterns all hold even when lncRNAs are grouped into fewer categories based on age (supplementary tables S10andS11,Supplementary Material
Wiberg et al.
GBE
at St Andrews University Library on September 25, 2015
http://gbe.oxfordjournals.org/
online).Figure 1also shows that confidence intervals of some diversity measures for older age groups, while overlapping with confidence intervals for ARs, also overlap the point estimates obtained for PC exons (e.g., Tetrapod lncRNAs,
d, /d, and Tajima’s D; figure 1). Point estimates of , d, Tajima’sD, and/dfor lncRNA loci of known function show substantial and statistically significant reductions when compared with ARs (table 2andfig. 1). These estimates for
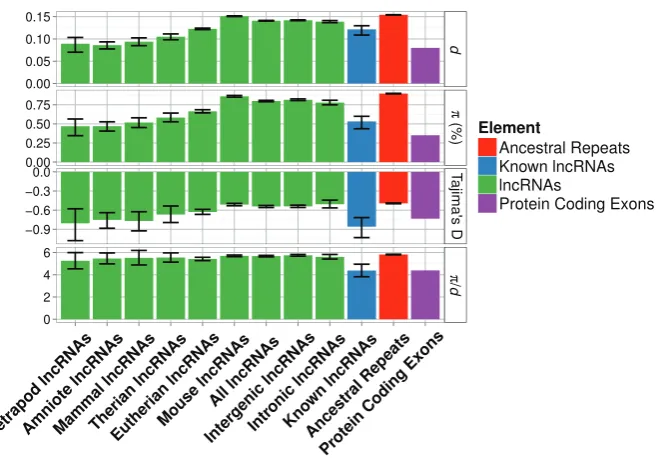
FIG. 2.—Estimates of various diversity estimates for lncRNAs expressed in different tissue types. Error bars are bootstrapped 95% confidence intervals
around point estimates. Estimates for lncRNAs of known function, intronic lncRNAs and intergenic lncRNAs, AR and PC exons are also shown for comparison.
FIG. 1.—Estimates of various diversity measures for each lncRNA age group. Groups are arranged along thexaxis in descending order by evolutionary
age from left to right. Error bars are bootstrapped 95% confidence intervals around point estimates. Estimates for lncRNAs of known function, intronic lncRNAs and intergenic lncRNAs, AR and PC exons are also shown for comparison.
lncRNA Loci in the Mouse Genome
GBE
at St Andrews University Library on September 25, 2015
http://gbe.oxfordjournals.org/
[image:6.595.138.469.82.311.2]known lncRNAs are comparable to very old (~370 Myr) lncRNAs in the larger data set and also comparable to PC exons (table 2,fig. 1).
Across lncRNA loci expressed in different tissues, there are similar levels of variation in locus and exon lengths (supplementary table S4, Supplementary Material online). The number of loci reaching highest expression in each tissue type varies substantially from 234 (placenta) to 6,157 (testes). There is some variation in diversity among lncRNAs expressed in different tissue types but variation in diversity with evolutionary age is greater (tables 2and3,figs. 1and 2). Statistically significant differences for all measures of diversity and divergence are found only for the numerous testis-specific lncRNAs (table 3,fig. 2). The other tissue types show mixed results with some diversity measures showing significant reductions compared with ARs. In particular, lncRNAs expressed in neural tissue show robust and statistically significant reductions in Tajima’s D, and d. However, none shows significant differences in/d(table 3 andfig. 2).
Patterns of Diversity in Regions Flanking Focal Loci
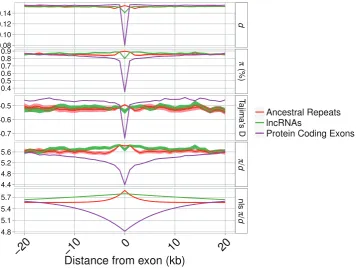
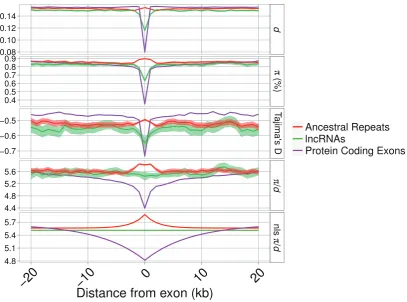
The patterns of diversity and divergence in the regions flanking a locus can reveal the signature of selection by its effect on closely linked neutral sites. In the flanks of focal loci (lncRNA exons, PC exons and UTRs and AR loci), there is an obvious reduction only for PC exons, whereas lncRNAs and ARs show very similar patterns (fig. 3). These results hold when controlling for variation in mutation rate across the genome by normalizing by the between-species divergence (/d;fig. 3). Patterns of diversity in regions flanking the loci are described by nonlinear least squares models. In all cases, the model describing a curve is a better description, explaining
significantly more of the variation in the data, than a model including only ayintercept (i.e., a straight line) (see Materials and Methods; lncRNAs F(98, 199)= 193.16; ARs F(98, 199)= 39.43; PC exons F(98, 199)= 439.93; allP<0.01). The parameter estimates intable 4show that patterns of/
din the regions flanking lncRNAs are both quantitatively and qualitatively more similar to ARs than to PC genes. The termA, measuring the “background” genomic level of /d, is, as expected, comparable across lncRNAs, ARs, and PC exons. The termB, measuring the reduction in/dasxapproaches 0 (i.e., closer to the focal locus), is negative and of similar magnitude in both lncRNAs and ARs, whereas it is positive and greatly reduced in PC exons (fig. 3 and table 4). However, when mouse-specific lncRNAs are removed from the data set, the nonlinear model is no longer the best-fitting model and the best prediction is a straight line with no slope and ayintercept of/dsimilar to the background values of /dfor ARs and PC exons (fig. 4andtable 4). This suggests that mouse-specific lncRNAs drive up the diversity in the over-all set of lncRNAs and older lncRNAs show lower levels of diversity. Additionally Tajima’sDis only markedly reduced at and around PC exons, indicating the presence of an excess of rare variants at these loci. Confidence intervals around estimates of , d, /d, and Tajima’s D in the regions immediately flanking the AR and lncRNA loci mostly overlap, suggesting that there is at most a small difference in the extent of reductions in diversity and divergence at sites linked to lncRNAs and ARs (figs. 3and4) but that these are not significant.
Discussion
[image:7.595.52.545.121.269.2]We find a weak positive relationship between the estimated evolutionary age of lncRNAs and the level of conservation as
Table 2
Point Estimates and Number of Loci (N)for Divergence and Diversity (%) Measures across Groups of lncRNAs of Different Evolutionary Ages and Divergence Ratios (Ratio of Median Divergence across Loci to Median Divergence at ARs)
Genomic Element (NLoci) Tajima’sD d p(%) p/d d/dAR
Tetrapods 0.806 0.0893* 0.469* 5.26 0.598 (62) (1.08,0.579) (0.0703, 0.103) (0.345, 0.564) (4.53, 5.99)
Amniotes 0.752* 0.0860* 0.470* 5.46 0.579 (286) (0.884,0.640) (0.0776, 0.0934) (0.406, 0.527) (4.98, 5.96)
Mammals 0.769* 0.0939* 0.518* 5.52 0.631 (165) (0.924,0.625) (0.0849, 0.102) (0.452, 0.580) (4.88, 6.18)
Therians 0.669 0.105* 0.583* 5.55 0.709 (255) (0.794,0.535) (0.0981, 0.111) (0.644, 0.685) (5.14, 5.97)
Eutherians 0.629* 0.123* 0.665* 5.42* 0.828 (1,582) (0.667,0.588) (0.121, 0.124) (0.644, 0.685) (5.27, 5.57)
Mouse 0.513 0.151* 0.861* 5.70 1.02 (7,306) (0.531,0.494) (0.150, 0.152) (0.851, 0.872) (5.63, 5.77)
NOTE.—Bootstrapped 95% confidence intervals are given in brackets. Age group-specific estimates of diversity measures with significantly different distribution of values, after a Bonferroni correction, when compared with the bootstrap distribution of ARs are denoted with * (actualPvalues reported insupplementary table S5,Supplementary Materialonline).
Wiberg et al.
GBE
at St Andrews University Library on September 25, 2015
http://gbe.oxfordjournals.org/
measured by within-species sequence diversity and between-species divergence (fig. 1 and table 2). These observations suggest that lncRNAs that show homology and evidence of transcription across the greatest number lineages
also show reduced diversity within mice and reduced divergence from rat at the sequence level, indicative of recent selection in mouse populations. These evolutionarily most ancient loci are therefore more likely to be important
[image:8.595.122.480.341.609.2]FIG. 3.—Divergence (d), nucleotide diversity (), divergence-corrected nucleotide diversity (/d), and Tajima’sDaround focal loci for lncRNAs, known lncRNAs, AR and PC exons. Shaded areas indicate bootstrapped 95% confidence intervals. The panel “nls/d” shows fitted values from a nonlinear least squares function applied with the parameters described intable 4. Thexaxis has been limited to 20 kb down and upstream of the focal loci. The number of sites sampled as a function of distance is shown insupplementary figure S5,Supplementary Materialonline.
Table 3
Point Estimates and Number of Loci (N) for Divergence and Diversity Measures and Divergence Ratios (Ratio of Median Divergence across Loci to Median Divergence at ARs) for the lncRNAs Expressed in Different Tissues
Tissue Type (NLoci) Tajima’sD d p p/d d/dAR
Neural tissue 0.595* 0.120* 0.665* 5.55 0.809 (1,345) (0.657,0.537) (0.116, 0.123) (0.632, 0.696) (5.29, 5.80)
Heart 0.626* 0.133* 0.731* 5.51 0.895 (358) (0.700,0.552) (0.129, 0.136) (0.689, 0.776) (5.23, 5.81)
Testes 0.539* 0.146* 0.829* 5.68* 0.985 (6,157) (0.558,0.520) (0.145, 0.147) (0.818, 0.841) (5.61, 5.76)
Ovary 0.503 0.138* 0.800* 5.80 0.930 (479) (0.569,0.431) (0.135, 0.141) (0.761, 0.842) (5.55, 6.09)
Placenta 0.451 0.132* 0.736* 5.57 0.891 (234) (0.564,0.350) (0.127, 0.137) (0.684, 0.784) (5.18, 5.95)
Kidney 0.575 0.135* 0.765* 5.67 0.909 (396) (0.644,0.499) (0.131, 0.138) (0.725, 0.804) (5.40, 5.93)
Liver 0.497 0.143* 0.827 5.76 0.968 (375) (0.574,0.415) (0.140, 0.146) (0.782, 0.872) (5.46, 6.07)
NOTE.—Bootstrapped 95% confidence intervals are given in brackets. Age group-specific estimates of diversity measures with significantly different distribution of values, after a Bonferroni correction, when compared with the bootstrap distribution of ARs are denoted with * (actual Pvalues reported in supplementary table S12, Supplementary Materialonline).
lncRNA Loci in the Mouse Genome
GBE
at St Andrews University Library on September 25, 2015
http://gbe.oxfordjournals.org/
for fitness. Moreover, lncRNAs that have well-characterized functions also tend to be more conserved than lncRNAs in general. This is not completely unexpected, because substantial sequence conservation is often a criterion by which researchers choose targets for further study. However, considering all 10,088 lncRNAs together, there is only limited evidence for constraint at the sequence level. Although nucleotide divergence at lncRNA loci is depressed
[image:9.595.50.287.133.191.2]by approximately 5% compared with AR loci, the patterns of diversity around lncRNA loci seen infigures 3and4do not suggest that strong selection affects variation at linked sites. There is some evidence for variation in the levels of diversity between lncRNAs expressed in different tissue types (fig. 2, table 3). Although lncRNAs specific to some tissue types show significantly lower levels of diversity in comparison to ARs, none shows levels comparable to PC exons or lncRNAs of known function. Interestingly, neural tissue-specific lncRNAs seem to be shorter, on average, than lncRNAs in general. Similar results have been found in mouse embryonic brain
tissue, where lncRNAs are shorter, on average, than known lncRNAs (Lv et al. 2013). However, the shorter sequences among brain tissue lncRNAs are not likely to affect the reliability of our estimates. In general, confidence intervals are narrow indicating that the sample sizes used here are sufficient and that the limit on accuracy and sources of variation are mainly due to differing numbers of lncRNAs across groups in the analyses.
FIG. 4.—Divergence (d), nucleotide diversity (), divergence-corrected nucleotide diversity (/d), and Tajima’sDaround focal loci for lncRNAs, excluding “mouse-specific” lncRNAs, known lncRNAs, AR and PC exons. Shaded areas indicate bootstrapped 95% confidence intervals. The panel “nls/d” shows fitted values from a nonlinear least squares function applied with the parameters described intable 4. Thexaxis has been limited to 20 kb down and upstream of the focal loci.
Table 4
Parameter Estimates for the Best-Fitting Nonlinear Least Squares Model Applied to the Patterns of Diversity in the Flanking Regions of lncRNA, AR, and PC Loci
Genomic Element A B q
All lncRNAs 5.38 0.08 42.22 All lncRNAs (excluding mouse-specific) 5.52 — — ARs 5.56 0.06 2.25 PC exons 5.66 0.15 7.97
NOTE.—The equation applied was:/d&A(1Bexp(abs(x)/q), wherex is the distance from the focal locus (in kb).
Wiberg et al.
GBE
at St Andrews University Library on September 25, 2015
http://gbe.oxfordjournals.org/
[image:9.595.95.503.251.553.2]Similar findings to those detailed above have been reported for lncRNAs across the greater Tetrapod lineage, where conservation was significantly lower for lncRNA loci than random intergenic regions. Derived allele frequencies in a human polymorphism data set are significantly lower in lncRNAs than among random intergenic regions (Necsulea et al. 2014).Kutter et al. (2012) found that depressions in sequence divergence between mouse and rat were higher for lncRNA loci that show evidence of transcription in both species (~18%) than for orthologuos lncRNA loci in general (~10%). Our estimates of depressions in sequence divergence, measured as divergence ratios (dlocus/dAR), for lncRNAs compared with putatively neutrally evolving ARs are lower but comparable to the approximately 10–12% depressions found in other studies (Pang et al. 2006; Marques and Ponting 2009; Guttman et al. 2009; Kutter et al. 2012). The depressions in divergence such as those reported here and elsewhere have previously been taken as evidence of selection and functionality. When considered in combination with the patterns of diversity around the focal loci (figs. 3and4), and the extent of depressions in divergence around known functional lncRNA loci (~20%,table 1), the observed depressions in substitution rates of 5–12% across lncRNA loci in general are modest, suggesting that selection acting on lncRNAs is generally weak. However, some of the loci in the current data set of approximately 10,000 lncRNAs show greater evidence of reduced within-species diversity.
The most striking patterns are seen in lncRNAs that are conserved deep in the Tetrapod lineage (about 0.6% of the total set of lncRNAs). In general, lncRNAs seem to show decreasing levels of within-species sequence diversity conservation with increasing evolutionary age. Thus, our estimates of the recent selective pressures acting on lncRNAs in mouse populations are compatible with their levels of long-term evolutionary conservation. There are several potential causes of this. One explanation is that the set of older lncRNAs contains a higher proportion of functional lncRNAs. Evolutionarily old lncRNAs could be important early in tetrapod development and therefore highly conserved at the sequence level. On the other hand, these ancient loci have to be detectable across more lineages in order to be included in the older groupings and it is possible that these higher levels of conservation are partly due to an overrepresentation in these groups of more conserved sequences that can be robustly aligned across such a wide phylogenetic range. The fact that lncRNAs of known function show levels of sequence conservation comparable to older lncRNAs (e.g., tetrapod lncRNAs) suggests that the oldest groups are good candidates for further work to identify functional lncRNAs. The greater levels of sequence conservation seen at known lncRNA or functionally characterized loci also suggest that data sets of lncRNA loci identified by high-throughput sequencing and automated gene prediction are dominated by “transcriptional noise.”
The above interpretations are subject to caveats. First, previous work has shown that, in humans, lncRNA loci seem to have higher recombination rates than PC genes (Necsulea et al. 2014). If this is also the case in mice, then this could lead to increased diversity, which might degrade the signal of selection at lncRNA loci and potentially explain some of the high levels of diversity seen in this study. Second, ARs may not be evolving perfectly neutrally. If these loci are subject to some selection, then constraint will be underestimated, although the currently available evidence suggests that the neutrality of ARs is generally a reasonable assumption (Lunter et al. 2006). Similarly, constraint will also be underestimated if there is lineage-specific positive selection at a locus. Third, one view holds that a lack of sequence conservation does not necessarily indicate a lack of function (Pang et al. 2006). Empirical examples of this can be found in the experimentally characterized lncRNAsAirandXist. These loci show relatively low levels of conservation, despite having well-established functions. At theXistlocus, significant sequence conservation across voles, mice, and human lineages is only apparent in a few regions of the full sequence of the transcribed locus, whereas most of the locus evolves at a rate similar to that of neutrally evolving loci (Nesterova et al. 2001). Additionally, a survey of conserved regions across five vertebrate genomes (human, mouse, rat, chicken, and the pufferfish) shows that only 42% of sites in a core set of ncRNA loci, some of which are lncRNAs, are part of “highly conserved elements” (Siepel et al. 2005). Controversy over the use of conservation as an indicator of function recently arose when the ENCODE project claimed to have assigned function to approximately 80% of the human genome, despite only approximately 10% being detectably conserved at the sequence level (Doolittle 2012;ENCODE Project Consortium 2012; Stamatoyannopoulos 2012; Graur et al. 2013). The conflict arises because it is unclear how a sequence can be functional in any meaningful way while not being affected by mutation (Doolittle 2012; Graur et al. 2013; Haerty and Ponting 2014). Although it seems meaningless to discuss biological function of genomic elements in the complete absence of conservation at the sequence level (Doolittle 2012;Graur et al. 2013), conservation may not be detectable in averages of diversity and divergence across entire loci. For example, conservation could be apparent only at a few nucle-otides at particular positions along the length of the locus that are important for secondary structure formation, which is the case in some lncRNA loci (Diederichs 2014). lncRNAs have been found to be more folded in secondary structure than predicted by chance, albeit to a lesser extent than mRNAs, suggesting that secondary structure, rather than simple nucleotide sequence, could be under constraint (Yang and Zhang 2015). It is also possible that lncRNA loci are not constrained by nucleotide sequence directly but for sequence length or continued transcription. One interesting proposition is that simply the continued transcription of lncRNA loci is
lncRNA Loci in the Mouse Genome
GBE
at St Andrews University Library on September 25, 2015
http://gbe.oxfordjournals.org/
required in order to keep chromatin open and thus facilitate the transcription of other nearby genes (Gribnau et al. 2000; Schmitt and Paro 2004;Ponjavic et al. 2007). For example, the
Airn-mediated silencing ofIgfr2in embryonic stem cells seems to depend only on overlap of theAirnlocus with theIgfr2
locus and not the transcribed product ofAirn (Latos et al. 2012). Furthermore, evidence suggests that nucleotide composition within lncRNAs mirrors that of PC loci and is under selection, over very short distances, for efficient transcription and splicing (Haerty and Ponting 2015). If high primary sequence constraint is not a requirement of function then selection for maintained function might not result in detectable signals of reduced diversity and divergence at and around functional lncRNA loci. Nevertheless, the observation reported here that lncRNAs of known function do show these signals of selection (reduced diversity and divergence) that are comparable to PC loci suggests that these signals are indeed good indicators of functionality for at least some proportion of noncoding loci.
Another caveat is that there is a potential problem of alignment reliability especially for noncoding regions. Orthologous sequences are often inferred across organisms by alignment of two or more sequences and the nucleotide sequence similarity between them. However, a high sequence similarity between the identified best matches does not necessarily imply that these regions correspond to actively transcribed sequences across the organisms being compared (Ulitsky and Bartel 2013). Previous results suggest caution in this regard. For example, of approximately 3,000 mouse and approximately 2,600 human lncRNAs only 9% and 16.1%, respectively, aligned to any zebrafish sequence and only seven and nine loci, respectively, mapped to known zebrafish lncRNAs. Meanwhile, of those loci that mapped to any zebrafish sequence, 100 mouse and 286 human lncRNAs mapped to zebrafish coding regions (Ulitsky et al. 2011). The lncRNA locusHOTAIRcan be aligned between human and mouse, but sequence conservation varies across the locus and is as low as 75% in certain regions (He et al. 2011;Schorderet and Duboule 2011). Moreover, the mouse homolog ofHOTAIRis shorter with only two exons, whereas the human locus has six exons and deletion of the locus in mice does not show the expected effect on predicted regulatory targets (Schorderet and Duboule 2011). Most of theHOTAIRlocus may not be subject to selective constraint. Finally, of 160 lncRNA orthologs across rodents (M. m. musculus, M. m. castaneus,andR. norvegicus) only 59.7% were found to be transcriptionally conserved, dropping to 28% if the data were adjusted to account for annotation biases (Kutter et al. 2012).
Conclusions
This study focuses on a recently published, large data set of approximately 10,000 lncRNAs in the mouse genome. We
assessed the levels of within-species sequence diversity at these loci, in order to evaluate the recent selective pressures acting on lncRNAs and to compare them with estimates of long-term evolutionary conservation. We compared measures of sequence diversity within mouse populations and divergence from the rat at these loci and in regions flanking them to the patterns around ARs and PC exons. It was possible to group lncRNA loci by their estimated evolutionary age (as inferred by evidence of homologous sequences and transcription across different evolutionary lineages) to determine the relationship between conservation and age. In addition, a set of 74 lncRNA loci of known and characterized function in the mouse were investigated for comparison. The results suggest only modest conservation at the loci in the larger data set when compared with PC exons. There is a trend of increasing conservation with increasing age of a locus, but this trend was not strong and was not consistent across all measures of diversity. Finally, lncRNAs of known function show substantially and significantly reduced diversity and divergence when compared with neutrally evolving ARs that are comparable to PC exons. In summary, the data suggest that the majority of the lncRNAs in our data set is evolving at rates comparable to ARs at the sequence level, but that a subset show signals of selection similar to PC genes.
Supplementary Material
Supplementary figures S1–S5 and tables S1–S12 are available at Genome Biology and Evolution online (http:// www.gbe.oxfordjournals.org/).
Acknowledgments
This work was supported by the Biotechnology and Biological Sciences Research Council and The Wellcome Trust. A.N. was supported by the Swiss National Science Foundation (Grant: PZ00P3_142636). H.K. was supported by the European Research Council Starting (Grant: 242597, SexGenTransEvolution) and the Swiss National Science Foundation (Grants: 130287 and 146474). They are grateful for the comments of four anonymous reviewers which have greatly improved this manuscript.
Literature Cited
Adkins R, Gelke D, Rowe D, Honeycutt RL. 2001. Molecular phylogeny and divergence time estimates for major rodent groups: evidence from multiple genes. Mol Biol Evol. 18:777–791.
Amaral PP, Clark MB, Gascoigne DK, Dinger ME, Mattick JS. 2011. lncRNAdb: a reference database for long noncoding RNAs. Nucleic Acids Res. 39:D146–D151.
Baines JF, Harr B. 2007. Reduced X-linked diversity in derived populations of house mice. Genetics 175:1911–1921.
Brown JD, Mitchell SE, O’Neill RJ. 2012. Making a long story short: noncoding RNAs and chromosome change. Heredity 108:42–49.
Wiberg et al.
GBE
at St Andrews University Library on September 25, 2015
http://gbe.oxfordjournals.org/
Carninci P, et al. 2005. Transcriptional landscape of the mammalian genome. Science 309:1559–1563.
Charlesworth B. 2009. Effective population size and patterns of molecular evolution and variation. Nat Rev Genet. 10:195–205.
Charlesworth B, Coyne JA, Barton NH. 1987. The relative rates of evolution of sex chromosomes and autosomes. Am Nat. 130:113–146.
Charlesworth B, Morgan MT, Charlesworth D. 1993. The effect of dele-terious mutations on neutral molecular variation. Genetics 134:1289–1303.
Chiaromonte F, et al. 2003. The share of human genomic DNA under selection estimated from human-mouse genomic alignments. Cold Spring Harb Symp Quant Biol. 68:245–254.
Derrien T, et al. 2012. The GENCODE v7 catalog of human long noncoding RNAs: analysis of their gene structure, evolution, and expression. Genome Res. 22:1775–1789.
Diederichs S. 2014 The four dimensions of noncoding RNA conservation. Trends Genet. 30:121–123.
Doolittle FW. 2012 Is junk DNA bunk? A critique of ENCODE. Proc Natl Acad Sci U S A. 110:5294–5300.
ENCODE Project Consortium. 2012. An integrated encyclopedia of DNA elements in the human genome. Nature 489:57–74.
Engreitz JM, et al. 2013. TheXist lncRNA exploits three-dimensional genome architecture to spread across the X chromosome. Science 341:1–9.
Eo¨ry L, Halligan DL, Keightley PD. 2010. Distributions of selectively constrained sites and deleterious mutation rates in the hominid and murid genomes. Mol Biol Evol. 27:177–192.
Espinoza CA, Allen TA, Hieb AR, Kugel JF, Goodrich JA. 2004. B2 RNA binds directly to RNA polymerase II to repress transcript synthesis. Nat Struct Mol Biol. 11:822–829.
Espinoza CA, Goodrich JA, Kugel JF. 2007. Characterization of the structure, function, and mechanism of B2 RNA, an ncRNA repressor of RNA polymerase II transcription. RNA 13:583–596.
Graur D, et al. 2013. On the immortality of television sets: “function” in the human genome according to the evolution-free gospel of ENCODE. Genome Biol Evol. 5:578–590.
Gribnau J, Diderich K, Pruzina S, Calzolari R, Fraser P. 2000. Intergenic transcription and developmental remodeling of chromatin subdomains in the human beta-globin locus. Mol Cell. 5:377–386. Guttman M, et al. 2009. Chromatin signature reveals over a thousand
highly conserved large non-coding RNAs in mammals. Nature 458:223–237.
Haerty W, Ponting CP. 2013. Mutations within lncRNAs are effectively selected against in fruitfly but not in human. Genome Biol. 14:R49. Haerty W, Ponting CP. 2014. No gene in the genome makes sense except
in the light of evolution. Annu Rev Genomics Hum Genet. 15:71–92. Haerty W, Ponting CP. 2015 Unexpected selection to retain high GC content and splicing enhancers within exons of multiexonic lncRNA loci. RNA 21:1–13.
Halligan DL, et al. 2013. Contributions of protein-coding and regulatory change to adaptive molecular evolution in murid rodents. PLoS Genet. 9:e1003995.
He S, Liu S, Zhu H. 2011. The sequence, structure and evolutionary features of HOTAIR in mammals. BMC Evol Biol. 11:102.
Hernandez RD, et al. 2011. Classic selective sweeps were rare in recent human evolution. Science 331:920–924.
Ilik I, Akhtar A. 2009. roX RNAs: non-coding regulators of the male X chromosome in flies. RNA Biol. 6:113–121.
Iyer MK, et al. 2015. The landscape of long noncoding RNAs in the human transcriptome. Nat Genet. 47:199–208.
Kapranov P, et al. 2007. RNA maps reveal new RNA classes and a possible function for pervasive transcription. Science 316:1484–1488.
Kapusta A, et al. 2013. Transposable elements are major contributors to the origin, diversification, and regulation of vertebrate long noncoding RNAs. PLoS Genet. 9:e1003470.
Kent WJ. 2002. BLAT—the BLAST-like alignment tool. Genome Res. 12:656–664.
Kent WJ, et al. 2002. The human genome browser at UCSC. Genome Res. 12:996–1006.
Kousathanas A, Halligan DL, Keightley PD. 2014. Faster-X adaptive protein evolution in house mice. Genetics 196:1131–1143.
Kutter C, et al. 2012. Rapid turnover of long noncoding RNAs and the evolution of gene expression. PLoS Genet. 8:e1002841.
Latos PA, et al. 2012. Airn transcriptional overlap, but not its lncRNA products, induces imprinted Igf2r silencing. Science 338:1469– 1472.
Lin MF, Deoras AN, Rasmussen MD, Kellis M. 2008. Performance and scalability of discriminative metrics for comparative gene identification in 12Drosophilagenomes. PLoS Comput Biol. 4:e1000067. Lin MF, et al. 2007. Revisiting the protein-coding gene catalog of
Drosophila melanogaster using 12 fly genomes. Genome Res. 17:1823–1836.
Lunter G, Ponting CP, Hein J. 2006. Genome-wide identification of human functional DNA using a neutral indel model. PLoS Comput Biol. 2:e5. Lv J, et al. 2013. Identification and characterization of long non-coding RNAs related to mouse embryonic brain development from available transcriptomic data. PLoS One 8:e71152.
Maeda N, et al. 2006. Transcript annotation in FANTOM3: mouse gene catalog based on physical cDNAs. PLoS Genet. 2:e62.
Marques AC, Ponting CP. 2009. Catalogues of mammalian long noncoding RNAs: modest conservation and incompleteness. Genome Biol. 10:R124.
Mattick JS, Makunin IV. 2006. Non-coding RNA. Hum Mol Genet. 15 Spec No 1:R17–R29.
Maynard-Smith J, Haigh J. 1974. The hitch-hiking effect of a favourable gene. Genet Res. 23:23–35.
Mercer TR, Dinger ME, Mattick JS. 2009. Long non-coding RNAs: insights into functions. Nat Rev Genet. 10:155–159.
Mouse Genome Sequencing Consortium. 2002. Initial sequencing and comparative analysis of the mouse genome. Nature 420:520–562. Nagano T, et al. 2008. TheAirnoncoding RNA epigenetically silences
transcription by targeting G9a to chromatin. Science 322:1717–1720. Necsulea A, et al. 2014. The evolution of lncRNA repertoires and
expression patterns in tetrapods. Nature 505:635–640.
Nesterova TB, et al. 2001. Characterization of the genomicXistlocus in rodents reveals conservation of overall gene structure and tandem repeats but rapid evolution of unique sequence. Genome Res. 11:833–849.
Okazaki Y, et al. 2002. Analysis of the mouse transcriptome based on functional annotation of 60,770 full-length cDNAs. Nature 420:563–573.
Pang KC, Frith MC, Mattick JS. 2006. Rapid evolution of noncoding RNAs: lack of conservation does not mean lack of function. Trends Genet. 22:1–5.
Phifer-Rixey M, et al. 2012. Adaptive evolution and effective population size in wild house mice. Mol Biol Evol. 29:2949–2955.
Ponjavic J, Ponting CP. 2007. The long and the short of RNA maps. BioEssays 29:1077–1080.
Ponjavic J, Ponting CP, Lunter G. 2007. Functionality or transcriptional noise? Evidence for selection within long noncoding RNAs. Genome Res. 17:556–565.
Ponting CP, Oliver PL, Reik W. 2009. Evolution and functions of long noncoding RNAs. Cell 136:629–641.
Quek XC, et al. 2014. lncRNAdb v2.0: expanding the reference database for functional long noncoding RNAs. Nucleic Acids Res. 43:1–6.
lncRNA Loci in the Mouse Genome
GBE
at St Andrews University Library on September 25, 2015
http://gbe.oxfordjournals.org/
R Development Core Team. 2008. R: a language and environment for statistical computing. Vienna (Austria): R Foundation for Statistical Computing.
Rinn JL, Chang HY. 2012. Genome regulation by long noncoding RNAs. Annu Rev Biochem. 81:145–166.
Sattath S, Elyashiv E, Kolodny O, Rinott Y, Sella G. 2011. Pervasive adaptive protein evolution apparent in diversity patterns around amino acid substitutions inDrosophila simulans. PLoS Genet. 7:e1001302. Schmitt S, Paro R. 2004. A reason for reading nonsense. Nature
429:510–511.
Schorderet P, Duboule D. 2011. Structural and functional differences in the long non-coding RNAHotairin mouse and human. PLoS Genet. 7:e1002071.
Siepel A, et al. 2005. Evolutionarily conserved elements in vertebrate, insect, worm, and yeast genomes. Genome Res. 15:1034–1050. Sleutels F, Zwart R, Barlow DP. 2002. The non-codingAirRNA is required
for silencing autosomal imprinted genes. Nature 415:810–813.
Springer MS, Murphy WJ, Eizirik E, Brien SJO. 2004. Placental mammal diversification and the Cretaceous–Tertiary boundary. Proc Natl Acad Sci U S A. 100:1056-1061.
Stamatoyannopoulos JA. 2012. What does our genome encode? Genome Res. 22:1602–1611.
Ulitsky I, Bartel DP. 2013. lincRNAs: genomics, evolution, and mechanisms. Cell 154:26–46.
Ulitsky I, Shkumatava A, Jan CHHH, Sive H, Bartel DPPP. 2011. Conserved function of lincRNAs in vertebrate embryonic development despite rapid sequence evolution. Cell 151:684–686.
Wang J, et al. 2004. Mouse transcriptome: neutral evolution of “non-coding” complementary DNAs. Nature 431:14–15.
Yang J-R, Zhang J. 2015. Human long noncoding RNAs are substantially less folded than messenger RNAs. Mol Biol Evol 32:970–977.
Yotova IY, et al. 2008. Identification of the human homolog of the imprinted mouse Air non-coding RNA. Genomics 92:464–473.
Wiberg et al.
GBE
at St Andrews University Library on September 25, 2015
http://gbe.oxfordjournals.org/