A Complex Solar Coronal Jet with Two Phases
Jie Chen1,2, Jiangtao Su1,3, Yuanyong Deng1, and E. R. Priest4 1
Key Laboratory of Solar Activity, National Astronomical Observatories, Chinese Academy of Sciences, Beijing 100012, China;[email protected]
2
State Key Laboratory for Space Weather, Center for Space Science and Applied Research, Chinese Academy of Sciences, Beijing 100190, China
3
School of Astronomy and Space Sciences, University of Chinese Academy of Sciences, 19A Yuquan Road, Beijing 100049, China
4
Mathematical Institute, University of St Andrews, North Haugh, St Andrews, KY16 9SS, UK
Received 2016 November 5; revised 2017 April 4; accepted 2017 April 6; published 2017 May 4
Abstract
Jets often occur repeatedly from almost the same location. In this paper, a complex solar jet was observed with two phases to the west of NOAA AR 11513 on 2012 July 2. If it had been observed at only moderate resolution, the two phases and their points of origin would have been regarded as identical. However, at high resolution wefind that the two phases merge into one another and the accompanying footpoint brightenings occur at different locations. The phases originate from different magnetic patches rather than being one phase originating from the same patch. Photospheric line of sight (LOS) magnetograms show that the bases of the two phases lie in two different patches of magnetic flux that decrease in size during the occurrence of the two phases. Based on these observations, we suggest that the driving mechanism of the two successive phases is magnetic cancellation of two separate magnetic fragments with an opposite-polarity fragment between them.
Key words:magnetic reconnection– magnetohydrodynamics(MHD)– Sun: activity– Sun: corona–
Sun: magnetic fields
Supporting material:animations
1. Introduction
Jets are transient impulsive phenomena with plasma motions along particular directions (Shibata et al.1992,1994; Canfield et al. 1996; Moore et al. 2010; Sterling et al.2015). They are ubiquitous in the solar atmosphere and occur in active regions, the quiet Sun, and polar regions (Cirtain et al. 2007; Shen et al.2012; Liu et al.2014; Zhang & Ji2014; Hong et al.2016; Raouafiet al.2016; Zhang et al.2016). The typical length of jets is 10–400 Mm, the width is 5–100 Mm, and the apparent velocity is 10–1000 km s−1with an average value of 200 km s−1 (Shimojo et al.1996,1998).
It is generally believed that solar jets are caused by magnetic reconnection. However, the jet characteristics largely depend on the magnetic environment at the jet source. Heyvaerts et al. (1977), Forbes & Priest (1984), Shibata et al. (1992), and Moore et al. (2013) presented a standard model for the formation of a jet. The essential idea of this model is that at the base of a jet during the emergence of a magnetic arch into an ambient unipolar field, a current sheet forms between the ambient field and one leg of the arch with opposite polarity. During the emergence, the current sheet becomes larger and thinner, until magnetic reconnection is initiated. Interchange reconnection between closedfield and openfield occurs at the current sheet. The hot plasma on the open field lines escapes out to become the spire of the jet, and the hot plasma on the closedfield lines is seen as a bright point at the jet base. This model has been developed further using 2D numerical experiments by Yokoyama & Shibata(1995,1996), Nishizuka et al. (2008), and Jiang et al. (2012) and, more recently, 3D experiments by Moreno-Insertis & Galsgaard(2013), Nóbrega-Siverio et al.(2016), Archontis & Hood(2013), Syntelis et al. (2015), and Raouafiet al.(2016).
Jets are associated with bothflux emergence and cancellation (Chae et al. 1999; Brooks et al. 2007). After new flux has emerged, one or another flux element often cancels with a
nearby one of opposite polarity. Most of them occur in mixed polarity regions (Shimojo et al. 1996). Jets are commonly associated with magnetic cancellation (Muglach 2008; Liu et al. 2011; Young & Muglach 2014a, 2014b). Jets tend to occur repeatedly (Chifor et al. 2008; Chen et al. 2015; Liu et al. 2016), with a period ranging from tens of minutes to hours. It is normally thought that repeated jets occur at the same location with almost the same configuration (Guo et al.2013; Schmieder et al.2013).
In this paper, for the first time, we show that at high resolution a jet can have two different phases involving reconnection of different magnetic regions, and we propose a model for such a jet.
2. Instruments
The observations used in this paper are taken by the Atmospheric Imaging Assembly(AIA; Lemen et al.2012)and Helioseismic and Magnetic Imager(HMI; Scherrer et al.2012)
on board theSDOsatellite. Full-disk EUV images supplied by the AIA instrument have a cadence of 12 s and a spatial resolution of 0 6. Full solar disk line-of-sight(LOS) magneto-grams in the photosphere obtained by HMI have a cadence of 45 s and a spatial resolution of 0 5. The aia_prep.pro is used to process AIA level 1.5 data and HMI LOS data. After the reduction of this routine, the data of AIA and HMI will have the same spatial resolution and the full-disk images will be co-aligned. It is not safe to reach conclusions about alignment to within 1″–2″ purely from the default SSW software alone because of thermal effects that can cause changes in alignment between two different telescopes(Orange et al.2014). However, in the present study we align HMI and AIA 1600 images over a broaderfield of view(about 100″×100″), in order to include the region around the sunspot. This plage does indeed align well with the default SSW alignment, and so we are confident about our AIA 171 alignment.
The Astrophysical Journal,840:54(8pp), 2017 May 1 https://doi.org/10.3847/1538-4357/aa6c59
3. Observations and Results
A series of jets were observed on the west edge of AR 11513 on 2012 July 2 (Chen et al. 2015). A jet with two phases occurring around 22:30 UT is studied. The peak of Phase 1 was around 22:28 UT. Phase 2 followed Phase 1 quickly, and the peak was around 22:32 UT. The configurations of Phase 1 and Phase 2 are shown in Figures 1(a) and (d), with the Phase 2 spire being almost parallel to the Phase 1 spire. However, the images demonstrate clearly that the roots of Phase 1 and Phase 2 are located in different places. The root of the Phase 1 spire originates from the southwest of the jet base, which is marked by R1, while the root of the Phase 2 spire originates from the northeast of the jet base, which is marked by R2. The distance between R1 and R2 is around 2.8 Mm. The two spires also
appear in different locations: the spire of Phase 2 is to the northeast of the Phase 1 spire by about 2.8 Mm.
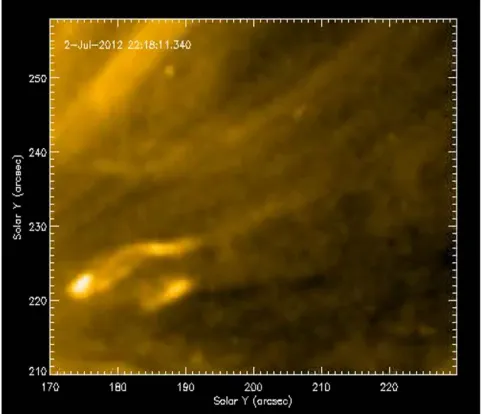
[image:2.612.51.560.51.479.2]The evolution process from Phase 1 to Phase 2 is shown in the online animated Figure2. Originally, there is a bright patch at the jet base that is located between the negative magnetic fragment“n0”and the positive fragment“p1”(Figures1(b)and (g)). Then the spire of Phase 1 becomes longer and longer and also has a lateral motion to the northeast. Around 22:28:11 UT, we can see clearly the jet spire (Figure 1(c)), and the bright patch becomes smaller and weaker. Around 22:29:23 UT, the root of the jet varies from southwest to northeast. From this time, Phase 1 changes to Phase 2, and during Phase 2, the jet continually moves to the northeast laterally. At 22:31:23 UT, there is a bright patch between“n0”and“p2”to the northeast of the jet base (Figures 1(e) and (g)). At 22:32:11 UT, the
Figure 1.(a)Image of Phase 1 of the jet obtained fromSDO/AIA 171Åat 22:28:11 UT on 2012 July 2. The red box is thefield of view(FOV)for panels(b)and(c).
(b)–(c)Close-upSDO/AIA 171Åimages near the base of Phase 1 at 22:26:12 UT and 22:28:11 UT overlaid with simultaneous LOS magneticfield. Blue/green lines mark contour levels for the positive/negative polarities.(d)Image of Phase 2 obtained fromSDO/AIA 171Åat 22:32:11 UT. The red box marks the FOV of panels
(e)and(f).(e)–(f)Close-up images near the base of the jet in Phase 2 at 22:31:23 UT and 22:32:11 UT overlaid with simultaneous LOS magneticfield.(g)–(i)SDO/
HMI LOS magnetograms at 22:15 UT, 22:30 UT, and 22:45 UT, separately. The dynamic range for the magneticfield strength is 30 G. The white/black color represents positive/negative polarity. The FOV is the same as the FOV in panels(b),(c),(e), and(f). The negative-polarity region in the middle of the FOV is marked by n0, and positive-polarity regions to both sides of n0 are marked by p1 and p2, separately. n1 and n2 are also marked in panel(g).
whole spire of Phase 2 can be seen with its root located in the northeast (Figures 1(d)and (f)).
At the jet base, there are mixed magnetic polarity regions. In the middle, there is a negative magnetic polarity region that is marked by“n0”in Figure1(g). To the right of“n0,”there is a positive magnetic polarity region marked by“p1”; to the left of “n0,”there is another positive magnetic polarity region marked by“p2.”n0 and p1 had existed for a long time, but during the occurrence of the jet p1 and n1 decreased, while p2 and n2 flowed out from the penumbra and then moved toward n0. The evolution of the LOS magnetograms is shown in the online animated Figure3. The magnetic fragments n0, p1, and p2 are moving magnetic features. Below the jet the magnetic field is continually changing. From HMI LOS magnetograms in Figures 1(g)–(i), we can see the way the regions n0, p1, and p2 are reducing. Combining images from AIA and HMI, we find that Phase 1 originates from a region between the negative-polarity region n0 and the positive-negative-polarity region p1, while Phase 2 originates from the region between n0 and p2.
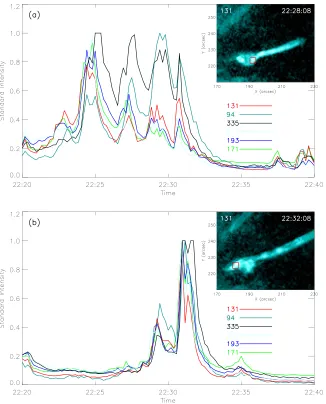
In Figure1, the jet and the bright patches of the footpoints of the two phases appear in AIA 171Å. Actually, the jet and the bright patches are seen in six wavelengths: 171Å, 193Å, 211Å, 335Å, 94Å, and 131Å. The configurations of the two phases in AIA 131Å are shown in Figure4; their confi gura-tions are similar to that in 171Å. The normalized intensity variations of the bright patch (red box in the image 131Å; Figure 4(a)) in Phase 1 in six wavelengths are shown in Figure 4(a). From 22:24 UT to 22:30 UT, there are three obvious peaks in the six wavelengths. This implies that the bright patch becomes brighter three times during the growth of Phase 1, and the bright patch has a wide temperature range, as shown in the six wavelengths of AIA. The normalized intensity variation of the Phase 2 bright patch (red box in the image 131Å; Figure4(b))in six wavelengths is shown in Figure4(b). From 22:30 UT to 22:34 UT, the trends of intensity variation are the same, and there is an obvious peak in the different
wavelengths. The peak time of this bright patch is the same as Phase 2 of the jet.
In order to know whether there is magnetic cancellation or not, the variation of magneticflux is calculated. Figure5shows the variation of the magnetic flux in the rectangular regions including p1 and p2. From Figure 5(a), we can see that the magneticflux of p1 decreases from 22:15 UT to 22:24 UT. At 22:26 UT, there is an obvious brightening at the base of Jet 1. Magnetic cancellation between regions n0 and p1 appears to drive Phase 1. The net increase of magnetic flux of p1 from 22:24 UT to 22:45 UT, despite the continued cancellation, is due to two small positive-polarity patches (highlighted with two green circles in Figure 5(b))moving into the p1 region. The variation of magnetic flux in region p2 is shown in Figure4(b): it decreases from 22:15 to 22:30 UT. At 22:31 UT, there is a brightening at the base of the jet, suggesting thatflux cancellation between regions n0 and p2 drives Phase 2.
The motions and magnetic evolution of p1 and p2 are shown in Figure6. We take a slit between n0 and p1(Figure6(a))and plot a time–distance image (Figure 6(c)). Figure 6(c) shows that there is magnetic cancellation between p1 and n0. The magnetic flux of p1 decreases from 22:00 UT to 23:00 UT. Another slit between p2 and n0 is also taken, which is marked by a green line in Figure 6(b). The time–distance image is given in Figure6(d)and shows that p2 moves toward n0 from 22:00 UT to 22:30 UT.
4. Interpretation and Discussion
[image:3.612.48.290.54.261.2]The formation and evolution of two successive phases of a jet have been observed here at high spatial resolution. The two phases overlap in time, with a time between their peaks of only 4 minutes. The distance between the peaks of Phase 1 and Phase 2 is only 2.8 Mm. The two patches p1 and p2 are very close; if the spatial resolution were low, they would not easily be separated from each other. At high resolution we find that Phases 1 and 2 have different configurations: the root of Phase 1 is in the southwest, whereas the root of Phase 2 is in the
Figure 2.Animation of theSDO/AIA 171Ådata from 22:18:11 to 22:38:11 UT on 2012 July 2. The animation is 3.4 s in duration.
[image:3.612.324.563.54.261.2](An animation of thisfigure is available.)
Figure 3.Animation of theSDO/HMI LOS magnetograms from 22:16:25 to 22:45:40 UT on 2012 July 2. The animation is 1.4 s in duration.
(An animation of thisfigure is available.)
northeast. The locations of brightening of the feet of the two phases are different: the location of the brightening of the footpoint of Phase 1 is between p1 and n0, whereas the location of brightening of the footpoint of Phase 2 is between p2 and n0. The two phases and the brightening of their footpoints appear over a wide temperature range. We suggest that the two phases are driven by magnetic flux cancellation but originate from different nearby locations, rather than originating from the same place.
The jets occurred to the west of NOAA AR 11513 in a moat region surrounding a sunspot of negative polarity and contain-ing mixed polarity movcontain-ing magnetic features. Thus, the ambient magnetic field is predominantly open and directed away from the sunspot. Within this field, small positive magnetic fragments such as p1 and p2 tend to form closedflux that is connected to nearby negative fragments. As they move around and come closer to other negative fragments, cancella-tion and reconneccancella-tion naturally occur to form new conneccancella-tions, jets and heating. Thus, when different positive fragments cancel with the same negative flux, they tend to produce jets with successive phases that have similar paths due to the nature
of the ambientfield. There is also a big coronal hole to the west edge of NOAA AR 11513 with open negative magneticfield (Figure 1 of Chen et al.2015).
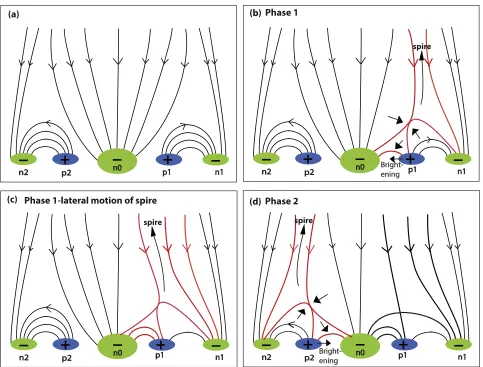
Based on our observation and analysis, we interpret the physical mechanism for the two successive phases with a two-dimensional sketch(Figure7). Figure7(a)depicts the magnetic configuration before the jet. It is dominated by an open magneticfield with negative polarity, which is rooted partly in region n0 in our observation and partly in n1 and n2. To the right of n0, there is a closed magneticfield, with its positive footpoint p1 linked to part of another nearby negative fragment. On the left side, there is another closed magnetic structure symmetrically placed with its positive footpoint p2 linking to part of another nearby negative fragment. During the first process of magnetic cancellation (Figures 7(b) and (c)), the footpoint motion of p1 and n0 drives magnetic reconnection. Such magnetic reconnection between open and closed magnetic field is called interchange magnetic reconnection(Moore et al.
[image:4.612.145.471.49.453.2]2013). The result of the reconnection is to create new closed magneticflux between n0 and p1 and new open magneticflux in the faraway negative-polarity region n1. The hot plasma
Figure 4.(a)Intensity variation of the jet footpoint of Phase 1 in six different wavelengths. Top right: image of Phase 1 of the jet obtained fromSDO/AIA 131Åat 22:28:08 UT; the red box marks the region of the footpoint in Phase 1.(b)Intensity variation of the jet footpoint of Phase 2 in six different wavelengths. Top right: image of Phase 2 of the jet obtained fromSDO/AIA 131Åat 22:32:08 UT; the red box marks the region of the footpoint in Phase 2.
trapped in the new closed-field region creates a bright patch between n0 and p1, and hot plasma escapes out along the new open field to become the spire of Phase 1. The spire is collimated by the dominant strong open magnetic flux. Heat from the reconnection is magnetically confined to a small volume in the closedfield below the reconnection location and so shows up as a brightening, but in the open field above the reconnection site it is spread over a much larger volume and so does not lead to a brightening in region n1. The continuous magnetic cancellation makes the jet move sideways. It can be seen, by comparing Figures7(b)and(c), that the location of the open field line that has just reconnected (and therefore the spire) moves to the left as reconnection proceeds. This transverse motion can be faster than the photospheric cancellation speed, since the transverse motion of photospheric sources can lead to a buildup of a current sheet that subsequently reconnects. Phase 2 is driven by the subsequent cancellation between n0 and p2 (Figure7(d))and produces a spire and a brightening in the same manner as in Phase 1. It is possible that the two phases are independent of one another, but this is unlikely since they occur so close in time and space and the spire has a more or less smooth motion, which suggests that the first phase helped trigger the second phase or that the fragments p1 and p2 are not independent but are linked somehow by a common convection pattern in the moat below the photosphere.
The formation and evolution process of the jet is a process in which magnetic energy is converted to kinetic energy and thermal energy via magnetic reconnection. From our observa-tions, we estimate the magnetic energy, kinetic energy, and thermal energy. For Phase 1 during magnetic cancellation from 22:15 UT to 22:24 UT, the magnetic flux decreases by
´
( )
1.5 0.2 1018Mx in about 9 minutes(Figure5(a)), resulting
in a mean magnetic cancellation rate of(2.80.3)´1015Mx
s−1. The length of region p1 is around 6.0´10 cm8 . We
calculate the mean magnetic energy release rate during the time of magnetic cancellation to be (2.80.1)´1027 erg s−1, which is similar to the change of magnetic energy in a reconnection event described by Li et al. (2016). Following the calculation of the plasma density and temperature by Liu et al. (2016), the average electron number density is about 109cm−3, and the mean temperature is 1.5 MK for the jet. For the bright patch at the footpoint of the jet, the density is about
´
2.5 109 cm−3and the temperature is 4 MK. For the jet, the velocity is about 200 km s−1, the width is about 4 Mm, the length is about 30 Mm, and we estimate the mass of the jet to be
´
3.7 1011g. The change of kinetic energy is7.5´1025ergs-1.
Likewise, we estimate the change of thermal energy of the jet spire to be 7.8´1025 erg s-1. For the bright patch at the
footpoint of the jet, the length is about 8×108 cm and the thermal energy is 7.1´1026 erg s-1. About 30% of the
[image:5.612.146.470.47.401.2]magnetic energy is converted to kinetic and thermal energy, so the
Figure 5.Variation of magneticflux in regions(a)p1 and(b)p2 from 22:15 UT to 22:45 UT on 2012 July 2. Top right: HMI LOS magnetogram at 22:31 UT; FOV: 36″×28 8.
magnetic energy is sufficient to provide the thermal energy and kinetic energy of the jet (more details of the calculation can be found in theAppendix).
We are thankful for discussion with Dr. Qingmin Zhang.
SDO is a mission for NASA’s Living With a Star program. This work was partly supported by National Natural Science Foundation of China (grant Nos. 11303048, 11673033, 11373040, 11427901). This work was also partly supported by an International Exchanges cost share award with NSFC for overseas travel between collaborators in the UK and China, and State Key Laboratory for Space Weather, Center for Space Science and Applied Research, Chinese Academy of Sciences.
Appendix Energy Estimation
Here we describe the estimates of magnetic energy, kinetic energy, and thermal energy for Phase 1 of the jet.
The magneticfluxΦdecreases by1.5(0.2)´1018 Mx in
about 9 minutes from 22:15 UT to 22:24 UT(Figure5(a)). The magneticflux density B can be expressed as
= F ( )
B
S, 1
[image:6.612.55.559.51.535.2]whereΦ is the variation of magneticflux andSis the area of magnetic cancellation. The length of the region p1(L)is around
Figure 6.Time slice images of regions p1 and p2 from 22:00 UT to 23:00 UT.(a, b)HMI LOS magnetograms at 22:08 UT and 22:31 UT, respectively. The dynamic range for the magneticfield strength is 200 G.(c)Time–distance image for the red slit. The red dashed line shows the variation of magneticfield of p1.(d)Time– distance image for the green slit. The green dashed line shows the variation of magneticfield of p2.
´
6.0 10 cm8 , and we assume that the width is 1% of the
length(namely,6.0´106cm). The variation of magneticflux
density B is around 420 G during the period of magnetic cancellation.
The mean magnetic energy release rateEmduring the time of magnetic cancellation (t)can be written as
p
=
´ ( )
E B
tV
8 . 2
m
2
The length of the region p1 is around6.0´10 cm8 (L), so the
volume VisL3andEmis(2.80.1)´1027 erg s−1. The change of kinetic energy is
= ( )
E 1mv
2 , 3
k 2
wheremis the mass of the accelerated plasma in Phase 1. Here
mis set to bemm n0 epL d( 2)2, whereμis the mean molecular weight 0.58 for fully ionized coronal plasma,m0is the mass of
protons, the widthdis about4 ´10 cm8 , the lengthLis about
´
3 10 cm9 , and n
e is the estimated average electron number density of Phase 1. The plasma densitynefor Phase 1 is about 109cm−3, and the velocityvis about 200 kms-1. Using these
parameters, we obtain the mass of accelerated plasma in Phase 1 as 3.7´1011 g and the change of kinetic energy as
´
7.5 1025 ergs-1.
The thermal energy of the jet is
k
= ( )
Eth N pT, 4
wherekp is the Boltzmann constant,N=neVis the number of electrons involved in Phase 1, and V is the volume. T is the average temperature, which we take to be 1.5 Mk. The thermal energy of the jet spire is7.8´1025ergs-1. For the bright patch
[image:7.612.66.549.48.415.2]at the footpoint of the jet, the density is about2.5´109cm−3, the temperature is 4 Mk, and the length is about 8×108cm, so the thermal energy is7.1´1026 erg.
Figure 7.Schematic of the topology and magnetic reconnection in the two successive phases of a complex jet showing a few representativefield lines marked by light-headed arrows before and after bursts of reconnections.(a)Before reconnection n0 and the outer parts of n1 and n2 are open magneticfields with negative polarity. On both sides of n0, there are closed magneticfields with positive polarities p1 and p2 linking to the inner parts of the negative polarities n1 and n2, as shown. Arrows mark the direction of magneticfield lines.(b)Phase 1 of the reconnection process driven by magnetic cancellation between n0 and p1. Reconnection takes place at the X-point, with plasma velocities shown by solid-headed arrows. The upward-moving outflow jet from the reconnection site is channeled upward by the openfield lines as a spire. The separatrices and thefield lines that have reconnected(a new openfield line and a new closedfield line)are marked in red. The location of a chromospheric brightening is also indicated below the reconnection location and straddling n0 and p1.(c)Phase 1 continues with more reconnection at the X-point and so creates a lateral motion of the spire.(d)Phase 2 repeats the same process, but at the X-point on the left side of n0, driven by magnetic cancellation as p2 approaches n0. The separatrices and the newly reconnectedfield lines are shown in red.
The mean magnetic energy release rate is2.8´1027erg s−1, while the sum of the kinetic energy and thermal energy of the jet spire is1.5´1026 erg, and the thermal energy of the bright
patch at the footpoint is7.1´1026erg. Thus, about 30% of the
magnetic energy is converted to kinetic and thermal energy. Note that for Phase 1 of the jet, the average electron number density is 109cm−3and the mean temperature is 1.5 MK. For the bright patch at the footpoint of the jet, density2.5´109cm−3 and temperature 4 MK are taken from Liu et al.(2016).
References
Archontis, V., & Hood, A. W. 2013,ApJ,769, 21
Brooks, D. H., Kurokawa, H., & Berger, T. E. 2007,ApJ,656, 1197 Canfield, R. C., Peardon, K. P., Leka, K. D., et al. 1996,ApJ,464, 1016 Chae, J., Qiu, J., Wang, H., & Goode, P. R. 1999,ApJL,513, L75 Chen, J., Su, J., Yin, Z., et al. 2015,ApJ,815, 71
Chifor, C., Young, P. R., Isobe, H., et al. 2008,A&A,481, L57 Cirtain, J. W., Golub, L., Lundquist, L., et al. 2007,Sci,318, 1580 Forbes, T. G., & Priest, E. R. 1984,SoPh,94, 315
Guo, Y., Dmoulin, P., Schmieder, B., et al. 2013,A&A,555, A19 Heyvaerts, J., Priest, E. R., & Rust, D. M. 1977,ApJ,216, 123 Hong, J., Jiang, Y., Yang, J., et al. 2016,ApJ,830, 60 Jiang, R. L., Fang, C., & Chen, P. F. 2012,ApJ,751, 152 Lemen, J. R., Title, A. M., Akin, D. J., et al. 2012,SoPh,275, 17 Li, L. P., Zhang, J., Peter, H., et al. 2016,NatPh,12, 847 Liu, C., Deng, N., Liu, R., et al. 2011,ApJL,735, L18
Liu, J. J., Wang, Y. M., Erdelyi, R., et al. 2016,ApJ,833, 150 Liu, J. J., Wang, Y. M., Liu, R., et al. 2014,ApJ,782, 94
Moore, R. L., Cirtain, J. W., Sterling, A. C., & Falconer, D. A. 2010,ApJ, 720, 757
Moore, R. L., Sterling, A. C., Falconer, D. A., & Robe, D. 2013,ApJ,769, 134 Moreno-Insertis, F., & Galsgaard, K. 2013,ApJ,771, 20
Muglach, L. 2008,ApJ,687, 1398
Nishizuka, N., Shimizu, M., Nakamura, T., et al. 2008,ApJ,683, 83 Nóbrega-Siverio, D., Moreno-Insertis, F., & Martínez-Sykora, J. 2016,ApJ,
822, 18
Orange, N. B., Oluseyi, H. M., Chesny, D. L., et al. 2014,SoPh,289, 1901 Raouafi, N. E., Patsourakos, S., Pariat, E., et al. 2016,SSRv,201, 1 Scherrer, P. H., Schou, J., Bush, R. I., et al. 2012,SoPh,275, 207 Schmieder, B., Guo, Y., Moreno-Insertis, F., et al. 2013,A&A,559, A1 Shen, Y., Liu, Y., Su, J., & Deng, Y. , 2012,ApJ,745, 164
Shibata, K., Ishido, Y., Acton, L. W., et al. 1992, PASJ,44, 173 Shibata, K., Nitta, N., Strong, K. T., et al. 1994,ApJL,431, L51 Shimojo, M., Hashimoto, S., Shibata, K., et al. 1996,PASJ,48, 123 Shimojo, M., Shibata, K., & Harvey, K. L. 1998,SoPh,178, 379
Sterling, A. C., Moore, R. L., Falconer, D. A., & Adams, M. 2015,Natur, 523, 437
Syntelis, P., Archontis, V., Gontikakis, C., & Tsinganos, K. 2015, A&A, 584, 10
Yokoyama, T., & Shibata, K. 1995,Natur,375, 42 Yokoyama, T., & Shibata, K. 1996,PASJ,48, 353 Young, P. R., & Muglach, K. 2014a,PASJ,66, 12 Young, P. R., & Muglach, K. 2014b,SoPh,289, 3313 Zhang, Q. M., & Ji, H. S. 2014,A&A,561, A134 Zhang, Q. M., Ji, H. S., & Su, Y. N. 2016,SoPh,291, 859