MODELLING ASSEMBLY FOR PRODUCTION LINE OUTPUT- A CASE STUDY
LEE YEH YEE B041310043
BMCD
Email: [email protected]
Draft Final Report Projek Sarjana Muda II
Supervisor: DR SITI NURHAIDA KHALIL 2nd Examiner: DR. MOHD NIZAM SUDIN
Faculty of Mechanical Engineering Universiti Teknikal Malaysia Melaka
MODELLING ASSEMBLY FOR PRODUCTION LINE OUTPUT – A CASE STUDY
LEE YEH YEE
MODELLING ASSEMBLY FOR PRODUCTION LINE OUTPUT – A CASE STUDY
LEE YEH YEE
This report is submitted
in fulfillment of the requirement for the degree of Bachelor of Mechanical Engineering (Design and Innovation)
Faculty of Mechanical Engineering
UNIVERSITI TEKNIKAL MALAYSIA MELAKA
ii
DECLARATION
I declare that this project report entitled “Modelling Assembly for Production Line Output
– A Case Study” is the result of my own work except as cited in the references
Signature : ...
Name : ...
iii APPROVAL
I hereby declare that I have read this project report and in my opinion this report is
sufficient in terms of scope and quality for the award of the degree of Bachelor of
Mechanical Engineering (Design and Innovation).
Signature :. ...
Name of Supervisor : ...
iv
DEDICATION
v
ABSTRACT
vi ABSTRAK
vii
ACKNOWLEDGEMENT
viii CONTENT
CHAPTER CONTENT PAGE
SUPERVISOR’S DECLARATION ii
APPROVAL iii
DEDICATION iv
ABSTRACT v
ABSTRAK vi
ACKNOWLEDGEMENT CONTENT
LIST OF FIGURES LIST OF TABLES
LIST OF ABBREVIATION
vii viii xi xiv xv
CHAPTER 1 INTRODUCTION 1
1.1 Background 1
1.2 Problem Statement 2
1.3 Objective 3
1.4 Scope Of Project 3
CHAPTER 2 LITERATURE REVIEW 4
2.1 Assembly Lines 4
2.1.1 Type of Assembly Line Balancing 5
2.2 Bottleneck 7
2.2.1 Introduction to Bottleneck 7
ix
2.2.3 Detection of Bottleneck 8
2.2.4 Bottleneck Detection Methods
2.2.5 Effects Bottleneck to Production Line
2.3 Cycle Time
2.4 Business Agility
2.5 Lean Manufacturing
2.6 Kaizen Method
2.6.1 Role of Kaizen in an Organisation
2.7 Six Sigma
2.7.1 Measurement system analysis 2.7.2 Process Control
2.7.3 Design of Experiment
2.7.4 Failure Mode and Effect Analysis 2.7.5 Quality Control &Capability Analysis
2.8 Business Process Modelling
2.8.1 Framework of a BPM
2.8.2 Quality of Business Process Modelling
2.9 Enterprise Architecture
2.10 Production Efficiency 2.11 Types of Model
2.11.1 Dynamic Modelling 2.11.2 Static Modelling 2.11.3 Three classes of model
8 9 9 11 13 15 16 17 18 19 19 19 20 20 21 22 23 24 26 26 28 29
CHAPTER 3 METHODOLOGY 30
3.1 Introduction 30
3.2 Flowchart and Gantt Chart 30
3.3 General Flowchart 31
3.4 Gantt Chart of the Process 34
CHAPTER 4 RESULTS AND DISCUSSION
4.1 Result
4.1.1 Conceptual Model
x
4.1.2 Selection of Product 4.1.3 Process Involved 4.1.4 Data Collected 4.1.5 Layout of the Plant
4.2 Discussion
4.2.1 Static Modelling 4.2.2 Dynamic Modelling 4.2.3 Simulation Modelling 4.2.4 DOE – Test 1
4.2.5 DOE- Test 2 4.2.6 DOE- Test 3
36 36 37 39 42 42 43 43 45 51 54
CHAPTER 5 CONCLUSION
5.1 Introduction
5.2 Conclusion
5.3 Recommendations
62 62 62 63
REFERENCE 64
xi
LIST OF FIGURES
FIGURE TITLE PAGE
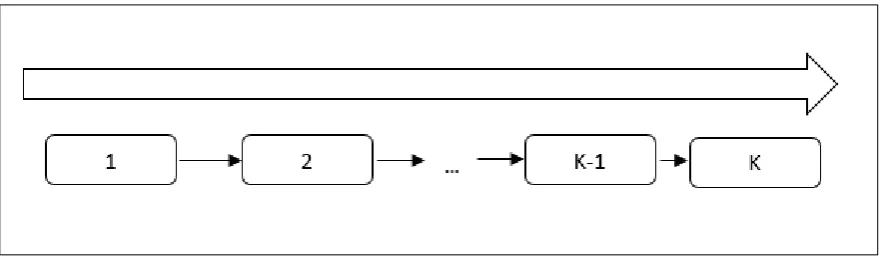
2.1.1(a) Single assembly line (Adapted from W. Grzechea et al.,2015) 5
2.1.1(b) U-shaped assembly line (Adapted from W. Grzechca et al,
2015)
5
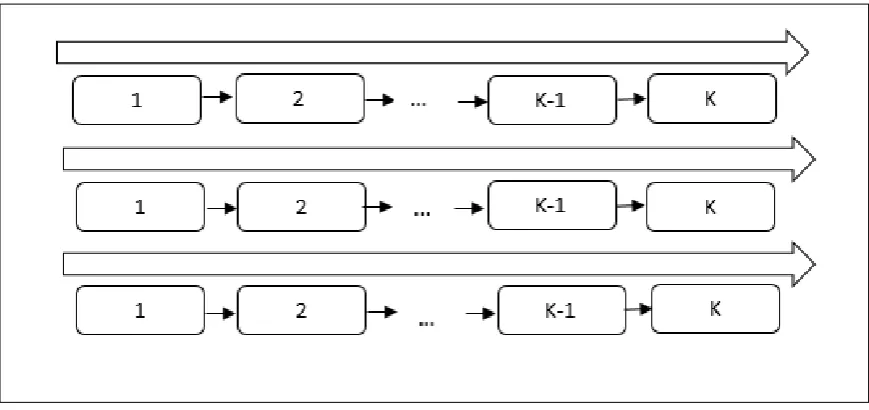
2.1.1(c) Parallel assembly line (Adapted from W. Grzechca et al, 2015) 6
2.1.1(d) Parallel station assembly line (Adapted from W. Grzechca et al,
2015).
6
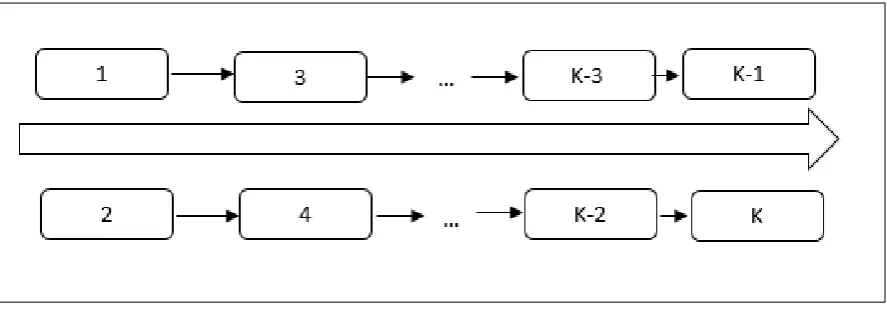
2.1.1(e) Two sided assembly line (Adapted from W. Grzechca et al,
2015)
7
2.3(a) Importance of CT estimation at different stages (Adapted from
Chen, 2013)
10
2.3(b) Improvement chart (Adapted from Mason-Jason &
Towill,1999)
11
2.6 Kaizen event outcome sustainability research outcome (Adapted
from Wiljeana J Glover et al.,2011)
xii
2.7 Six sigma research model (Adapted from Ang Boon Sin et al.,
2015)
18
2.8.1 Framework of evaluation (Adapted from Bart-Jan Hommes et
al., 2000)
22
2.11.1(a) The basic model configuration (Adapted from Bernard Mc Garvey et al., 2004)
27
2.11.1(b) Steps of building dynamic modelling (Adapted from Khalil, 2012)
28
3.3 Methodology flowchart 31
3.4(a) Gantt chart of process flow in PSM 1 34
3.4(b) Gantt chart of process flow in PSM 2 34
4.1.1 Conceptual model of general production line. 35
4.1.3
4.1.5(a)
Process flow of Turbo fan 3HP- Panasonic
Plant layout
37
40
4.2.1 Static modelling of production line 42
4.2.3(a) SM of the production line 43
4.2.4(a) Bottleneck of production line 46
4.2.4(b) Comparison of skilled and unskilled operator 49
4.2.4(c) CT of processes after line balancing 51
4.2.5(a) SM with delays removed 52
4.2.5(b) Comparison of efficiency 54
4.2.6(a) Actual layout of production line 55
4.2.6(b) Improved layout of production line 56
xiii
4.2.6(d) SM with improved layout 59
xiv
LIST OF TABLES
4.1.5 Process at each station 41
4.2.4(a) Comparison of skilled and unskilled operators 48
4.2.3(a) Work in progress (WIP) 45
4.2.5(a) WIP when delays are removed 53
4.2.6(a) Comparison of CT when using actual layout and improved
layout 57
xv
LIST OF ABBEREVATIONS
SM Simulation modelling
CT Cycle time
DOE Design of experiment
1 CHAPTER 1
INTRODUCTION
1.1 Background
The assembly line is the root factor of successful manufacturing today. From our
cars, electronic devices and food are produced from an assembly line model. Little did we
know how much assembly processes have changed throughout the decades. Back then,
manufacturing a product takes a long time. Complex manufacturing like cars may take up to
12 hours of production time. On December 1, 1913 Henry Ford introduced his assembly line
that took the manufacturing world by storm.
Even now, business owners are eager to find solutions to decrease the time needed
to produce a product. Engineering has its flaws and this is also applied to the production line.
There is a wide variety of inefficiencies that occur throughout the production line. The
production field is facing a new challenge which various influences of society and
environment have to be taken into account. Every day in production line there are many
faulty products that cause more losses to the industry. Problems that occurred in the
production line also include delay between processes, production errors, faulty equipment
and lack of manpower. When the listed problems occur, the production efficiency is also
affected. Production efficiency refers to how many products are produced without wasting
resources. During the recent years, studies have been carried out massively to overcome
inefficiency problem in the production line so as to increase efficiency and productivity to
produce products of higher quality with lower cost.
There are many processes that are involved in assembly production line. In each
2
of frame is too long or time needed to assemble the printed circuit boards to the machine is
too long. Hence, improvement can be made to the process so that shorter time is needed for
the process to take place. This will result in more frames being assembled and more circuit
boards can be assembled on their designated location at a given time. Consequently, this will
produce more machines at a given time and increases the efficiency of the company.
Besides that, there are also delays that occur throughout the production. This may be
due to problem of information flow. In every production line, there is a standard of
procedures (SOP) that is provided for workers to follow. Delays may be caused from the
processes written in SOP are not according to a good flow. A good flow of information may
save more production time. In many cases, the delays are caused by poor management of
map processes. This may be due to process that can be carried out in parallel are practiced
in series. With map processes also, the direction of process and time needed for a process to
complete are well established hence processes can be carried out with a smooth flow.
1.2 Problem Statement
The inefficiency that occurred in the production line of the company represents the
percentage of profit that is lost from the company. Companies emphasise on reducing
production time. Many production lines are putting a lot of effort in improving the efficiency
of the system. Unfortunately there are still many lacking points in the processes carried out
in the production line. Many companies have their standard of procedures (SOP) ready but
there are still elements to be improved. By using modelling assembly process, the efficiency
3 1.3 OBJECTIVE
The objectives of this project are as follows:
1. To study the activities involved in the production line.
2. To obtain the duration of processes involved in the production line.
3. To provide a complete analysis and solution to improve the efficiency of
production line.
1.4 Scope of Project
The scopes of this project are:
1. Only processes that involved in the production line will be timed.
2. Improvements will be done with existing processes, equipment and man
4 CHAPTER 2
LITERATURE REVIEW
2.1 Assembly Lines
Assembly lines are a common element especially in a system which emphasizes on its
production. The first manufacturing assembly line is introduced by Henry Ford in the early
1900’s. The principle of an assembly line is to have a set of workstation that is in linear
manner with each work station connected by a material handling device. (W. Grzechca et al,
2015). At any point where task is carried out is called a station. Process time means the time
taken to complete each task. Meanwhile, the cycle time is usually fixed according to the
production rate. However, there are always problems that arise with the assembly line. Hence,
line balancing is introduced to minimize imbalance between/among workers and workload
so as to achieve required run rate (Nguyuen et al., 2016). In order to get to the root cause of
the problem, the assembly process, workstation layout and workstation cycle time should be
analyzed to justify the imbalance of assembly line. According to Bautista et al., (2015), there
are two types of assembly line balancing problems. The two types of assembly line balancing
problems are as follow:
Simple assembly line balancing problem (SALBP)
General assembly line balancing problem (GALBP)
In addition to that, Bautista et al., (2015) also states that SALBP is made of assembly
problems that attempts to minimize the total idle time when two types of task that are
exclusively considered and GALBP arises when there are problem with addition
5 2.1.1 Types of Assembly Line Balancing
There are different types of assembly line structures such as serial line, parallel line, two
sided line and many others. All of the types can be categorized into two major types, first,
constant cycle time and minimization of workstations and second type is constant number
of workstations and minimization of cycle time (W. Grzechca et al, 2015). According to
(Aase, Olson and Schniederjans, 2004), a U-shaped assembly line shows more advantages
[image:22.595.87.527.274.405.2]as compared to a straight line assembly line.
Figure 2.1.1(a): Adapted from W. Grzechca et al, 2015 Single Assembly line
[image:22.595.83.527.472.624.2]6
Figure 2.1.1(c): Adapted from W. Grzechca et al, 2015 Parallel assembly line
7
Figure 2.1.1(e): Adapted from W. Grzechca et al, 2015 Two sided assembly line
2.2 Bottleneck
2.2.1 Introduction of bottleneck
Line balancing is a technique that is often used in production lines. However, bottleneck
points also occur throughout the production line where the efficiency of production line will
be affected. As a result of bottleneck, the amount of wastes will increase. The occurrence of
bottleneck inhibits the performance of companies. Problems related to bottleneck have been
studied for decades. According to J. Hinckeldeyn et al., (2013), bottleneck often appears
when a capacity demand exceeds the supply of respective source.
2.2.2 Cause of Bottleneck
The major cause of bottleneck is the discrepancies that occur in the production rates among
work stations (C.H Glock et al., 2013). This happens when there are production rates that
are unequally higher than other stations. Consequently, this will cause the bottleneck to