Novel markers for detection
of CTCs without EpCAM
expression
Chaja Hudepol
Abstract
Circulating tumour cells (CTCs) in the blood of a cancer patient can give information on the status of the cancer. Tumour cells that enter the blood stream can have different phenotypes. Epithelial cells express antigens that are mostly involved in cell adhesion and cell signalling. Mesenchymal cells on the other hand express antigens that are important for cell motility and movement. CTCs can express either one of the phenotypes, or reside in a state where antigens of both phenotypes are expressed. CTCs are currently isolated using the CELLSEARCH® system, which employs EpCAM and Cytokeratins to identify the tumour cells. However, since both antigens are characteristic for the epithelial phenotype, it could be that cells of the mesenchymal phenotype are lost.
The purpose of this research is to give an indication of the role of epithelial-mesenchymal transition in the expression of different antigens, and to identify antigens that can be used next to EpCAM and Cytokeratins in the detection of CTCs. To reach this goal, immunostaining was optimised, and the mesenchymal antigens Vimentin and Cadherin 11 were tested on cell lines with varying EpCAM expression.
Glossary
BC Breast cancer
Cad11 Cadherin 11
CK Cytokeratin (plural: CKs)
CTC Circulating tumour cell (plural: CTCs)
EMT Epithelial-mesenchymal transition
GaM-PE Goat-anti-Mouse IgG-PE
GMO Genetically modified organisms
MET Mesenchymal-epithelial transition
NSCLC Non-small cell lung cancer
PC Prostate cancer
PC3-5.2 PC3-αNcat 5.2
PC3-92.1 PC3-αNcat 92.1 F
RT Room temperature
Table of Contents
Abstract ... ii
Glossary ... iii
1. Introduction ... 1
1.1 Cancer ... 1
1.2 Epithelial and Mesenchymal phenotype ... 1
1.3 Circulating tumour cells ... 2
1.3.1 Detection of CTCs ... 3
1.4 Antigens ... 4
1.4.1 Cadherin 11 ... 4
1.4.2 Vimentin ... 5
1.4.3 Cytokeratins ... 5
1.5 Aim of this research ... 6
2. Methods ... 7
2.1 Culturing cell lines ... 7
2.1.1 PC3 ... 7
2.1.2 LNCaP ... 8
2.1.3 NCI-H1650 ... 8
2.1.4 NCI-H1563 ... 8
2.1.5 MCF-7 ... 8
2.1.6 MDA-MB-231 ... 8
2.2 Blood lysis ... 8
2.3 Immunofluorescent Staining ... 9
2.4 Conjugating antibodies to FITC-fluorochrome ... 10
2.5 Analysis of cells ... 10
3. Results ... 12
3.1 Vimentin and Cytokeratins in cell lines ... 12
3.2 Development of Cadherin 11 staining ... 16
3.3 Vimentin and Cadherin 11 tests on blood ... 19
3.4 Expression of EMT markers in cell lines ... 20
4. Discussion ... 21
5. Conclusion... 22
6. Recommendations ... 23
1.
Introduction
1.1
Cancer
With roughly 14 million new cancer patients, and 8 million people dying from cancer each year, cancer is the largest death cause around the world [1]. Cancer is a very diverse disease. Because it is caused by, sometimes random, mutations in the genome, almost every cancer is different. This makes treatment very difficult. General treatment now exists of surgery, radiotherapy, and chemotherapy, but a lot of research is done into more tailored treatment methods. Since the presence of metastases largely decreases the chance of survival of the patient [2], looking at the cause of these metastasis can result in better treatment. Incorporating circulating tumour cells (CTCs), from which metastases originate, in the detection and monitoring of cancer could be one way to allow for a more tailored and personal treatment of cancer.
1.2
Epithelial and Mesenchymal phenotype
Before being able to understand the way in which CTCs come to be, it is important to understand the difference between two different phenotypes of CTCs: the epithelial and mesenchymal phenotype. Most cells in our body are of the epithelial phenotype. They are strongly fixed in a tissue, and connect to other cells and the extracellular matrix (ECM) with membrane molecules and junctions. The strong structure that is created ensures that the cells maintain their shape, and can interact and communicate, forming a well-functioning tissue or organ. Epithelial cells often have a cuboidal shape which enables apicobasal polarity, meaning that different membrane proteins are expressed on the different sides of the cell. These cells rely heavily on their neighbours for survival [2].
Cells can however change into the mesenchymal phenotype, which means that a cell releases itself from the surrounding cells and de ECM. This comes with a loss in expression of certain proteins, and a gain of others, such as cytokeratins and vimentin respectively, as can also be seen in figure 4. Mesenchymal cells are all the cells that are not fixed in one place, and can move around the body. These are mostly blood cells and stem cells. These cells do not have strong bonds with other cells, and do not connect to a basement membrane, but rather float around in the fluids of the body or migrate through tissues using focal adhesions. Their shape varies between oval and marquise, and they have a front-back polarity. Because of their shape, these cells cover a much larger surface than an epithelial cell [3].
1.3
Circulating tumour cells
When a cancer patient has a malignant tumour, this tumour releases cancer cells into the bloodstream. This release of cells is due to a combination of factors. A malignant tumour can induce the growth of new blood vessels (angiogenesis) by releasing endothelial growth factors, these new blood vessels supply the tumour with enough nutrients to grow. These blood vessels are not made in a structured manner, and they vary from normal blood vessels in shape and organisation. On top of that, the vessel walls are often leaky, which allows an exchange of cells between the blood vessel and the tissue. This exchange leads to tumour cells entering the bloodstream, either by accident or on purpose [2]. The difference between entering by accident or on purpose lies mostly in the phenotype of the cell [4].
Cells that enter the bloodstream by accident are usually epithelial type cells, that have broken loose from the tissue and fall into the blood vessel. Normal cells would not survive because of their lack of cellular contact, which induces apoptosis. However, epithelial tumour cells can survive in circulation because of their cancerous properties [2] [3].
Cells with the mesenchymal phenotype often enter the bloodstream on purpose, sometimes by actively pushing themselves between the endothelial cells of the vessel wall. Since mesenchymal cells do not require cellular contact, they are more likely to survive in the bloodstream [2] [3]. Once a tumour cell enters the bloodstream it is called a CTC. If these CTCs manage to survive the force and blood pressure, and avoid the immune surveillance of the white blood cells (WBCs), they can extravasate and enter the tissue of a different organ. Here, according to the ‘Seed and Soil Hypothesis’, the cells can either die, enter dormancy, or proliferate and form a metastasis, depending on the hostility of the environment [2] [3].
When taking a blood sample from a cancer patient with a tumour, CTCs can be found in the blood. The presence of CTCs and metastasis is an indication of a lesser chance of recovery for the patient [2].
[image:7.612.125.485.499.639.2]Once extracted, CTCs can give information about the type and the state of the cancer. Regular checks on the number and characteristics of CTCs can also indicate in an early stage if the treatment is working, and how the tumour develops [5] [6].
1.3.1 Detection of CTCs
Detection and isolation of CTCs is rather difficult, since there are as little as 1 to 10 CTCs per ml of blood. In a clinical setting, these CTCs are currently detected and isolated using CELLSEARCH®. This is the only FDA approved technique for clinical use.
[image:8.612.116.498.209.433.2]This machine binds an anti-EpCAM antibody to the CTC. Connected to the anti EpCAM is a ferrofluid which enables isolation of CTCs using a magnetic field. After isolation, the EpCAM positive cells are stained with anti-Cytokeratin and CD45 to distinguish between blood cells and CTCs [8].
Figure 2: The CELLSEARCH® system. (A) 7.5 ml of blood is taken from a patient. (B) CTCs are enriched with an
anti-EpCAM-ferrofluid labeling by the Autoprep system, (C) a magnetic field is used for separation. (D) Isolated cells are stained with DAPI (blue), Anti-CK-PE (yellow), and CD45-APC (red). (E) Cells are analyzed on their expression of different markers. CTCs are identified as expressing both DAPI and CK, WBCs are identified as expressing DAPI and CD45.
EpCAM is a protein that plays an important role in the adhesion of different epithelial cells [9], and is specific for the epithelial phenotype. However, during the process of epithelial to mesenchymal transition, cells can lose the expression of epithelial proteins, such as EpCAM and Cytokeratins, and gain expression of mesenchymal proteins, such as Vimentin and Cadherin 11. Therefore, mesenchymal CTCs that do not necessarily express EpCAM, are currently not detected using CellSearch.
[image:8.612.223.386.603.680.2]1.4
Antigens
In figure 4, one can see the process of EMT visualised. The epithelial cell has its distinct cuboidal shape and has markers such as EpCAM, E-Cadherin, and Cytokeratins. The mesenchymal phenotype on the right is characterised by a round shape, and markers such as N-cadherin, Cadherin 11, and Vimentin. Because in cancer the process of EMT is more lenient, there is an intermediate phenotype possible, where cells express some epithelial and some mesenchymal markers. In this research the focus will lie on the expression of EpCAM, Cytokeratins, Vimentin, and Cadherin 11, as a means to identify the phenotype of the cell.
Figure 4: The transition from epithelial to mesenchymal phenotype visualized. Epithelial markers, such as EpCAM and CKs are lost, while mesenchymal markers, such as Vimentin and Cad11 are gained during the transition [10].
1.4.1 Cadherin 11
[image:9.612.115.501.205.334.2]1.4.2 Vimentin
Vimentin is an intermediate filament of type III, which has a diameter of approximately 10nm. Next to intermediate filaments, there are two other types of filaments, namely Actin filaments and micro-tubules. All filaments play their own role in maintaining the structure and shape of the cell [17]. All filaments, including Vimentin, are found inside the cytoplasm of the cells. Since Vimentin is attached to the nucleus, mitochondria and cell membrane, it can induce changes in cell shape and structure [18]. It has also been shown that Vimentin plays an important role in EMT and MET; when Vimentin expression is lost, cells start expressing epithelial traits, such as Cytokeratins, whereas when Vimentin is expressed, cells change into the mesenchymal state [19]. This also makes Vimentin an important mesenchymal antigen.
In cancer, Vimentin plays a role in the prevention of autophagy, and in regulating cellular motility. Additionally, by influencing the 14-3-3 proteins, Vimentin can modulate intracellular signalling and cell cycle control pathways [20].
Figure 5: PC3 (prostate cancer) cells stained with Vim-FITC (green, 2µg/ml) and hoechst 33342 (blue, 4µg/ml) magnification 400x (40x 0.6NA Nikon).
1.4.3 Cytokeratins
[image:10.612.238.375.276.394.2]Cytokeratins (CKs) are also a class of intermediate filaments, and part of the cytoskeleton. CKs are specific for epithelial cells, and different types of cancer express a different spectrum of CKs. This trait can be used to identify different carcinomas, or find the origin of a metastasis. There are about 20 different CKs known, of which CKs 1-8 are acidic, and CKs 9,10,12-14,16-20 are basic or neutral [21]. CKs are a very common marker used to detect tumour cells either in metastasis or in blood. It is unclear whether CKs also influence the invasiveness of motility of the tumour cell.
[image:10.612.239.373.556.674.2]1.5
Aim of this research
Because CTCs are very rare in the blood of a cancer patient, it would be ideal to be able to isolate all of them. Since CTCs are now isolated using EpCAM, the EpCAM negative CTCs are lost. Therefore, the goal of this research is to optimise immunostaining and characterize EpCAM positive and negative cell lines on the presence of epithelial and mesenchymal antigens to determine their EMT status, and possibly identify alternative markers for the CellSearch system. This would also show if there is indeed a relation between the epithelial and mesenchymal phenotype, which would indicate the role of EMT and MET in the detection of CTCs.
For this purpose, six cell lines were chosen: two prostate cancer, two lung cancer and two breast cancer cell lines. Of each cancer, one cell line has a high EpCAM expression and one has a low or negative EpCAM expression.
[image:11.612.87.527.336.464.2]These cell lines were tested for their expression of three proteins: Vimentin, Cadherin 11, and Cytokeratin numbers 4,5,6,8,10,13,18. The first two of these are proteins characterizing the mesenchymal phenotype, while the last is an indication of the epithelial phenotype, which is already in use in the CellSearch system. These three proteins, together with the known EpCAM expression should give an indication of the EMT status.
Table 1: Showing the expression of different antigens, as was found in literature.
Epithelial phenotype Mesenchymal phenotype EpCAM Cytokeratins Vimentin Cadherin 11 PC LNCaP + [22] + [22] - [22] - [12]
PC3 - [23] + [24] + + [25] NSCLC NCI-H1650 + + [23] + [26] + [27] ?
NCI-H1563 - [23] + - [23] + [28] ? BC MCF7 + [23] + [29] - [30] - [15]
2.
Methods
Since all data collected per cell line had to be comparable, the protocol for staining the cells was standardized as much as possible. Therefore, all cells were fixed immediately after harvesting, and were used within a week after fixation. For all stains using antigens inside the cells, cells were permeabilised, this included Vimentin and CKs. However, to avoid unspecific staining, cells stained for surface antigens were not permeabilised.
2.1
Culturing cell lines
To ensure optimal conditions for the cells in culture, they were checked upon twice a week. During the check was looked at the colour of the medium, the density of the cell growth in the flask, and the shape and attachment of the cells. the medium was replaced twice a week. If overgrowth in the flask reached full covering, cells were harvested and sown in a new flask with a density of 5K (5000 cells per square cm). The cell medium was stored in the fridge, and transferred to 50ml bottles for usage, this to ensure the sterility of the large bottle of medium. For refreshment of the medium, 5ml of medium was used for a T25 flask, and 15ml for a T75 flask. To transfer the cells, PBS (Sigma, Cat: P-5368, Lot: SLBQ7495V) was used to wash the cells, followed by the addition of 1 or 3 ml of 0.05% Trypsin-EDTA (Gibco, Cat: 25300-062, Lot: 1754037) to release the cells from the flask for transfer. The cells with Trypsin were incubated for 5 minutes at 37 degrees, followed by the addition of 2 or 6 ml of medium. The suspension was then transferred to a tube and the concentration of cells was counted using the Luna Cell Count. After counting, a new flask was filled with medium, and the appropriate amount of cell suspension was added.
The cells that were not used for culture were fixed immediately after harvest. First the suspension was centrifuged and the supernatant aspirated. Then the cells were resuspended in 1ml of a 1% Formaldehyde solution (Sigma, Cat: 533998-500ml, Batch: 08996DM), and incubated at room temperature for 10 minutes. The suspension was then again centrifuged and aspirated, followed by the addition of 2ml of PBS/BSA1% (Sigma, Cat: A7906-100g, Lot: SLBT0167). The fixated cells were stored at 4°C. Cells were stored for a maximum of one week after fixation.
2.1.1 PC3
For this research, both two modified lines of PC3, one highly positive and the other very negative for Cad11, and the normal PC3 line were cultured.
PC3 cells are epithelial and originate from prostate cancer, but were derived from a metastasis in the hip bone. With 62 chromosomes, the cells are nearly triploid [31]. The cells were grown in RPMI-1640 (Lonza, Cat: BE12-702F, Lot: 6MB165) with 10% FBS (Sigma, Cat: F7524, Lot: 124M3337) [32] at 37 degrees in the CO2 incubator.
2.1.2 LNCaP
LNCaP is a prostate cancer cell line with epithelial morphology. Cells were derived from a lymph node metastasis [22]. They were grown at 37 degrees in the CO2 incubator in RPMI1640 with
10%FBS and 1%Penstrep (Lot: 4MB132).
2.1.3 NCI-H1650
NCI-H1650 is a lung cancer cell line with epithelial morphology and very high EpCAM expression. The cells were taken from a metastasis in the lung. The cells were grown in the CO2 incubator at
37 degrees in RPMI-1640 with 10% FBS and 1% penstrep.
2.1.4 NCI-H1563
This is a very EpCAM negative lung cancer cell line. It was taken from an adenocarcinoma in the lung. Cells were cultured in RPMI1640 with 10%FBS and 1% penstrep, and grown at 37 degrees in the CO2 incubator.
2.1.5 MCF-7
MCF-7 is a breast cancer cell line that was derived from a metastasis in the pleura. The cells naturally grow in small cultures, and express an epithelial phenotype. Cells are cultured in DMEM (Lonza, Cat: BE12-604F, Lot: 6MB175) with 10%FBS and 1% penstrep, in the CO2
incubator at 37 degrees.
2.1.6 MDA-MB-231
This is the second breast cancer cell line. It was also derived from a metastasis in the pleura. Cells are of the epithelial type and grow in DMEM with 10%FBS and 1% penstrep, and grew in the CO2
incubator at 37 degrees.
2.2
Blood lysis
To obtain white blood cells, whole EDTA blood was lysed. During lysis, the red blood cells are destroyed, and only the WBCs remain. The is done using an Ammonium lysis buffer. This buffer contained 830mg NH4CL, 100mg KHCO3, and 3.9mg EDTA, dissolved in 100ml MilliQ. The blood
was diluted 1:20 in this buffer, and incubated on ice for twenty minutes. It was then spun off for five minutes at 500xg and aspirated, washed twice with 2ml PBS/AC, containing 100ml PBS, 50mg BSA, and 390mg Na3C6H5O7. Afterwards the WBCs were fixed with a 1% Formaldehyde
2.3
Immunofluorescent Staining
Since both CKs and Vimentin are inside the cell, cells have to be permeabilised before staining. For CK staining, the C11 (MCBP, Lot: D339) antibody blend was used, which stains CKs 4,5,6,8,10,13,18. This blend was combined with FITC and had a concentration of 1mg/ml, and was always diluted 1:10 in PBS/BSA1% before usage. For Vimentin, the Vimentin-FITC antibody from eBioscience was used. This product contains Vimentin clone V9 (eBioscience, Cat: 11-9897-80, Lot: 4298312), at a concentration of 0,5mg/ml. For the staining this was diluted 1:10 with PBS/BSA1% to give a concentration of 50µg/ml.
Two versions of anti-Cad11 were used in this research, the first concerned clone 16.a.c.5, which was donated by Nijmegen. The second version concerned anti-Cad11 from Biolegend (Cat: 368702, Lot: B206555, clone 16G5). Both versions are unconjugated and require the use of a secondary antibody.
For this purpose, Goat-anti-mouse IgG-PE (SantaCruz Biotechnology, cat: SC-3738, Lot: D0612) was chosen. This antibody has a concentration of 200µg/ml, but was diluted 1:10 before usage. From now on this antibody will be referred to as GaM-PE.
For tests using WBCs, the CD45 antibody was used to distinguish WBCs from CTCs, as the antigen is only found on WBCs. Two versions of this antibody were used in the tests. The CD45-PerCP antibody (Aczon, Cat: CD45-GMF000S, Lot: 1405OCS-3648) has a concentration of 0.176mg/ml, while CD45-APC (MCBP) has a concentration of 30µg/ml.
For immunofluorescent staining after fixation, cells were permeabilised using 250µl PBS/Saponin 0.05% solution (Sigma, Cat: 84510-100g, Lot: BCBD149V) for 10 minutes at room temperature (RT), and afterwards spun down for 5 minutes at 500xg and aspirated. The cells were then resuspended in a total volume of 100µl of PBS/BSA1%/Saponin0.05%, together with the antibodies, and incubated for 10 minutes at RT. The concentrations for the antibodies were 2µg/ml for Vimentin, 1µg/ml for Cytokeratins, 5 µg/ml for Cadherin 11, and 2µg/ml for CD45. After incubation, the cells were again spun down and aspirated.
In the case that a secondary antibody was used, the cells were washed using 100 µl of PBS/BSA1%, and incubated 10 minutes at RT, spun down and aspirated. Then the cells were resuspended in a total volume of 100 µl of PBS/BSA1% with 5 µg/ml GaM-PE, and incubated 10 minutes at RT.
2.4
Conjugating antibodies to FITC-fluorochrome
To avoid the need for a secondary antibody, the anti-Cad11 from Nijmegen was also conjugated using FITC as a fluorochrome. For this, a Zebar spin desalting column was used (Thermo Fischer). Before use, the column was opened at the top and the bottom, and placed in a collection tube. One side was marked to maintain the same position in the centrifuge. The column was then centrifuged for 2 minutes at 1000xg, and the storage solution was discarded. Afterwards the column was washed three times using 1ml of a sodium bicarbonate buffer (210 mg NaHCO3 in 250ml MilliQ), spun down,
and the solution discarded.
The column was then placed in a new collection tube, and 500 µl of the antibody was pipetted on the column. The column was then again spun down, and the solution was collected in the tube.
Then a solution of 20mM fluorochrome in anhydrous DSMO was prepared. 1ml of the antibody was collected in an Eppendorf tube, to which a 20 times molar excess of the fluorochrome-DSMO solution was added. This solution was suspended and stored for 2 hours at 4°C, wrapped in aluminium foil.
A new Zebar column was prepared like the first one, after which it was placed in a new collection tube. The antibody-fluorochrome solution was then slowly pipetted on the column and spun down. The product was transferred to an Eppendorf tube and stored at 4°C.
2.5
Analysis of cells
For analysis of the samples, both the flowcytometer (BDFACS aria cellsorter) and the fluorescent microscope (Nikon Eclipse E400) were used. For the flowcytometer, the variables were optimised for each test, while with the microscope, the variables were kept as constant as possible.
The flowcytometer takes the sample, which consists of a suspension with cells stained with a fluorescent label, and mixes this sample with the sheath fluid. This dilution flows through a nozzle that forms droplets, with each droplet containing one cell. These droplets pass through a laser beam, and the way in which the light is scattered tells something about the size (forward scatter) and complexity (side scatter) of the object inside the droplet. Additionally, the fluorescent channels detect the light sent by the excited fluorescent label.
The sensitivity of all these detectors can be adjusted to enable optimal detection and distinction between background and results. During the tests, the voltages, which can enhance or decrease a signal,were kept constant per test, but varied between tests. Therefore, the flowcytometer results that have different voltages can not be compared.
Figure 7: The working of the flowcytometer. Light is scattered by the events in the droplets, and is detected in different detectors [33].
The fluorescent microscope (Nikon Eclipse E400) works with a laser that is filtered through an excitation filter. This filter allows only one colour of the laser to pass to the sample. Here this light excites the fluorescent labels on the cells, which emit another wavelength of light. This light is then detected by a camera (Hamamatsu C8484-03G or C11440-4U2). The image given by the camera could be visualised in the program Hokawo (Hamamatsu Photonics), which allowed for a change in shutter time and LUT values. These values were kept as constant as possible for all tests, to allow comparison between test results. Images that were obtained were also merged in Hokawo, while a scalebar was added using the program ICY [34]. Objectives that were mostly used for images were 100x and 400x magnification (10x 0.3NA Nikon, 40x 0.6NA Nikon), and reflection cubes were DAPI, FITC, PE, and APC.
[image:16.612.230.382.422.588.2]3.
Results
The aim of the research was to test EpCAM positive and negative cell lines for the expression of epithelial and mesenchymal markers. Below the findings of this research are shown.
3.1
Vimentin and Cytokeratins in cell lines
Vimentin and CKs were titrated on PC3 (EpCAM low) and MCF-7 (EpCAM high) respectively. From these titrations, the concentrations of 2µg/ml for Vimentin and 1µg/ml for CKs were chosen to work with in further tests. Optimal concentration was chosen based on the mean of the signal, the increase in this mean with increased concentration, and the possibility to distinguish the signal from the background.
Table 2: Results of the titration tests using several concentrations of antibody for detection. Green indicates chosen concentrations. Numbers noted are mean values of signal as derived from flowcytometry analysis. Vimentin was tested on PC3. Cytokeratin was tested on MCF7.
1µg/ml 2µg/ml 4µg/ml 5µg/ml Vimentin (PC3) 3.123 5.293 9.008 -- Cytokeratins (MCF7) 10.670 22.371 -- 57.503
Vimentin Cytokeratins
LNCaP
764
EpCAM/µm2
LUT: 249-2205 LUT: 250-481
Mean: 127 Mean: 375
PC3
11 EpCAM/µm2
LUT: 249-2205 LUT: 250-483
NCI-H1650
1036
EpCAM/µm2
LUT: 249-364 LUT: 249-483
Mean: 4.675 Mean: 506
NCI-H1563
4 EpCAM/µm2
LUT: 249-2204 LUT: 249-481
MCF-7
1055
EpCAM/µm2
LUT: 770-13800 LUT: 750-6500
Mean: 165 Mean: 316
MDA-MB-231
20 EpCAM/µm2
LUT: 770-13800 LUT: 750-6500
[image:20.612.87.536.70.611.2]Mean: 1.918 Mean: 328
Figure 9: Microscopic images and flowcytometer results of all tests on cell lines. The nucleus is stained with Hoechst 33342 (blue, 4µg/ml), and Vimentin (2µg/ml) and CK (1µg/ml) were labelled with FITC (green). The integration time for FITC was 2 seconds, and that of Hoechst was 12ms. All images were taken using the 400x magnification (40x 0.6NA Nikon). LUT values for MCF7 and MDA-MB-231 differ from the rest due to the use of a different camera (Hamamatsu C11440-4U2, instead of C8484-03G). Flowcytometry gates were set at the edge of the background noise, so all signal that is left of the gate can be seen as noise. The mean of the data is given below each graph.The number of EpCAM antigens per µm2 is
3.2
Development of Cadherin 11 staining
During this research, two clones of the Cad11 antibody were tested for their optimal concentration, as the intention was to use Cad11 staining parallel to Vimentin and CKs in the cell line tests. Clone 16.a.c.5 of anti-Cad11 was donated to the MCBP group by the university of Nijmegen. This clone was conjugated with FITC at the MCBP lab. The first titration with this conjugated antibody done on PC3-5.2 and PC3-92.1, did not show a difference between signal and background. A follow-up test was done, which compared the conjugated and unconjugated antibody, using GaM-PE as a secondary antibody in both samples. Figure 10 shows that also in this experiment there is no difference between the background noise and expected signal.
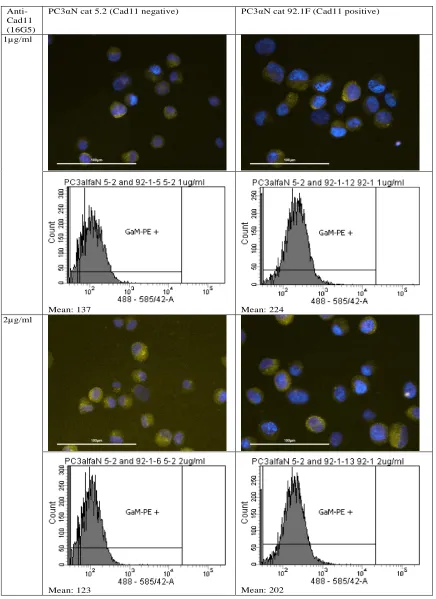
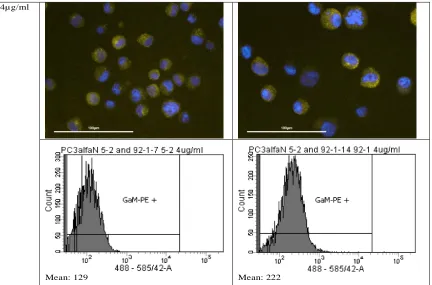
Therefore, anti-Cad11 was commercially purchased (clone 16G5, Biolegend). Since this Cad11 was unconjugated, GaM-PE was used as a secondary antibody. Figure 11 shows the microscopic images and the flowcytometry plots for both cell lines at different concentrations of the antibodies. It is visible that with an increase in concentration, the difference between the means of the negative and positive cell line increases slightly. However, the mean values of both cell lines stay relatively constant with increasing concentrations.
Anti-Cad11 (16.a.c.5)
FITC expression PE expression
Cad11-FITC
Mean: 199 Mean: 228
Cad11-FITC GaM-PE
Mean: 219 Mean: 266
Figure 10: Flowcytometry results of Cad11 (16.a.c.5) testing with secondary antibody (GaM-PE). First row shows the results with only conjugated Cad11-FITC, second row shows staining with Cad11-FITC and GaM-PE, third row shows staining with unconjugated Cad11, with GaM-PE. Left column shows FITC expression, right column shows PE expression. Mean is noted underneath every graph. Voltages were kept constant over all tests.
Anti-Cad11 (16G5)
PC3αN cat 5.2 (Cad11 negative) PC3αN cat 92.1F (Cad11 positive)
1µg/ml
Mean: 137 Mean: 224
2µg/ml
[image:22.612.85.521.125.724.2]4µg/ml
Mean: 129 Mean: 222
[image:23.612.88.520.72.357.2]3.3
Vimentin and Cadherin 11 tests on blood
To determine if either of the antibodies would bind a-specifically to the WBCs, two tests were performed on blood; one Vimentin titration and one test of Cad11 from Biolegend.
For the Vimentin tests, cells were stained with Hoechst, Vimentin, and CD45-PerCP. However, the concentration of the last, which was 1µg/ml, was too low to make this antibody detectable. It is visible in the flowcytometry results shown in figure 12 that Vimentin did not stain all cells that were stained with Hoechst. In panel Bthe cells are stained with Hoechst (blue), and three populations can be distinguished (bottom left, top middle, and right). The population on the bottom left is a combination of lymphocytes and monocytes. The population on the top, going almost horizontally, are the granulocytes. The last population, on the right, shows the cancer cells spiked in the blood. Panel C shows only the cells that are stained with Vimentin, it shows only the PC3 cells that were spiked in blood, the other two populations are not present.
A B
C
Figure 12: Microscopic and flowcytometry results from spiked blood staining with Hoechst 33342 (Blue, 4µg/ml) and Vimentin (Green, 2µg/ml), cell line used for spiking was PC3. Microscopic image (panel A) was taken using 100x magnification (10x 0.3NA Nikon). Panel B shows all cells that were stained with Hoechst. Panel C shows all cells that were stained with Hoechst and Vimentin.
[image:24.612.89.508.265.515.2]A B
[image:25.612.87.523.71.334.2]C
Figure 13: Microscopic (A) and flowcytometer (B,C) results from spiked blood staining with Hoechst 33342 (Blue, 4µg/ml) and Cad11, with GaM-PE (Yellow, 5µg/ml), cell line used for spiking was PC3-92.1. Microscopic image was taken using 400x magnification (40x 0.6NA Nikon). Panel A shows PC3-92.1 cells (large arrow) and WBCs (small arrow) stained with GaM-PE. Panel B corresponds with this image. Panel C shows PC3-92.1 cells stained with only the secondary antibody, GaM-PE.
3.4
Expression of EMT markers in cell lines
In Table 3, all the results of this research are summarised. The vimentin Expression strongly corresponds with the EpCAM expression, as when one is positive, the other is negative. The colour green indicates that the results of the test corresponded with literature. The colour red indicates that this was not the case.
Table 3: The expression of proteins according to literature, and the results found in this research. Green indicates that the result is as was expected. Red indicates that the results differed from literature.
Epithelial phenotype Mesenchymal phenotype EpCAM Cytokeratins Vimentin Cadherin 11
PC LNCaP + + - - -
PC3 - + - ++ +
NSCLC NCI-H1650 + + + - ?
NCI-H1563 - + - + ?
BC MCF7 + + - - -
MDA-MB-231 - + ++ ++ ++
[image:25.612.87.525.528.642.2]4.
Discussion
The goal of this research was to optimise immunostaining and characterize EpCAM positive and negative cell lines on the presence of epithelial and mesenchymal antigens to determine their EMT status. This was done by comparing the expression of epithelial antigens (EpCAM, Cytokeratins) and a mesenchymal antigen (Vimentin).
The intention was to use Cadherin-11 as a mesenchymal antibody, next to Vimentin. An unconjugated version of Cad11, donated to the lab by a research group in Nijmegen, was chosen for this purpose. The antibody was conjugated to FITC in the MCBP lab, and was used in a titration on PC3-5.2 and PC3-92.1. However, during this test, no signal was detected. A possible explanation could be that the FITC had bound to the active sites of the antibody, making it unable to bind to the antigens. Another possible cause of the problem might be that the PC3 cell lines had mutated and lost their Cad11 expression. Both hypotheses were tested by comparing the unconjugated and conjugated Cad11 in combination with GaM-PE, and by using MDA-MB-231 next to PC3-5.2 and PC3-92.1. MDA-MB-231 was chosen because of its high Cad11 expression found in literature. Unfortunately, this test still showed no clear difference in signal between the negative and positive samples. This led to the conclusion that the antibody itself must be malfunctioning.
Therefore, a new, unconjugated clone of anti-Cadherin 11 was purchased. This clone was tested on both GMO PC3 cell lines, using GaM-PE as a secondary antibody. In this titration, some difference between the negative controls and positive controls was found, as could be seen in figure 11, and it was decided to continue with a concentration of 5µg/ml for spiking in blood.
From the testing of Cad11 with GaM-PE on spiked blood, it became clear that GaM-PE not only bound a-specifically, it also bound directly to both the PC3-92.1 cells, and the granulocytes in the blood. This led to the conclusion that the GaM-PE antibody from SantraCruzBiotech was malfunctioning, and no further conclusions on the Cad11 antibodies could be drawn from this test or the titrations done previously with GaM-PE.
Table 3 shows the results of the tests with Vimentin and CKs, with respect to literature. In most cases, the test results corresponded with the found literature. The only cases in which literature and test were not similar, was with the testing of PC3 and LNCaP with CKs and with NCI-H1650 with Vimentin. In the case of the latter, expression should have been positive but was found to be negative. The reason for this difference is unclear, as it could be caused by factors such as the number of transfers of the cell line, or mutations in the cell line itself. This can only be determined by repeating the test. In the case of PC3 and LNCaP with CKs, the microscopic image and flowcytometry results seemed contradicting. For PC3, the flowcytometer results are very minor, but using the microscope the CKs are clearly visible. For LNCaP, this is the other way around. This difference could be caused by the cells, as the cells that were used were not completely fresh, and the microscopic images were taken on the day of the test, while the samples were analysed in the flowcytometer three days later. It could be also that the microscope shows unspecific binding which decreased over the days after, or that the antibody solution had expired.
5.
Conclusion
The goal of this research was firstly to optimise immunostaining, and secondly to characterize the status in the process of EMT for EpCAM positive and negative cell lines. This was done based on the presence of epithelial and mesenchymal antigens. These would indicate the relation between the epithelial and mesenchymal phenotype, which would show the role that EMT and MET can play in the detection of CTCs.
6.
Recommendations
Firstly, for continuation of the tests with Cad11, it is advisable to test the antibody with a secondary antibody on PC3-92.1, PC3-5.2, and MB-231. Of these cell lines, both PC3-92.1 and MDA-MB-231 should have a high Cad11 expression, whereas PC3-5.2 should have a low expression. In this test one could check if the problem of low signal lies indeed in the faulty GaM-PE used in this research, in both clones of the Cad11 antibody, or in the modified PC3 cell lines. From this point on, one could continue to either conjugate the Cad11 antibody and test its functioning directly, or continue testing with a secondary antibody. If from these tests it turns out that one of the two Cad11 antibodies functions well, a titration could be done, followed by a test on blood. If this test then again yields positive results, meaning that the Cad11 does not bind to the WBCs, one could continue with testing the antibody on different cell lines to see if there is a correlation between the expression of Cad11, Vimentin, and EpCAM.
Furthermore, one might opt to redo the tests done in this research. Since all tests were only done once, factors such as transfer number, expiration of the antibody solution, or human error could have affected the outcome of this research.
Additionally, in this research the focus lied on prostate, lung, and breast cancer cell lines. To broaden the scope of this research, cell lines from colon cancer could be added. Colo-320 (with an EpCAM density of 5/µm2) and SW480 (with a density of 6075 EpCAM/µm2) would be a good starting point.
7.
References
[1] W. c. r. fund, "Worldwide data," 2015. [Online]. Available: http://www.wcrf.org/int/cancer-facts-figures/worldwide-data.
[2] K. Pienta, Understanding cancer metastasis, Coursera online courses, Johns Hopkins school of medicine, 2017.
[3] K. Pienta, Introduction to the Biology of Cancer, Coursera online courses, Johns Hopkins school of medicine , 2017.
[4] A. Satelli, A. Mitra, Z. Brownlee, X. Xia, S. Bellister, M. J. Overman, S. Kopetz, L. M. Ellis, Q. H. Meng and S. Li, "Epithelial--mesenchymal transitioned circulating tumor cells capture for detecting tumor progression," Clinical Cancer Research, pp. 899--906, 2015.
[5] P. Paterlini-Brechot and N. L. Benali, "Circulating tumor cells (CTC) detection: clinical impact and future directions," Cancer letters, pp. 180--204, 2007.
[6] B. Rack, C. Schindlbeck, U. Andergassen, A. Schneeweiss, T. Zwingers, W. Lichtenegger, M. Beckmann, H. Sommer, K. Pantel and W. Janni, "Use of circulating tumor cells (CTC) in peripheral blood of breast cancer patients before and after adjuvant chemotherapy to predict risk for relapse: The SUCCESS trial.," Journal of Clinical Oncology, pp. 1003--1003, 2010.
[7] S. A. Joosse, T. M. Gorges and K. Pantel, "Biology, detection, and clinical implications of circulating tumor cells," EMBO molecular medicine, pp. 1--11, 2015.
[8] J. F. Swennenhuis, G. van Dalum, L. L. Zeune and L. W. M. M. Terstappen, Improving the CellSearch system., Taylor & Francis, 2016.
[9] G. H. Reference, "EPCAM gene," February 2017. [Online]. Available: https://ghr.nlm.nih.gov/gene/EPCAM#.
[10] D. Miyamoto, L. Sequist and R. Lee., "Circulating tumour cells-monitoring treatment response in prostate cancer," Nature Reviews Clinical Oncology, pp. 401-412, 2014.
[11] NCBI, "Cadherin 11," February 2017. [Online]. Available: https://www.ncbi.nlm.nih.gov/gene?Db=gene&Cmd=ShowDetailView&TermToSearch=1009. [12] K. Chu, C.-J. Cheng, X. Ye, Y.-C. Lee, A. J. Zurita, D.-T. Chen, L.-Y. Yu-Lee, S. Zhang, E. T. Yeh,
M. C. Hu and others, "Cadherin-11 promotes the metastasis of prostate cancer cells to bone," Molecular
Cancer Research, pp. 1259--1267, 2008.
[13] R. L. Bitting, R. Boominathan, C. Rao, G. Kemeny, B. Foulk, M. A. Garcia-Blanco, M. Connelly and A. J. Armstrong, "Development of a method to isolate circulating tumor cells using mesenchymal-based capture," Methods, pp. 129--136, 2013.
[14] I. Kii, N. Amizuka, J. Shimomura, Y. Saga and A. Kudo, "Cell-Cell Interaction Mediated by Cadherin-11 Directly Regulates the Differentiation of Mesenchymal Cells Into the Cells of the Osteo-Lineage and the Chondro-Lineage," Journal of Bone and Mineral Research, pp. 1840--1849, 2004.
[15] M. J. Pishvaian, C. M. Feltes, P. Thompson, M. J. Bussemakers, J. A. Schalken and S. W. Byers, "Cadherin-11 is expressed in invasive breast cancer cell lines," Cancer research, pp. 947--952, 1999. [16] C.-F. Huang, C. Lira, K. and Chu, M. A. Bilen, Y.-C. Lee, X. Ye, S. M. Kim, A. Ortiz, F.-L. L. Wu, C. J. Logothetis and others, "Cadherin-11 increases migration and invasion of prostate cancer cells and enhances their interaction with osteoblasts," Cancer research, pp. 4580-4589, 2010.
[17] G. M. Cooper, The Cell: A Molecular Approach. 2nd edition., Boston University, 2000.
[18] Uniprot, "UniProtKB - P08670 (VIME_HUMAN)," April 2017. [Online]. Available: http://www.uniprot.org/uniprot/P08670.
[19] M. G. Mendez, S.-I. Kojima and R. D. Goldman, "Vimentin induces changes in cell shape, motility, and adhesion during the epithelial to mesenchymal transition," The FASEB Journal, pp. 1838--1851, 2010.
[22] DSMZ, "LnCAP ACC-256," 2017. [Online]. Available: https://www.dsmz.de/catalogues/details/culture/ACC-256.html.
[23] M. c. b.-p. lab, "available tables and figures," 2017. [Online].
[24] E. Sherwood, L. Berg, N. Mitchell, J. McNeal, J. Kozlowski and C. Lee, "Differential cytokeratin expression in normal, hyperplastic and malignant epithelial cells from human prostate.," The Journal
of Urology, pp. 167-171, 1990.
[25] D. M. Lee, H. P. Kiener, S. K. Agarwal, E. H. Noss, G. F. Watts, O. Chisaka, M. Takeichi and M. B. Brenner, "Cadherin-11 in synovial lining formation and pathology in arthritis," Science, pp. 1006-1010, 2007.
[26] M. J. Coelho, L. terstappen, A. barrads and S. d. Wit, "Cytokeratin immunostaining of different cancer cell lines to optimize circulating tumor cells detection," Universtiy of Twente, 2003.
[27] M. Xie, C.-S. He, S.-H. Wei and L. Zhang, "Notch-1 contributes to epidermal growth factor receptor tyrosine kinase inhibitor acquired resistance in non-small cell lung cancer in vitro and in vivo,"
European Journal of Cancer, pp. 3559--3572, 2013.
[28] D. B. Ulanet, K. Couto, A. Jha, S. Choe, A. Wang, H.-K. Woo, M. Steadman, B. DeLaBarre, S. Gross, E. Driggers and others, "Mesenchymal phenotype predisposes lung cancer cells to impaired proliferation and redox stress in response to glutaminase inhibition," PLoS one, p. e115144, 2014. [29] S. A. Joosse, J. Hannemann, J. Spotter, A. Bauche, A. Andreas, V. Muller and K. Pantel, "Changes in
keratin expression during metastatic progression of breast cancer: impact on the detection of circulating tumor cells," Clinical Cancer Research, pp. 993-1003, 2012.
[30] Abcam, "Epithelial-Mesenchymal Transition (Beta Catenin, Vimentin) Western Blot Cocktail (ab157392)," 2017. [Online]. Available: http://www.abcam.com/epithelial-mesenchymal-transition-beta-catenin-vimentin-western-blot-cocktail-ab157392.html#description_images_2.
[31] Sigma, "PC3 cell line human," April 2017. [Online]. Available: http://www.sigmaaldrich.com/catalog/product/sigma/90112714?lang=en®ion=NL.
[32] P. J. Russell and E. A. Kingsley, "Human prostate cancer cell lines," Prostate Cancer Methods and
Protocols, pp. 21-39, 2003.
[33] Semrock, "Ffilters for flow cytometry,," May 2017. [Online]. Available: https://www.semrock.com/flow-cytometry.aspx.
[34] I. b.-i. analysis. [Online]. Available: http://icy.bioimageanalysis.org/.
8.
Appendix
8.1
Appendix a: Cell culture protocol
Withdraw medium from the T flask with a 1 ml pipette (vacuum pump).
Wash the cell layer thoroughly with 5ml or 15ml pre-warmed PBS
o Withdraw PBS from the T flask with a 1 ml pipette (vacuum pump).
Add trypsin solution to the culture vessel (1ml for T25 or 3ml for T75)
o Incubate the cells with the trypsin at 37°C for 3 - 10 minutes until cells have detached.
Add serum-containing medium to inactivate the trypsin.
o Disperse the cells by repeated pipetting over the culture vessel surface.
o Cell clumps can be reduced by pipetting onto the bottom of the T-flask. Try to avoid frothing (bubble formation) as this might disrupt the cells.
Transfer the single cell suspension to a sterile tube
Pipet 12µl of cell suspension into Lunar cell counter counting chamber
o Calculate the amount of cell suspension that is needed in order to seed a new T-flask
o For example 2T75’s with 5000 cells/cm 2 , cell suspension 1.3x10 6 cells/ml
Add fresh medium to the new T-flask (5ml for T25, 15ml for T75), then add the calculated amount of cells suspension.
Write name, date and cell type and passage number (and experimental treatment) on the flask. Use the designated area on the side of the flask, so cultures can be easily and quickly identified to avoid long opening of incubator doors (and resulting CO2 and temperature drop).
For fixation in cell culture lab:
Centrifuge the cells in the tube (e.g. 300 rpm for 4 minutes at room temperature)
Withdraw the medium, do not disturb the pellet.
Resuspend the pellet in 1ml 1%formaldehyde in PBS
Incubate 10 minutes at RT
Centrifuge for 5 minutes with 500 xg
Aspirate the supernatant using vacuum pump
Add PBS1x/BSA1% to starting volume
8.2
Appendix b: Red blood cell lysis protocol
Reagents:
Lysis solution: 155mM ammoniumchloride, 10mM kaliumcarbonate, 0,1mM Na2EDTA, pH 7,25
PBS AC: 1x PBS with 13,3mM Trisodiumcitrate and 0,5% Bovine serum albumin(BSA)
EDTA and CSB blood
Protocol lysing RBCs:
Dilute the blood 20x with the lysis solution. Note the starting volume.
Incubate for 20 minutes on ice.
Centrifuge for 5 minutes with 300 xg
Aspirate the supernatant
Resuspend with PBS-AC solution in twice the original volume
Centrifuge for 5 minutes with 300 xg
Aspirate the supernatant
Add PBS-AC in the starting volume
Centrifuge for 5 minutes with 300 xg
Aspirate the supernatant
Add PBS1x/BSA1% to starting volume
8.3
Appendix c: Cell staining protocol
Materials:
Hoechst 33342 diluted in MQ (1mg/ml)
Antibodies
Method:
Spin down for 5 minutes, 500xg and aspirate supernatant
Fixation of cells
o Resuspend cell pellet in 1% formaldehyde 1ml
o Incubate for 10 minutes at room temperature
o Spin down for 5 minutes at 500xg andaspirate supernatant
Add 4ml PBS 1x/BSA 1%
Divide samples (250.000-500.000 cells per sample)
Spin down for 5 minutes, 500xg and aspirate supernatant
Permeabilization of cells
o Resuspend cell pellet in 250µl PBS/saponin 0.05%
o Incubate for 10 minutes at room temperature
o Spin down for 5 minutes at 500xg andaspirate supernatant
Add PBS 1x/BSA 1% (/ saponin 0.05%) + staining reagents to a total volume of 100µl
Incubate for 10 minutes at RT
Spin down for 5 minutes, 500xg and aspirate supernatant
Adding secondary antibody
o Resuspend cell pellet in 100µl PBS1x/BSA1%
o Incubate 10 minutes at RT
o Spin down for 5 minutes, 500xg and aspirate supernatant
o Add PBS 1x/BSA 1% (/ saponin 0.05%) + secondary antibody to a total volume of 100µl
o Incubate for 10 minutes at RT
o Spin down for 5 minutes, 500xg and aspirate supernatant
Add 500 µl PBS 1x /BSA 1% and Hoechst to an end concentration of 4µg/ml
Incubate for 10 minutes at room temperature
Store at 4 degrees Celsius
For flowcytometry: take 300 µl of the stained cell suspension and if needed add 200 µl PBS/BSA 1%, shortly vortex directly before use at a low speed.
o Clean FACS and check calibration
o Take negative control at low flow rate 1 and set lasers so that all negative signal (=background) is below 102 or any reasonable point far enough and distinguishable
from positive samples.
8.4
Appendix d: Antibody conjugation protocol
Materials:
Unconjugated antibody (4°C)
Anhydrous DMSO
Zebar spin desalting columns, 2ml (200-700µl samples)
Fluorochrome
Sodium bicarbonate buffer (0.1M, pH 8.4) (210mg NaHCO3 in 250ml MilliQ)
Collection tubes
Storage buffer (PBS/BSA1% filtered with 0.02% sodium azide
PBS
Method:
Preperation of Zebar column for antibody rebuffering
o Twist bottom and loosen cap of the column and place in collection tube
o Mark one side
o Centrifure at 1000xg for 2 minutes, discard solution
o Add 1ml sodium bicarbonate buffer, centrifuge, discard solution
Repeat 3x
Preperation of antibody
o Place Zebar column in new collection tube
o Pipette 500µl of antibody on column
o Centrifuge, collect sample
Covalent conjugation
o Prepare a 20mM stock solution of fluorochrome in anhydrous DMSO
o Add 20-fold molar excess of fluorochrome-DMSO per ml of antibody in an Eppendorf tube
o Suspend, vortex, wrap in aluminium foil
o Incubate 2 hours at 4°C
Preperation of Zebar column for removing unreacted fluorochrome
o Twist bottom and loosen cap of the column and place in collection tube
o Mark one side
o Centrifure at 1000xg for 2 minutes, discard solution
o Add 1ml sodium bicarbonate buffer, centrifuge, discard solution
Repeat 3x
Rebuffering and storage
o Place Zebar column in new collection tube
o Pipette conjugated antibody on column
o Centrifuge, collect sample
![Figure 1: The process of EMT visualised [7]. Both epithelial and mesenchymal cells can leave the primary tumour site and travel to a distant site](https://thumb-us.123doks.com/thumbv2/123dok_us/9736113.474467/7.612.125.485.499.639/figure-process-visualised-epithelial-mesenchymal-primary-tumour-distant.webp)

![Figure 4: The transition from epithelial to mesenchymal phenotype visualized. Epithelial markers, such as EpCAM and CKs are lost, while mesenchymal markers, such as Vimentin and Cad11 are gained during the transition [10]](https://thumb-us.123doks.com/thumbv2/123dok_us/9736113.474467/9.612.115.501.205.334/transition-epithelial-mesenchymal-phenotype-visualized-epithelial-mesenchymal-transition.webp)


![Figure 7: The working of the flowcytometer. Light is scattered by the events in the droplets, and is detected in different detectors [33]](https://thumb-us.123doks.com/thumbv2/123dok_us/9736113.474467/16.612.230.382.422.588/figure-working-flowcytometer-scattered-droplets-detected-different-detectors.webp)