1 | P a g e
Faculty of Behavioral Management and Social
Sciences
An introduction of Lean manufacturing in
the poultry processing industry
Joep de Smet
B.Sc. Thesis
March 2018
2 | P a g e
Abstract
This report discusses a research that is done at Company X, one of the biggest manufacturers of poultry processing lines. The research is part of the study program from the bachelor study Industrial Engineering and Management (IEM), followed at the University of Twente.
Company X is interested to discover how they can contribute to their clients’ manufacturing systems by developing tools, processes and providing advice. Therefore there is significant interest to
understand their clients manufacturing systems on how the system is adjusted and with what goals in mind, and how and where weaknesses could be identified. With these interests, the main research question is:
What weaknesses in the current manufacturing systems can be identified and how can and should they be addressed?
To answer this question, the research performs a case study. Furthermore, it uses a Lean
manufacturing approach which is a management philosophy that aims to optimize manufacturing systems and commonly known as just ‘Lean’, to guide the identification of customer values and to understand how they are expressed throughout the manufacturing system.
First, the current manufacturing system is visualized in a process model. Simultaneously, the customer values are identified by the study of literature, making observations and consulting experts. A list of Key Performance Indicators (KPIs) for processes and process areas (a group of strongly related processes) are identified that support the evaluation of customer values. The KPIs are categorized according to a Quality, Delivery and Costs (QDC) approach and the effect of practical measures on those KPIs are then studied.
The second step is to identify weaknesses in the manufacturing system. For several reasons the scope is narrowed down to the fillet department. Here, the breast caps are processed into products such as fillets, medallions and schnitzels. With Lean Thinking (techniques that are used in Lean manufacturing) the weaknesses are identified by first identifying so called ‘wastes’ in every process area. The root causes of such wastes are considered the weaknesses in a manufacturing system. Prioritizing the biggest wastes and thereby addressing their root causes is one of the reasons why in particular a Lean manufacturing approach was used, since it identifies system wide bottlenecks and eliminates non-value adding activities. This is in contrast with Company X’s traditional approach to optimize the manufacturing system where the value adding activities of individual process is optimized one by one.
The major methodology that is used to identify wastes and their root causes is observing. For two days, the fillet department is observed and wastes are identified and valued as accurate as possible by recording data during these visits. The research prioritizes the six biggest wastes:
1. Frequent and long waiting times for fillet harvesters. 2. Use of buffers by the tenderloin harvesters.
3. Over processing as a result of unnecessary inspection for weight defects of trays. 4. Extremely poor capacity utilization of the trimming lines.
5. The motion and inventory wasted to fix defects from the robobatcher (batching machine). 6. The waste of motion and activities to empty red and blue crates.
3 | P a g e
significantly by 1 to 2% at the fillet harvesting process and the capacity utilization of this and several surrounding processes can be increased by an estimated 30%.
Other benefits and practices of using Lean Thinking are also discussed. For instance, improving the forecasting of order quantities and eliminating the wastes involved in creating, storing and using 60 to 70 tons of routine inventories.
4 | P a g e
Table of Contents
Abstract ... 2
1. Introduction ... 6
1.1 The company ... 6
1.2 Research motivation and problem context ... 6
1.3 Problem identification ... 6
1.4 Research scope and relevance ... 7
1.5 Research approach ... 8
1.6 Research questions and methodologies ... 8
1.7 Validity, reliability and limitations ... 10
1.8 Deliverables ... 10
1.9 Outline thesis ... 11
2. Current manufacturing system... 12
2.1 The manufacturing plant and industry ... 12
2.2 The production process ... 12
2.3 Planning and Control ... 18
3. Theoretical background ... 21
3.1 Definition and context ... 21
3.2 Lean Thinking context ... 21
3.3 Planning, scheduling and control ... 25
4. Identify customer value ... 26
4.1 Strategic goals ... 27
4.2 Operational goals ... 30
4.3 Customer value with QDC ... 34
4.4 Chapter conclusion ... 38
5. Identify and visualize value streams and eliminate waste ... 39
5.1 Value Stream Map ... 39
5.2 Identifying waste ... 42
5.3 Prioritizing and eliminating waste ... 45
5.4 The manufacturing system and Lean ... 55
5.5 Chapter conclusion ... 58
6. Conclusion and recommendations ... 60
6.1 Conclusion ... 60
5 | P a g e
6.3 Discussion ... 62
References ... 63
Appendixes ... 64
Appendix A. Legend for BPM, flow charts & VSM ... 64
Appendix B. Customer value QDC tables ... 68
Appendix C: KPIs and customer value relations schemes ... 72
Appendix D: Measures, KPIs and variables relations ... 76
Appendix E. Clarification of KPIs, measures, variables and relations... 88
Appendix F. Overview of decisions in secondary process with flow charts ... 103
6 | P a g e
1. Introduction
This chapter discusses the motivation behind the research and the problem identification (Sections 1.1 - 1.3). Subsequently the others sections discuss the scope and academic relevance (Section 1.4), the research approach (Section 1.5), the questions and methodology (1.6), the limitations, validity, reliability and limitations (Section 1.7), the deliverables (Section 1.8), and the outline of the report (Section 1.9).
1.1 The company
This bachelor report is made for Company X that is one of the biggest manufacturers of processing lines for poultry industry. Aside from the production of high-end production lines, they are known for their contributions to the industries by developing software, lending expertise and other specialized services. The further development and optimization of these lines are dependent on the expertise gained by research. Focusing on the benefits gained by increasing the control, flexibility and capacity of the processing lines, Company X can stay ahead of competitors by continuously innovate (MSPP, 2010).
1.2 Research motivation and problem context
This research is part of a PhD project aimed to optimize several practices and processes within a poultry manufacturing plant. The project started with optimizing graders (sorting machines for products) by optimizing their sorting algorithms. Then the project’s scope expanded to surrounding processes and practices. One topic that arose is called ‘order scheduling’:
The process of deciding what broilers (e.g., chickens) and products must be processed or produced when, in which process and for which order.
The decisions made in order scheduling are based on the current situation (e.g., the order
progression and flock properties), certain requirements, practical limitations, rules-of-thumbs, and the desired outcome. Order scheduling is a very broad decision-process; it is related with the whole manufacturing system. Company X aspired for optimizing and automating this process by developing tools, software and providing directed advice.
In particularly the secondary process (the processing of ready-made broilers into end products) is of interests to Company X since it is a complex, un-optimized and only partly automated process. More specifically, the fillet lines (a process area within the secondary process where breast caps are processed into end products) are the scope of the PhD’s project that is collaborated with. According to Company X, most of the profit is lost within these lines. Therefore, Company X is focused on this process area and so is the focus of the research.
1.3 Problem identification
One cannot design a service or product (e.g., a tool), when it is unknown what has to be designed. It is also important to identify the weaknesses of processes and process areas that require
7 | P a g e
created and wasted in a process or process area? How should a process or process area be addressed (optimized, automated, etc.)?
In consultation with Company X, some other problems are identified. First of all, the desires of Company X to advice clients on their Planning and Control strategy is impossible when operational and strategic goals are unclear. Advising on Planning and Control strategy is important, since it is common that the decisions made on operational level are focused on efficiency performance
measures (operational goals), such as production costs. On strategic level, the aim is to score high on effectiveness performance measures (strategic goals), such as order fulfillment and product quality. According to Goldratt (2004), effectiveness goals must always receive priority over efficiency goals. Decisions on operational level may be the best short-term decisions, but not optimal on the long-term. In order to give advice on this topic, a rough understanding of the current Planning and Control strategy of clients is required, for instance when (events happening) and how (measures that are/can be taken) the planning is adjusted.
Company X thinks to understand what outcome (operational and strategic goals) their clients desire and try to achieve, while their clients aim prioritize other goals. For instance, Company X may expect that performing well on capacity utilization is more important to a client than their product quality while this may be the other way around. Such misconceptions lead to poor advice and wrongly designed tools. Thus, understanding the strategic and operational goals of Company X’s clients may increase the quality of advice and the design of tools.
Another issue is the theoretical basis on which Company X operates and the practical basis on which their clients operate. Most of Company X’s employees seldom visit manufacturing plants and see their products operating in practice, this is in contrast to their clients who experience every practical implication of Company X’s products and services. This theory-practice gap is important in designing a tool or giving advice. The limitations, assumptions and scope that are considered in the design of a theoretical model contribute to their practical inapplicability (King, 1976). By closing this gap by understanding the as-is situation of the manufacturing Planning and Control, the Company X’s advice and tools become more applicable to practice.
The problem identification with its interested and problems is summarized as: Company X is willing to develop tools and give advice but this is impossible because:
1. They do not understand the organizational and strategic goals of their clients. 2. Therefore, they also do not understand the current Planning and Control strategy. 3. They do not understand what process (areas) should be optimized, and which process
(areas) should be prioritized.
4. The theoretical background of Company X and its gap with the practice is an obstacle to design proper advice and tools for their clients.
The main research question is therefore:
What weaknesses in the current manufacturing systems can be identified and how can and should they be addressed?
1.4 Research scope and relevance
straight-8 | P a g e
forward process that is well optimized with tools such as Overall Equipment Effectiveness (OEE). Most problems and bottlenecks are according to Company X located in the fillet department, as well as most product value is both added and lost in this department. This is because product family of the fillet department consist of fillets that are the most valuable products. In addition, the fillet department requires most machine maintenance, labor and is known to be a bottleneck due to its low and difficult managed capacity. Figure 1.1 gives a simplistic overview of the production process and shows how the scope narrows from the whole production process (see area 1 in the figure) to the secondary process (2) and finally to the fillet department only (3).
Figure 1.1 The narrowing down of the scope throughout the research.
The research is relevant for Company X since it may give new insights in and better understanding of the strategy of clients’ manufacturing Planning and Control. In addition, the research findings facilitate the development of tools and constructive advice for clients by giving a better
understanding of the weaknesses within the manufacturing system and how they should and can be addressed.
The research is based on a case study; one client of Company X is studied. The research can be used as a framework in studying other clients. A case study reflects the reality well and thereby
contributes to further close the gap between Company X’s theoretical origin and their clients practical origin.
1.5 Research approach
This research uses an Industrial Engineering and Management approach for problem-solving from the book ‘Geen Probleem’ written by Hans Heerkens (2012). For more elaboration on this approach the book can be consulted. It is important to understand that the last two steps (‘Implementation’ and ‘Evaluation’) lay outside the research scope due to the time limit.
1.6 Research questions and methodologies
The main research question is:
What weaknesses in the current manufacturing systems can be identified and how can and should they be addressed?
In order to identify and address weaknesses in the manufacturing system, a clear understanding of the system is gained. Both understanding the production processes and how these are adjusted by Planning and Control is important. Therefore, the first research question is:
9 | P a g e
In the research a theoretical framework is used to systematically answer the main research question. This framework is called Lean manufacturing (most of the time just called ‘Lean’) which is a
systematic management approach that identifies value streams and waste within a manufacturing system. The research questions take into account the steps that are commonly taken in applying Lean manufacturing to a manufacturing system. Therefore, the next paragraphs roughly explain these steps.
The first step in the Lean Thinking (which is the method of implementing Lean manufacturing to an existing system by taking specific steps) is to identify the customer values. Commonly, three categories of customer values are used to analyze how a process or process area is performing. These are Quality, Delivery and Costs (QDC). Operational and strategic goals fit within one of these categories. For some clients it is necessary to add other categories, like ‘Morale’ and ‘Safety’. If there is a need for this it is determined during the research.
The benefits of this management approach are used to break down a whole production process into smaller ones to support decision-making. More benefits of this approach are to prevent the feeling of being overwhelmed by providing a systematic approach, to facilitate the prioritization of goals (Imai, Masaaki, 1997) and add customer value to the manufacturing system by eliminating system wide bottlenecks. To execute this first step of Lean Thinking the following research question is:
2. How are the customer values expressed throughout the manufacturing system? 2.1 What are the strategic and operational goals of the customer?
2.2 What Key Performance Indicators can be found within the process areas? 2.3 What Key Performance Indicators are used by Planning and Control? 2.4 How are customer values added by the manufacturing system?
To answer this research question, several methodologies are used: making observations by visiting the plant, studying plant layouts, machine manuals and other information on the topic, and by speaking to experts in the field.
For the second research question, the scope is the fillet department because of the limited time-span. However, the first research question covers the whole manufacturing system with the purpose to understand the context and to support the process of identifying waste, problems and their roots. In the second step of Lean Thinking the value streams and wastes are identified by the creation of a Value Stream Map. This is done with extensively observing processes on the shop floor. Chapter 3 elaborates Lean Thinking in more detail.
3. What are the value streams and where can waste be eliminated?
The goal of step two is to eliminate waste. Waste is prioritized by analyzing the added customer value that is created if it would be eliminated. After prioritizing a selective group of waste, the root cause for the problem that creates the waste is identified. Recommendations are given for
addressing these root problems. By doing this, a more continuous production flow is created within the manufacturing system. Thus, the last two research questions are:
4. Which of the wastes should be eliminated first and why? 5. How can the wastes be eliminated?
10 | P a g e
1.7 Validity, reliability and limitations
The findings are mostly based on empirical evidence, such as observations and interviews. The validity of the findings are representative to this research; they are based on direct observations of the reality, expertise from employees and clients, and real up-to-date quantitative data.
Nevertheless, people are subjective and therefore biased. Risk for internal validity issues is
dangerous if the bias is found throughout the whole company. Thus, double checking the potential biased information with my own observations and other sources is important.
In addition to a person who can be biased, the information gathered from conversations with experts may also be biased by time. For instance, if there is an issue on the shop floor that occurred
frequently on a day, an employee might emphasize this issue more than other issues that have been occurring on a daily basis for already years. In addition to this, a person can be biased by its own believes. A planner is not always confronted with the consequences of his work and he/she ought to believe his/her work does not cause issues or contains weaknesses.
The findings in a case study are limited in their reliability if they are applied to other cases. However, in this research the chosen sample is a good representative of a typical high-end poultry processor. Typical characteristics of such a unit are:
- Retail focused poultry processing plant, not bulk.
- High-end production lines. The studied client has a production capacity of roughly 12.500 broilers per hour.
- Typical Western plant layout.
Nonetheless, every poultry processor has its own unique production layout, strategic and operational goals, etcetera. For Company X and the researched client (case), the findings are applicable.
The research is mostly limited by time affecting the depth that can be brought into the research. Especially since the field is new to the researcher.
The research relevance is limited to Company X and its retail client. Furthermore, the research field is very specific. It is difficult to generalize the findings, since it is unknown how strong the unique characteristics of the case influence the results.
1.8 Deliverables
As a result of the previous sections, the research deliverables are clarified. The research should deliver the following:
Step 1 of Lean Thinking: identifying clients’ interests/value:
- An analysis of the as-is situation in order to identify the process structure and rough planning.
- An identification of the operational and strategic goals, resulting in a list of KPIs sorted with the help of the three categories used in Lean Thinking: Quality, Delivery, Costs.
- An analysis of how these KPIs are expressed throughout the system, where tables and schemes facilitate the understanding of the relationships between KPIs and the effect of measures on KPIs.
Step 2 of Lean Thinking: identify and visualize value stream and eliminate waste - A Value Stream Map for the fillet department of the current state.
- An evaluation of the fillet department that includes measures, events and KPIs. - The identification of wastes within every process area.
11 | P a g e
- The identification of their root causes and recommendations on how Company X can contribute to eliminate the wastes.
1.9 Outline thesis
The outline for the upcoming chapters is as follows:
In Chapter 2 the answer to the first research question is given by discussing the current manufacturing system.
Chapter 3 provides theoretical background on Lean manufacturing, Lean Thinking and contains the theoretical framework that is used to guide the research.
Chapter 4 executes the 1st step of Lean Thinking by identifying
the clients’ interests/value.
Chapter 5 executes the 2nd step of Lean Thinking where wastes
are identified, prioritized and eliminated (by resolving the root causes).
Finally, Chapter 6 wraps up the research, providing a
conclusion, discussion, recommendations and suggestions for further research.
[image:11.595.366.547.170.456.2]
12 | P a g e
2. Current manufacturing system
This chapter gives answer to the first research question:
How does the current manufacturing system look like?
Section 2.1 introduces the manufacturing plant and industry. This section is followed by Section 2.2 that discusses the main production processes with the purpose to get a rough understanding of the manufacturing system. Section 2.3 covers the activities and current system of Planning and Control.
2.1 The manufacturing plant and industry
The poultry processing plant that is studied is one of the biggest poultry processing plants in Europe with a capacity of roughly 12,500 birds per hour of typically 2,600 gram each. An average production day is 16 hours; however it is normal to run overtimes. The plant is designed to process for the retail industry. This industry, in contrary to the bulk industry, produces over a hundred different end products. From fillets to seasoned grilled drumsticks, the plant is capable to produce nearly any poultry product. Furthermore, the retail industry is, by far, faster-paced than bulk. While industry (bulk) orders are known for days to weeks in advance, retail orders have to be forecasted and are only confirmed and must be shipped on the actual production day within a very short time-frame (commonly within 2 to 5 hours).
It is important to understand that the industry has a divergent process structure; from one bird, an endless number of end products are made (Figure 2.1 shows a fraction of
the possible end products). For the food industry this is common (Akkerman, 2009), but pick any other industry and it will most certainly have a convergent production process. Take for instance the automotive industry where hundreds of small parts are assembled into one end product; a car. In addition to the fact that the industry is dealing with fast perishable goods and extreme variable demand, this makes the correct Planning and Control extremely complex. For example, if a bird is processed in order to meet the demand of fillets while the demand of all the other products is already met, the rest of the bird that is processed will be considered as overproduction. This is why a retail plant also needs bulk customers, to sell excessive and poor quality products.
Figure 2.1 product diversity (MSPP, 2010)
2.2 The production process
To get a general understanding of the manufacturing system in order to understand how Lean manufacturing techniques can be used to optimize the system, we discuss both the production processes and the Planning and Control (how productions is planned, monitored and adjusted). A process model is designed in Archimate after a first visit to the customer’s plant, a presentation of the manufacturing system by an expert, the study of the plant layout and previous literature on the topic. Archimate is an enterprise architecture language that is normally used to study information-intensive processes. While this is true for the case, the purpose here was only to get clear
13 | P a g e
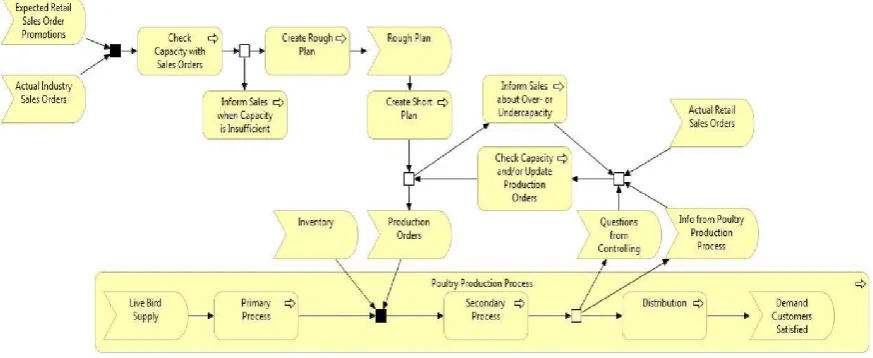
Figure 2.2 rough process model of processes and Planning and Control (Tummers, 2015)
A first process model (Figure 2.2) was previously made by Tummers (2015) who performed a Quick Scan (comprehensive investigation) of the client. The model reflects the core processes and the rough link to Planning and Control. In the process models, the arrows describe the flow of products or information. Furthermore, rounded arrow-shaped elements describe units (products or
information) that can be triggered (used) or created by process, or both. Subsequently, there are square shaped elements (containing a sharp arrow) that represent production processes. Products and information are combined in the black and outlined small rectangles. In black rectangles, no decision can be made and the path of the information and/or products is already determined. If there is different paths for different units or if the path of a unit can be decided, an outlined
rectangles is used. A more comprehensive description of the shapes to facilitate the understanding of this model and the upcoming models are given in Appendix A.
This process model was worked out in more detail and is split into several figures (Figures 2.3 to 2.5) for the sake of readability. It only covers the production processes, products and main events. The data model with information objects (e.g., attributes) and losses throughout the production processes are excluded. Also, a flow chart (appendix F) was made to give a good overview of what decisions can be made in the secondary process for broilers and intermediary products.
A description of the production processes from begin to end will be given next.
Live bird supply (Figure 2.3, far left)
To begin with, large trucks filled with numeral containers arrive at the plant throughout the day. Both the trucks and containers are weighted. After the containers are unloaded from the truck, the birds must rest from the trip for 2 to 3 hours to reduce stress. The amount of stress will negatively affect the tenderness of the meat, particularly this is bad for the quality of fillets. Depending on the urgency of a flock to be slaughtered, the length of the trip they had to endure and the kind of breed and quality of the flock, they may rest more or less.
14 | P a g e
Primary process (Figure 2.3, central area)
In the primary process birds are prepared until they are so called ‘ready-made’ or ‘panklaar’. The process is very straight-forward and consist of seven steps.
First, the birds are stunned. The birds are positioned on a production ray that enters a gas chamber consisting of several smaller chambers. From beginning to end, the chambers’ atmospheres changes, first consisting of mostly enriched oxygen and at the end consisting of mostly carbon dioxide. The birds lose consciousness and are clinically dead, meaning there is still a blood circulation and activity of breathing that sustains the bird’s organs. This stunning method is called Multi-staged Controlled Atmosphere System (CAS) and is considered as an animal friendly method.
After the birds are stunned, they are hanged upside down on shackles by hand. Dead Upon Arrivals (DOA’s) or birds with other significant quality issues are removed from the production process. At this stage, the birds are counted per flock and then send to the killing process.
In the killing process the birds can be killed with different cuts. Whenever a cut is unsuccessful, the bird is manually cut afterwards. Since the birds hang upside down, they bleed out through their neck for some minutes. Blood is a by-product and sold as bulk. After the bird is killed the blood circulation stops, this will start up chemical reactions that affect the quality of the meat and organs. Thus the faster the bird is processed, the better.
After the birds bled out, they enter the scalding process. Several baths of hot water will macerate and cLean the bird’s skin.
A well performing scalding process is important for the proper defeathering of the birds, which is the next process. The feathers, loosened by the scalding process, will be pulled out of the birds with rubber fingers. After the defeathering process, the birds undergo electro-stimulation (RapidRidgor). Here, electric pulses are applied to the body of the bird to remove any energy left in the muscles. This ensures the tenderness of the meat and speeds up the maturation process.
Next, the head and feet are removed and processed as waste or bulk (such as skin and paws). Then, the organs and other vescera are removed in the evisceration process as well as the neck and neck skin. Most of it is sold as bulk.
The last process step is chilling and maturation that takes around 2.5 hours. At the first stage the broilers are cooled down extremely fast to stop any growth of micro-organs. Then, the chilling process is slower to speed up the breakdown of protein. The broiler maturates, to improve the quality and shelf life. Monitoring the chilling process is very important, since the birds lose moisture that is equivalent to losing weight. To prevent moisture loss, the birds receive a thin film of water internally and externally.
15 | P a g e
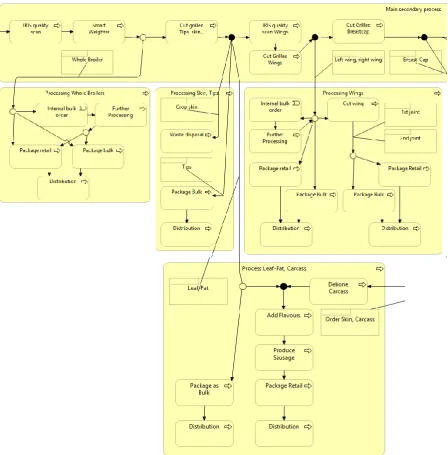
Secondary process (Figure 2.4)
The secondary process is very complex. A ‘ready to cook’ broiler from the primary process can be processed in endless ways. Therefore, we discuss the secondary process in low detail to keep it short and interesting.
First, the broilers are hanged over and divided between two main lines (one light and one heavy line). Next, the broilers are scanned on quality by an IRIS scanner and are weighted by a Smart weighter (see Figure 2.4, top left). From this point on, most of the information of every broiler is known and fairly accurate. Also the decoupling point is passed: the decision of how a broiler must be further processed is now demand-driven (thus dependent on the current orders).
After the broiler is weighted and scanned, it is decided whether the broiler must be processed as a whole broiler (see Figure 2.4, middle left area) or not. In this plant, whole broilers are not that common of an order with an exception during the Christmas period. If the broiler is not processed as a whole broiler, then the skin tips and leaf fat is removed and processed as bulk products. Crop skin around the neck is also removed but processed as waste. These processes are found in Figure 2.4 in the central and bottom area.
The broiler enters the wing department where the wings are scanned more accurate. Then, the wings are cut of in different ways (1st joint, 2nd joint or whole wings) or not at all, depending on the
orders and quality of the wings (Figure 2.4, middle right area). Like many other products, the wings can be send to Further Processing (FP), where it is grilled, marinated, seasoned, portioned or undergoes any other off-line processing step.
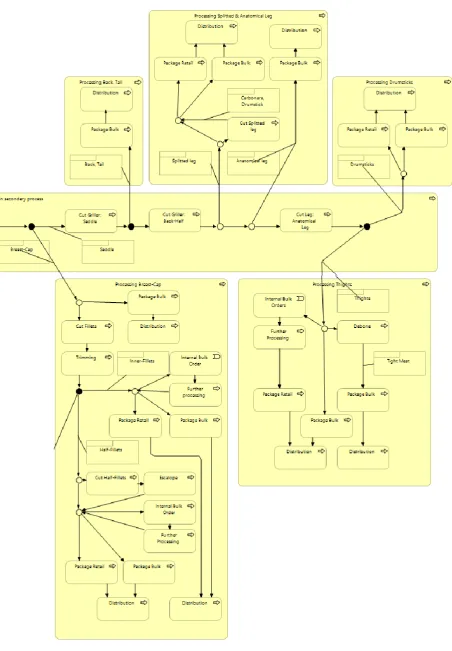
After the wing department the broiler is cut into two: a breast cap that is processed by the breast-cap department that consist of several fillet lines (See Figure 2.5, bottom left area). The saddle that stays on the line. The saddle is processed into legs (split leg or anatomical leg) or drumsticks tights (See Figure 2.5, top three areas).
At the fillet lines, fillets are harvested from the breast-cap, sometimes with or without tenderloin. Then deboned and trimmed, further processed with portioning or directly batched on trays. The trays are packaged, labeled and temporary stored before they can be shipped.
Products are tracked and traced with the information systems PDS-NT and Innova. PDS-NT focuses on recording data throughout the processes, while Innova translates it into usable information. Innova also supports the decision-making of Planning and Control and therefore the whole
manufacturing system. An example of the application of Innova is to facilitate the monitoring of the production by using Innova dashboards.
16 | P a g e
17 | P a g e
18 | P a g e
2.3 Planning and Control
Planning activities before of the start of the production day
The production processes are adjusted by Planning and Control. Roughly 26 weeks before the actual production day, farmers are contacted to identify when they approximately can deliver their birds. The first bird plan is weekly based. However, it is roughly known on what day flocks will be ready to be supplied. Every week there is aimed for the same average quality of all flocks and for the same amount of flocks.
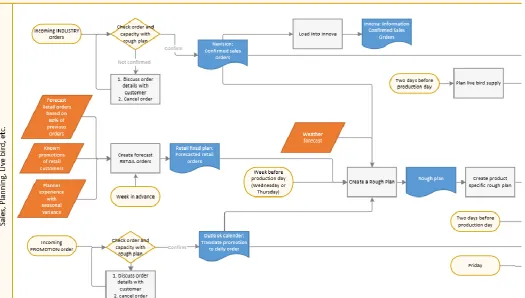
The rest of the planning is mostly done in the last few days before the production day. Flow charts were made to give an overview of the main planning activities before the production day (Figure 2.6a and 2.6b) and the Planning and Control activities during the progression of a production day (Figure 2.7).
A week in advance, the order quantities of retail orders are forecasted. Currently, forecasting is primarily based on an 80% rule (forecast is equal to 80% of last week’s retail quantities). The reason behind the 80% rule is that the order quantities do not differ for more than 20% of the previous orders and commonly not more than 5%. This 80% forecasted quantity serves as a prognosis until 16:00 of the production day, after this the prognosis is adapted to the actual ordered quantities that are confirmed in the afternoon. Forecasting is also based on intuition, such as the planner’s
experience with seasonal variances. Aside from normal retail orders, there are promotional retail orders. These are confirmed on the Friday before the week of the production day on its latest. Promotional orders are also taken into account when the retail orders quantities are forecasted. In the same week before the production day, the rough plan is made. This includes a bird plan, a raw material plan and a rough capacity plan. Planning and Control can make a rough estimation of the available raw material on the production day.
Industry orders are confirmed by customers a week to several days before the actual production day. Every industry order receives a capacity check with the rough plan before they are confirmed. This process consists of checking if there is sufficient raw material and capacity left on that day.
Roughly two days before the production day, the live bird plan is made. At the same time, the rough plan is transformed into several product specific cut-up schedules. One cut-up schedule for wings, FP and other products each. The cut-up schedules describe what products must be produced where, for what orders, in what sequence and with what capacity.
The industry order list is created in the evening before the production day. Both the inventory that must be produced for FP and the known industry order quantities will be used to make an industry order list. The industry order list, cut-up schedules and other important notes are combined into one report called the Good Morning Letter (GML) that is used to start the production day with.
Planning and Control during the production day
19 | P a g e
[image:19.595.34.560.72.370.2]Figure 2.6a flow chart of planning activities before the production day, first part.
20 | P a g e
Figure 2.7 flow chart of Planning and Control activities on the production day itself.
Progression of a typical production day
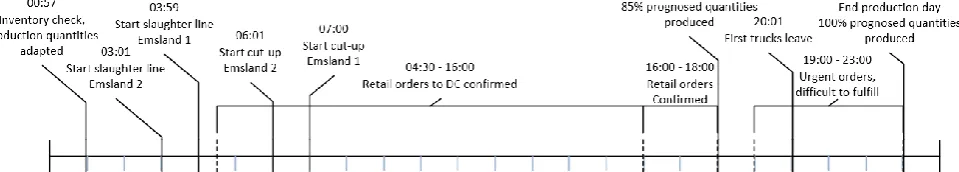
The previous paragraph discusses how the manufacturing system produces on a prognosis. At some point before the production starts, the inventory is checked for left-overs from the previous day. Then, the slaughter lines (primary process) start and two hours later the cut-up lines (secondary process) start. If the production day runs smoothly, the forecasted quantity based on the 80% rule is produced at 16:00. Between 16:00 and 18:00, the retail orders are confirmed. Around 18:00, 85% of the new prognosis is produced and all retail orders are confirmed. From this point, the Planning and Control knows the exact ordered quantities. All the raw material (birds) is slaughtered on the day of arrival. This commonly results in over production.
Products are considered as left-overs for the next day if they cannot be sold by the Sales department. Figure 2.8 illustrates this method of producing on prognosis. During 19:00 and 23:00, the production day becomes chaotic. The manufacturing system is completely focused on delivering orders on time and with enough quantities, negatively affecting the efficiency and effectiveness of the manufacturing system.
The first trucks departure around 20:00. In Figure 2.9 a timeline is provided to illustrate the progression of a
[image:20.595.60.540.727.813.2]21 | P a g e
3. Theoretical background
This chapter discusses the definition of Lean manufacturing and the theoretical framework that guides the rest of the research (Section 3.1). Furthermore, it introduces the principle called Lean Thinking and how it can be used as a systematic method to eliminate waste and answer the central research questions (Section 3.2). Finally, Section 3.3 discusses an approach on how the research deals with different levels of the manufacturing system (in particular levels in Control and Planning).
3.1 Definition and context
For the first time, in 1988, the principles of Lean manufacturing were united by John Krafcik in his article Triumph of the Lean production System (Krafcik, 1988). Lean manufacturing has two main approaches. First, the approach (Lean Thinking) discussed by Krafcik where a continuous flow for the manufacturing system is created by eliminating waste. Waste is per definition activities that do not add any customer value, but utilize resources. To clearly illustrate this concept, an example is given: If a customer has customer values, such as decreasing production costs, deliver on time and make consistent high quality products, it can improve the performance on these values by eliminating non-value adding activities, for instance removing the activity to fix product defects will save up labor and decreases the production costs as a result. In this example the waste is ‘fixing product defects’, the root cause for this waste could be ‘a poorly designed process creates defects’, and the added customer value is ‘decreased production costs’ if the waste is eliminated by solving the root cause. In Lean Thinking, a set of tools facilitate the identification of process areas, their value streams and waste. The goal is to eliminate the waste by finding the root causes and solving those one by one. By doing this, a continuous flow is created where previous wasted capacity and resources are freed up. Some of the most famous tools are:
1. Single-minute exchange of die (SMED) 2. Value Stream Mapping (VSM)
3. Five S 4. Kanban
5. Total Productive Management (TPM)
The second approach is The Toyota Way, also known as the Toyota Production System (TPS). Instead of eliminating waste, the focus is to improve the work flow (or smoothness). The fundamental difference is not within the goal, but within the approach. In TPS, the waste form mura (uneveness) is eliminated while the general Lean Thinking approach is focused on the reduction of waste, no matter the form. TPS states that whenever mura is eliminated, the side-effects are the same as in Lean: a steady work flow is created and muda waste forms are eliminated, such as inventories, waiting times, overproduction, over processing etc. Meanwhile, Lean tackles these wastes to add value from a customers’ perspective.
In this research, the first approach ‘Lean Thinking’ is used and further discussed in the next section. This is because the focus is to maximize customer value, while TPS is focused on improving the work flow and automation for cost reductions and productivity improvements. Furthermore, the focus of improvement in TPS is humans, while Company X is focused on the technical aspects (e.g., machines) and the perfection of the value creating activities, such as packaging, batching and portioning.
3.2 Lean Thinking context
22 | P a g e
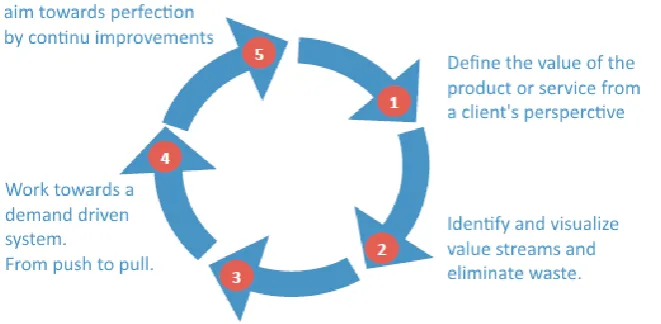
Thinking, being coined for the first time in 1988 to capture the elements of Lean manufacturing introduces a method of five systematic steps that captures the way how, where and what waste is created. Figure 3.1 describes the principles of Lean Thinking that are used step by step to introduce Lean manufacturing into a manufacturing system.
[image:22.595.69.400.162.324.2]
Figure 3.1 The five steps of Lean Thinking.
Traditionally, processes within a manufacturing system are separately monitored, analyzed and then optimized. According to Lean Thinking, this is an inefficient method. Instead, Lean Thinking suggest another approach. To begin with, a manufacturing system is a better system when it has a
continuous flow. To understand the meaning of this, the definition of a manufacturing system and what it consists of is discussed first.
A manufacturing system is a method to organize production and consist of processes. According to Womack a process consist of three different types of activities. First, an activity can be necessary and therefore not be eliminated. Think about activities necessary to comply with safety requirements. Second, an activity can add-value and can be optimized (by eliminating waste equal to 2-5% of the total waste). For instance, a sorting process can be optimized by improving the sorting algorithms. Finally, an activity is not adding any value. An example could be the unnecessary movement of inventory for several times as a result of bad communication between the shop floor and planning department. Another example is the creation of left-overs due to bad planning. These activities are the central focus of Lean Thinking since they are good for roughly 65% of the waste that can be eliminated. Figure 3.2 below illustrates these three different types of activities that are present within a process.
[image:22.595.75.476.629.728.2]23 | P a g e
If waste is eliminated in a manufacturing system, it is considered as working towards a continuous flow. To further illustrate how a continuous flow should look like, let’s look at the manufacturing system of a potential client. The ideal and perfect manufacturing system for the client would be if the planning for the production day would reflect the actual progression of the production day.
Commonly, a lot of adjusting of the planning is needed on the production day and this creates waste. By identifying this waste, finding their root causes and addressing them it would mean that in the ideal future the planning will reflect the exact progression of a production day and is has not to be adjusted anymore. Of course, things like unexpected deviations are to blame for some creation of waste. In our case the client must probably deal with uncertainty in demand that is hard to take into account while planning. If the root causes cannot be solved completely, like demand uncertainty, or if a continuous flow is already almost perfect, then the manufacturing system should work towards a more demand driven system. This is step four of Lean Thinking: aim to go from push towards pull. Examples could be to improve the forecast accuracy, reduce deviations in raw materials, improve the flow of information, avoid the creation of misinformation and so on.
Traditionally, a process or process area will be looked into for bottlenecks or separate aspects of the planning heuristics will be improved. However, it is difficult to analyze the effect of those
improvements and therefore it is difficult to prioritize what has to be addressed first. By analyzing what customer value is added through eliminating a waste, it is possible to prioritize waste and create a continuous flow step by step in a much more efficient and effective way.
Chapter 2 discusses how the first two steps are the scope of this research. Furthermore, Womack claims that only one product family should be analyzed at the time. Different product families have different customer values and it is too overwhelming and complex to address everything at once. The product family should be picked based on customer value. To our client this is the fillets products, because this is the most profitable product family with the most demand in the retail industry. Mainly for these reasons the scope of the research is narrowed down to the filleting department that represents this product family.
Next, after concluding how a manufacturing system should address their weaknesses and what an ideal manufacturing system should look like according to Lean Thinking, the first two steps of the systematic approach of Lean Thinking are introduced.
Step 1: Identify customer value
The reason why Lean Thinking starts with identifying the customer value is simple. If the goal is to eliminate waste to create added value from a customer perspective, then the stakeholder(s) must understand what the customer values are. To do so, every activity is questioned on what value it adds to the customer.
There are six principles to specifically bear in mind when identifying customer value: 1. Deliver what I want
2. Deliver value where I want it 3. Deliver value whenever I want it
4. Reduce the decisions that I have to take to solve my problems 5. Solve my problem completely
6. Do not waste my time
These six principles are closely related to the use of order winners and qualifiers. Here, the competitive strategy of a firm is studied. Operational and strategic goals will emerge from these principles. These can further be categorized with the QDC management approach for customer values that was introduced in Chapter 1 and consist of at least the three categories:
24 | P a g e 2. Delivery 3. Costs
After identifying how customer value is expressed and can be added throughout the manufacturing system, waste can be identified.
Step 2: Identify and visualize value streams and eliminate waste
A value stream is described as all the activities that are executed to transform input into output. Both the main process goal (cutting, weighting, packaging …) and related activities (waiting, inventory …) are of interest. To identify and eliminate waste, these value streams must be identified. A Value Stream Map (VSM) is a tool to support this. It will:
- Identify the process areas.
- Analyze current performance of process areas. - Identify the current activities in the process areas. - Identify the waste in the process areas.
- Analyze the added customer value of eliminating the waste.
- Identify the root cause, provide a solution to solve the root causes and thereby eliminating the waste.
A VSM reflects the current situation and consist of the following (M. Rother & J. Shook, 1999): 1. The Material stream, which displays the flow and transformation of material from input to
output. Information can also be considered as information. a. Process activities
b. Transportation activities c. Inventories
2. Information stream, which describes the activities that inform people what, when and how they should execute activities.
3. Timeline, displaying the throughput time of a product through a process. a. Waiting times
b. Process times
25 | P a g e
Figure 3.3 An example of a Value Stream Map in the current state (miconLeansigma,2018)
After the VSM is made, the current state is analyzed to identify muda. Examples of wastes are problems on the shop floor, unnecessary inventories, machine failure, waiting times, inspection of product defects and poor capacity utilization. Muda has seven forms of waste:
1. Transport (moving products that are not actually required to perform the processing) 2. Inventory (all components, work in process, and finished product not being processed) 3. Motion (people or equipment moving or walking more than is required to perform the
processing)
4. Waiting (waiting for the next production step, interruptions of production during shift change)
5. Overproduction (production ahead of demand)
6. Over Processing (resulting from poor tool or product design creating activity) 7. Defects (the effort involved in inspecting for and fixing defects)
After wastes are identified it is decided what waste must be prioritized to be eliminated and how it can be eliminated. The wastes that add the most customer value to the manufacturing system if they are eliminated are prioritized. Then wastes are analyzed and the root causes are identified. In Lean Thinking the Pareto principle, also known as the 80/20 rule and the law of the vital few, is applied in this problem-solving (Koch, 1999). 80% of the waste in a manufacturing system has their root cause in 20% of the weaknesses. Solving problems at their roots is a major issue and focus in Lean Thinking. For instance, if an operator claims a machine fails because it runs out of machine oil, it is refilled because the operator thinks that this is the problem. However, the root cause of this problem is not the lack of machine oil if the problem keeps happening.
3.3 Planning, scheduling and control
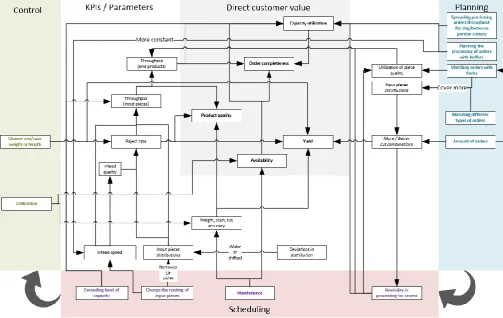
Operational and strategic goals are, at Company X and their clients, described with Key Performance Indicators (KPIs). Furthermore, KPIs are used to evaluate the success of an organization, a process or a group of processes on different levels (Fitz-Gibbon, 1990). The performance on a KPI can only change if a variable changes. Thus the most interest lies in variables that can be ‘played’ with. For Lean manufacturing, KPIs describe the performance of a process from a customer perspective. In order to understand the processes and to identify waste forms, every process is researched on their KPIs. Also, variables, activities (Planning and Control measures) and events that affect the
performance on the KPIs, thus creating waste, are studied to identify waste and their causes. Company X stated that the most difficult task will be the identification of the customer value and to understand what and how customer value is added in processes. For Company X, the results of step 1 (identifying the client value) has emphasis.
To provide a more structured overview, a production day with its variables and KPIs will be approached on three different levels of aggregation; Planning, scheduling and control.
At the level of Planning, most of the production day will be defined by a rough schedule that is based on forecasts. The live bird plan, cut-up schedule and everything else covered by a so called Good Morning Letter (GML) are based on planning variables, such as the forecasted retail order quantities and expected flock quality. Thus, planning is based on forecasting the progression of a production day.
26 | P a g e
At control, the given production schedule is executed on a local level. Controlling individual processes (machines) can, for instance, be done by allocating resources like labor and by dynamic routing of products to the right processes.
[image:26.595.72.521.181.490.2]The three levels of aggregation; planning, scheduling and control can be interpreted as aggregate forecasting, aggregate realization and detail realization, respectively.
Figure 3.4 Planning, Scheduling and Control levels. Figure received from ir. K. (Kay) Peeters in January 2018, University of Eindhoven.
4. Identify customer value
This chapter discusses the execution of the first step of the Lean principle: identifying the client value. First, the strategic goals (Section 4.1) and operational goals (Section 4.2) are identified by observations, the consultation of experts and the study of literature such as machine manuals and a Quick Scan of the client. Chapter 3 discusses the theory of effectiveness and efficiency KPIs and their relations to operational and strategic goals. Here, this theory is applied to distinct KPIs from each other and categorize them systematically. After the goals are identified, they are sorted according to the QDC management approach.
27 | P a g e
1. The KPIs for every individual process (area) are identified. 2. The KPIs that are used by Planning and Control are identified.
3. The measures that are available on Planning, Scheduling and Control level are identified. 4. The expected effects on the KPIs, if the measures are used in different scenarios, are
identified.
There is a realization that the effect of a measurement on different KPIs is dependent on the event that could trigger the measure. Therefore, per process (area) several realistic events are used, the measures that could be triggered by these event are listed and their effect on KPIs are studied. The results are put in tables.
This first step of Lean Thinking is very important and emphasized in the research because it facilitates the execution of step 2 enormous. How customer value is monitored, added and influenced in the manufacturing system is the basis to identify waste and their root causes, understand the added value of solving the causes and evaluating the effects of the Lean improvements (solutions). On the other hand, Company X has only a limited understanding of these topics. They express interests in a comprehensive overview that could support future research.
Currently, Company X is focusing on optimizing every process while still plenty of waste can be eliminated. For instance, the scan accuracy of an IRIS quality scanner is optimized to detect as may defects as possible to prevent any poor quality products passing the process. However, more waste is created due to the rejection of fillets that could not be scanned for several reasons (e.g., wrongly positioned fillets, fillets that were too long or fillets that were too close to each other to be scanned correctly). The activity of providing a better infeed quality (rate at which input pieces are fed correctly to the process) is probably poorly designed or executed. This may cause waste in forms of ‘over processing’ if the process is wrongly designed or ‘defects’ since all the fillets are inspected for defects and fixed if necessary. Instead on eliminating defects, Company X is focusing on inspecting and fixing defects better. This identification of customer values is important to support the decision the decisions what wastes should be eliminated and in order to get rid of the traditional but
inefficient method of optimizing processes by optimizing activities that add value.
4.1 Strategic goals
The long term competitive strategy of a company can be described with competitive variables that can be split up into order winners and qualifiers (Hill, 2000). A company can participate in a market segment when they meet the competitive standards, known as the order qualifiers. In addition, the company must be able to differentiate themselves from other competitors with order winners. For the studied client, their competitive strategy mainly consisted of producing high-volumes and also providing high deliver reliability. The manufacturing plant is one of the few that is partnered with Lidl and Aldi, due to their order winners: high reliability of delivering on time with consistent product quality and extreme big volumes.
For the retail industry, a qualifier is to be able to deliver on time most of the times. Supermarkets for example follow a strict schedule with short time-frames at which orders must be unloaded. The truck with poultry products from the plant is not the only truck with ordered products that must be
unloaded. A commonly strict schedule has slots of 15 minutes where only small delays of several minutes are allowed, if longer the order can be rejected by the customer.
28 | P a g e Order fulfillment
If an order is distributed, the produced quantities may not comply with the actual ordered quantities. According to one of the notes that were taken during an earlier dated plant visit and discussion with one of the head planners (2015) there is a threshold for this KPI that sits on 90%. The progression of the orders is followed with the Innova information support system. If an order is shipped, the order fulfillment is calculated.
Order Punctuality
This KPI indicates how much orders are delivered on time. In fact, there is monitored how much orders are ‘shipped’ on time, since the departure time of trucks is used to calculate this KPI. Shipment time and the driving time to customer could be used as extra KPIs to facilitate the monitoring of order punctuality. According to employees of Company X, punctuality should be considered as a restriction, instead of a KPI. It is so important, that orders should be delivered on time no matter the costs. Nevertheless, the client claims to score 99.5% on punctuality (Tummers, 2015).
Throughout the first visit at the plant, several control measures that were used throughout the day to increase punctuality were observed. One example was located at the packaging department. Here, trays will enter the packaging system and are sealed with plastic. However, some trays are stored after being sealed while others are directly labeled and stored on pallets of specific customer. By doing this, the packaging department creates flexibility that is needed in the late production hours since trays of specific weight and with specific products can complete several different orders. The unlabeled but already sealed trays are labeled for the urgent orders.
Another flexibility measure that is created during the day is located within the fillet lines. Whenever an order is expected to be not completed on time, the planning department will try to adjust the shop floor. They will communicate the urgent orders with operators on the shop floor. On control level, the operators can decide to prioritize specific orders. For instance, portion cutters and batchers can produce for several orders at the same time. If an order becomes urgent, the operators can change the processes so that more input pieces (e.g., incoming fillets) are processed for one of the orders. On a higher level, the Planning can control the streams of products. They can increase the feed of products to specific lines or processes with urgent orders.
During the visits of the plant, only the adjusting of the shop floor on scheduling and control level was observed with the goal to increase order punctuality. From conversations with employees of
Company X and observing the shop floor it indicated that schedulers (sometimes called planners) are adjusting whenever orders were expected to not be completed on time or fully. They seem to be ‘satisfied’ fairly quickly whenever these two KPIs are performing well enough, even when there is space for significant improvements on other KPIs.
Order reliability
The last form of order completeness is reliability. This KPI is a combination of both fulfillment and punctuality. If an order is delivered on time and completely, it is considered as successful.
Order completeness for delayed & quantity adjusted orders (proposed)
29 | P a g e
When a retail order comes in at the Sales department, they are communicated with Planning. The first activity of Planning is to perform a capacity check. If the order cannot be completed on time or if there is a lack of raw materials, the first measure of Planning is to inform Sales to negotiate the order details. Commonly, the order quantities are decreased or the delivery deadline is changed. This is also a measure that is commonly used whenever an already confirmed retail order becomes urgent. The fact that this measure is used without considering any other possible measures (e.g., the negotiation of more flexible industry or DC retail orders) is a very unpleasant sight for the customer value. If this measure is used, it is not monitored if negotiated orders are indeed delivered on time and/or completely.
The retail industry is dominated by some manufacturers and their customers have a lot of power. If Sales has to negotiate the order details it is unpleasant for the customer. But if the order is both negotiated and still delivered to late or incompletely, the retail plant might lose their client. Therefore, the orders that are already negotiated should receive more priority over normal retail orders.
Product quality
For the client, product quality is important. Their customers judge the quality of their ordered products on different aspects:
- Freshness
The expiration date that is labeled on the product package represents the product’s
freshness. The temperatures of processing areas are consistently monitored. Every area has a different temperature, to ensure the quality and freshness of the products.
Every bird is processed on the same day of arrival and left-overs and bulk inventory for FP are either cooled or frozen (at the cost of other aspects of product quality such as taste and color).
- Taste
The taste of the meat must comply with the demanded quality and should be consistent. - Tenderness
Similar to taste, the tenderness of the meat is highly dependent on the performance of the maturation and electronic stimulation process, and the bird’s quality.
- Esthetic of packaging and products
The quality of the product esthetic consists of several components. The packaging and their labeling should be of quality, without defects (e.g., from transportation). The position of products within the packaging is representable to the consumer. The product color and shape are consistent and as expected.
- Hygiene
The hygiene of products is important for safety. A customer will only buy their products from a plant with certificates that assures product quality, especially hygiene-wise.
30 | P a g e
Avoidance of bad publicity
No retail client is willing to co-operate with a firm that has a negative reputation. Especially in the meat industry that is very sensitive to bad publicity, this must be avoided. While it cannot be measured with a KPI, a good reputation is certainly an order qualifier. Both players, the
manufacturing plant and its customers, can take each other down if one’s reputation is assaulted.
Profit
While most strategic goals are identified by order winners and qualifiers, another option is to take the perspective of the client. The client is a private firm and a private firm’s goal is to make profit and therefore profit must be KPI for the client. This can be expressed in many forms; profit accounting, financial accounting, cost accounting, Lean accounting ... (Vanderbeck, 2008; Maskell, 2013; Goldratt, 1990). In the research no KPIs were encountered in the manufacturing system related to monitoring profit making. The KPI has no direct impact on the customer value of the firm.
The client probably follows the traditional cost accounting method or another method that is based on mass production thinking. Lean accounting, on the other hand, breaks the rules of traditionally thinking. As a result, such traditional methods are usually actively hostile to Lean changes (Maskell, 2012). Instead of directly expressing profit in (normally) time or money, Lean accounting uses the same approach of Lean manufacturing by expressing profit with value streams. Traditionally, decisions related to things such as make/buy, investments, introduction of new products or pricing are based on cost information. Often, the wrong decisions are made. In Lean however, decisions are made to eliminate or reduce waste and free up capacity within the manufacturing system which automatically impact the company’s finance.
The client should consider Lean accounting if Lean manufacturing is introduced to the manufacturing system. For now, the company should try to introduce KPIs that can be used to support decision making in the manufacturing system. For instance, a profit KPI might support the planning
department by indicating the profitability of an order and decide what orders should be prioritized over others.
4.2 Operational goals
The client has a significant amount of operational goals and related KPIs. While operational goals are important, they should not be prioritized over strategic goals. To illustrate this, some examples:
- An operational goal is maximizing capacity utilization. At the shop floor, one fillet line can be turned off and another line’s capacity can be utilized better. However, the total capacity is lower and now an order is not expected to be completed on time. While order completeness is a strategic goal, therefore this should not be allowed to happen.
- A planner decides to accept a retail order anyway after it barely came through the capacity check. Now the order is expected to not be completed on time, but it will prevent any expected left-overs from before.
Yield
31 | P a g e
The percentage yield is the total amount of supplied raw material minus the amount lost throughout the production process. The performance on the KPI is dependent on specific events, most of which are also considered KPIs;
- Loss of raw material due human error. - Dead Upon Arrival (DOAs).
- Quality issues (sickness, poor quality).
- Loss of raw material in automated processes (e.g., loss of meat in the portioning of products). - Natural loss of raw material (e.g., the loss of moisture in the chilling process).
Through Innova a component is provided to monitor yield values per process and the total yield. A process can have a so called Yield Point that monitors the following:
- Day in, describes the current production day input weight.
- Day throughput, which refers to the current production day throughput. - Day yield, is the current production day yield.
- Running throughput, known as the running throughput for the current process period. - Running yield, which is the Running yield for the current process period.
- Lot Out, is the Current lot output weight.
- PO in, refers to Current purchase order input weight.
Giveaway
Giveaway is also a yield KPI, however it is somewhat special since it is only used in the batching processes. Here, giveaway is the main KPI. It describes the difference in weight between the target weight of a pack (end product) and its actual weight is known as the giveaway.
Scraping yield
At a scraping yield station (which is a fairly new process area), it is possible to show and monitor the total weight or average yield from the configured Yield Points per product. Based on the product type, a scraping minimum and maximum yield is set and used to compare the performance of the scraping yield station. A higher scraping yield will somewhat reflect the performance on yield in the main process. Less scraping yield can be related to less yield loss in the preceding main process. Because of this interesting relation between overall yield and scraping yield, it felt important to address even while the scraping process is out of our scope.
Throughput
The throughput is the amount of processed kg or pieces per time unit. The throughput can either reflect the speed at which an amount of input pieces is processed or the same speed at which output products are processed. Striving for a higher throughput is important to increase the order
completeness, but it also reflects how well the process is adjusted to the incoming raw material. The throughput is closely related to the KPIs infeed speed (kg/h or pcs/min that enters the process) and the reject rate (rate at which input pieces are rejected). Some reasons for rejecting input pieces are:
- The input piece was positioned incorrectly and could not be processed (e.g., scanned). This is described as the infeed quality.
- The process was too busy and could not process the input piece.
32 | P a g e
Capacity utilization
Optimizing the allocation of resources is important, especially labor-wise, since there is limited available. The utilization of labor can be interpreted in different ways:
- How well labor is assigned to the processes where it is needed. With the right scheduling, labor can be saved in different ways. Also, there is a maximum amount of labor available. Thus, a goal could be to utilize as much of the available labor as possible.
- How well the assigned labor is utilized. Thus, the rate at which employees are busy when they are assigned to a process. This indicates how well the throughput fits the capacity of the assigned labor, and vice versa.
- How well labor is assigned, based on employee’s characteristics. For instance, the throughput of employees differs per process. Assigning the right employees to the right processes will optimize the production and resource utilization.
The number of employees that are assigned to processes is constantly monitored and tried to be kept to a minimum. In addition, the utilization of every employee’s capacity is adjusted by operators on the shop floor.
A process has a maximum capacity. Utilizing the available capacity efficiently will reduce certain costs, like operational costs. For instance, if two packing stations are processing at medium capacity, one packing station might be able to process both capacities together on its own.
Furthermore, planning the right infeed speed for processes will enhance the throughput and finally the order completeness. Scattering, for instance, input pieces between fillet lines to utilize their capacity efficiently might result in better throughput. For fillet lines, however, it is also important to feed input pieces from a not too-wide weight and size distribution to improve the accuracy of processes. The capacity utilization can also be affected by the speed of lines. If a line is running fast, the products lead times are lower. However, a higher line speed negatively affects the capacity utilization, yield and reject rate. Thus, trying to utilize more of the available capacity is commonly a trade-off with other KPIs.
Both maximizing capacity machine and labor-wise are very important to the client, but this comes with trade-offs (commonly throughput or yield are affected). The capacity of the filleting department was frequently addressed as one of the bottlenecks and therefore making the capacity and resource utilization very important to the client.
Availability
The availability of a process describes the state at which a process is in, whether it is planned to be operational or not functional due failure time. The states will be discussed later on.
In general, activities such as maintenance, calibration or failure of preceding processes affect the availability of processes.
The Availability of a process can be described with several different KPIs: - Operation time is the time the process is available for use.
- Unscheduled time is the time a process is available for use, but not utilized (e.g., overcapacity)
- Manufacturing time (also known as Loading time/Planned production time) is the time you want to use the line.
- Not scheduled time is the time a process is not planned to be used (e.g., maintenance). - Line restraint time is when a line is functional but cannot produce at full capacity due a
limited or no input, or the output rate is restricted.