Conditions of Electronic Structure to Obtain Large Dimensionless Figure
of Merit for Developing Practical Thermoelectric Materials
Tsunehiro Takeuchi
EcoTopia Science Institute, Nagoya University, Nagoya 464-8603, Japan
The highest value of the dimensionless figure of meritZTobtainable from a given electronic structure was quantitatively estimated from the linear response theory by considering the normalized spectral conductivity. It was found, by calculatingZTfrom the possible electronic structures, that the bulk materials with the electronic structure consisting of two bands overlapping together near the Fermi level have potential to possess a largeZT-value exceeding unity. [doi:10.2320/matertrans.M2009143]
(Received April 17, 2009; Accepted July 6, 2009; Published August 19, 2009)
Keywords: thermoelectric material, electronic structure, linear response theory, spectral conductivity, dimensionless figure of merit
1. Introduction
Recently, thermoelectric materials attract a considerable interest because the thermoelectric power generator, in which thermoelectric materials are used, is capable of relaxing the serious problems about the running out of fossil fuels and the global warming caused by the increase in anthropogenic greenhouse gas concentration due to the burning of the fuels. Unfortunately, however, the efficiency of energy conversion in the thermoelectric power generator is rather poor and limited below 20% of the Carnot efficiency. This poor efficiency has prevented us from widely utilizing the thermoelectric power generator in variety of applications. In order to relax the serious problems about the running out of fossil fuels and the global warming by widely using the efficient thermoelectric power generator, the development of new thermoelectric materials possessing a sufficient performance are strongly required.
The performance of thermoelectric materials is measured by using the dimensionless figure of merit, ZT ¼S2T=,
because the efficiency of energy conversion in the thermo-electric power generator, which is connected to the heat-sink of high temperature Th at one side and that of low
temper-ature TL at the other side, monotonically increases with
increasingZT1)as
¼ðThTLÞ
TL
ffiffiffiffiffiffiffiffiffiffiffiffiffiffi 1þZT
p
1 ffiffiffiffiffiffiffiffiffiffiffiffiffiffi 1þZT
p
þTh=TL
: ð1Þ
Here S,, and represent thermoelectric power, electrical conductivity and thermal conductivity, respectively. These three thermoelectric properties are closely related with each other because the common factors, such as carrier concen-tration and carrier mobility, simultaneously and strongly affect their magnitude. It is widely believed, therefore, that the optimal condition to obtain the maximum ZT-value is hardly predicted.
Since semiconducting materials were predicted to possess a large ZT-value and this prediction was confirmed exper-imentally,1) many practical thermoelectric materials have been developed over last 50 years by searching the optimal condition of the maximum ZT-value for semiconducting
materials mainly with trial and error method. Now it becomes difficult to find new thermoelectric materials with this trial and error method.
Recently, some new ideas to increase the ZT-value of thermoelectric materials were proposed. Those are the ideas using ‘‘the electron crystal and phonon glass’’,2,3)‘‘the low-dimensional nano-structures’’,4,5) ‘‘the strongly correlated materials’’,6,7) ‘‘the Kondo-semiconductors’’,8) and ‘‘the weakly bonded rigid heavy clusters’’.9)New thermoelectric materials with a largeZT-value were indeed developed on the basis of these ideas. Unfortunately, however, a considerable breakthrough promoting the growth of thermoelectric appli-cations has not been obtained even with these new ideas. Therefore we have to find a new, more effective guiding principle to develop a practical thermoelectric material of extremely high performance.
We realized, from our recent studies, that the thermo-electric properties associated with electrons are quantitative-ly predicted or reproduced by using the linear response theory, provided that reliable information about the elec-tronic structure is simultaneously used.10–14) This fact
suggests that a guiding principle to develop a new thermo-electric material can be constructed in terms of electronic structure rather than separately considering the three corre-lated thermoelectric properties, electrical conductivity , thermoelectric powerS, and thermal conductivity.
In this paper, we propose a new strategy to obtain a practical thermoelectric material of high performance on the basis of the calculation of the dimensionless figure of meritZT ¼S2T=using the linear response theory and the
electronic structures potentially persisting in some materials. Some groups of materials possessing such an electronic structure will be also introduced.
2. Equations to Estemate the Thermoelctric Properties
The linear response theory is generally used to evaluate the electron transport properties. Notably it is used both in the Boltzmann transport equation and the Kubo-Greenwood formula.15) In this theory, the following formulae are used to describe the thermoelectric properties in association with the conduction electrons.
ðTÞ ¼ Z 1
1
ð";TÞ @fFDð";TÞ
@"
d" ð2Þ
SðTÞ ¼ 1 jejT
Z1
1
ð"Þð";TÞ
@fFDð";TÞ @"
d"
Z1
1
ð";TÞ
@fFDð";TÞ @"
d"
ð3Þ
elðTÞ ¼
1
e2T Z1
1
ð"Þ2ð";TÞ @fFDð";TÞ @"
d"
1
e2T
Z1
1
ð"Þð";TÞ
@fFDð";TÞ @"
d"
2
Z1
1
ð";TÞ
@fFDð";TÞ @"
d"
ð4Þ
Here, ð";TÞ, fFDð";TÞ, and indicates spectral
conduc-tivity, Fermi-Dirac distribution function and chemical po-tential, respectively. Note here that the chemical potential is equivalent to the Fermi level"Fat 0 K, but deviates from"F
with increasing temperature.15)
Equations (2)–(4) suggest that only two terms have to be considered to understand the behaviors of thermoelectric properties, i.e., the spectral conductivity ð";TÞ and the energy derivative of the Fermi-Dirac distribution function ð@fFDð";TÞ=@"Þ. The latter functionð@fFDð";TÞ=@"Þin the
integrands is easily calculated at a given temperature and plays a role of a window limiting the energy range of integration.10–14) It is, therefore, naturally understood that the spectral conductivity ð";TÞ solely determines these three thermoelectric properties at a given temperature. It is explained, in other words that we should not separately deal with the three different transport properties but solely with
theð";TÞto develop the materials with a largeZT-value. By
knowing that the spectral conductivity ð";TÞ is mainly determined by electronic structure, one may realize that the reliable information about the electronic structure is of great importance.
Recently, the developments in the first-principle band calculation and the photoemission spectroscopy allow us to obtain reliable information about the electronic structure. By using eqs. (2)–(4) together with the spectral conductivity calculated from the electronic structure, we succeed in interpreting the unusual behaviors in electron transport properties,ðTÞ,SðTÞ, andelðTÞ, observed for some different
groups of material.10–14)
With keeping this fact into mind, we mathematically transformed theZT-formula into a slightly modified form.
ZT ¼ S 2T
elþph
¼S 2T
el
1 1þph=el
ð5Þ
Two factors are extracted from eq. (5). The first factor,
A¼S2T=el; ð6Þ
is a property of conduction electrons and solely determined by the spectral conductivityð";TÞ. The second factor
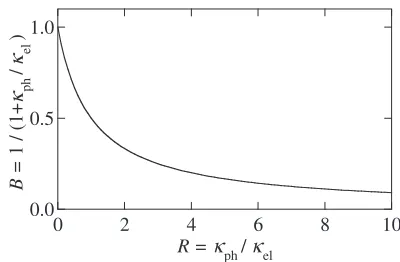
B¼1=ð1þph=elÞ; ð7Þ
on the other hand, is determined by the ratio of lattice thermal conductivity to that of electrons,R¼ph=el. Note here that
the magnitude of factorBshown in Fig. 1 obviously reduces
from unity to zero with increasing R. This fact unambigu-ously indicates that the factor B always makes ZT-value smaller, while that the magnitude of factorArepresents the maximum ZT value obtainable at a given spectral conduc-tivity.
It was also found that the magnitude of factor A is not affected by the magnitude of the spectral conductivity but by its energy dependence. It is explained, in other words, that even if normð";TÞ ¼ð";TÞ=C was substituted for ð";TÞ
in the calculation of A, the same result should be obtained because the energy independent factorCcomes out from the integrals in eqs. (2)–(4) and disappears in eq. (5) due to its presence both in the denominator and numerator. The same is true even if the factor C varies with temperature, provided thatChas no energy dependence or negligibly small energy dependence.
In the following section, the magnitude of A, which represents the maximum ZT-value at a given spectral conductivity, is calculated using the models of spectral conductivity obtainable for some real, bulk materials.
3. The Maxium ZT-Value in a Free Electron Like Electronic Structure
As it has been frequently employed, we start with the simplest electronic structure, the free-electron-like single band model in the 1- to 3-dimensional space, partly because the electronic structure near the band edge is generally well accounted for with this model, and partly because a largeZT -value is obtainable when the chemical potential is located near the band edge such as that in degenerate semiconduc-tors. The energy-momentum dispersion in this model is expressed as "¼h2k2=ð2mÞ, whereh
andm indicates the Planck constant and the effective mass of electrons, respec-tively. In the case of free-electron-like model, the Boltzmann transport equation in an isotropic systems,
ð";TÞ ¼e
2
3 Dð"Þv
2
Gð"Þð";TÞ; ð8Þ
should be applicable to describe the spectral conductivity. Here Dð"Þ, vGð"Þ ¼ jvGð"Þj, and ð";TÞ indicate electronic
density of states, magnitude of group velocity, and relaxation time, respectively.
Generally speaking, the temperature dependence of elec-trical resistivity in metals is caused by the temperature dependence of relaxation time, ð";TÞ. One may, therefore,
1.0
0.5
0.0
B =
1 / (1+
ph
/
el
)
10 8
6 4
2 0
R = κph/κel
κκ
[image:2.595.325.525.70.201.2]seriously concern about the effect of the complicated temperature dependence in the spectral conductivity when calculatingA. However, if an energy independent mean free path (‘ð";TÞ ’‘ðTÞ), or an energy independent relaxation time (ð";TÞ ’ðTÞ) is assumed, those terms possessing strong temperature dependence disappear from eq. (5) as it was explained in the previous section. As far as we observed in our photoemission experiments of various metallic materials including the materials of strong electron correla-tion, the energy dependence of the relaxation time is negligibly small in the energy range where the electrons determine the transport properties.13,14,16–18)Thus we do not have to seriously concern about the temperature dependent spectral conductivityð";TÞbut simply use the temperature independent normalized spectral conductivity asnormð"Þ ¼
ð";TÞ=ðTÞornormð"Þ ¼ð";TÞ=‘ðTÞ.
Under the assumption of energy independent mean free path, we calculated the normalized spectral conductivity normð"Þ of the free-electron-like states which varies with
being proportional toð""0Þ0,ð""0Þ1=2, andð""0Þfor
the 1-, 2-, and 3-dimensional model, respectively. Here "0
represents the lowest energy of the free-electron band. In the case of the energy independent relaxation time, we obtain normð"Þ which is proportional to ð""0Þ1=2, ð""0Þ, and ð""0Þ3=2for 1-, 2-, and 3-dimensional model, respectively.
One can easily confirm these tendencies by knowing the fact that the magnitude of group velocity is expressed asjvGð"Þj /
ð""0Þ1=2 while the density of states in N-dimensional
space,DNð"ÞasD1ð"Þ / ð""0Þ1=2,D2ð"Þ / ð""0Þ0and
D3ð"Þ / ð""0Þ1=2. The magnitude ofA-factor representing
the maximum ZT-value at a given spectral conductivity is calculated fromnormð"Þ / ð""0Þn(n¼0;1=2;1;3=2) with
varying chemical potential.
Before showing the result, we should stress here that only a few assumptions were used in this calculation; the free-electron-like band structure at the band edge and the energy independent mean free path or the energy independent relaxation time. The free-electron-like band structure at the band edge is well applicable for the system with small number of carriers (electrons or holes) in the band, and the energy independent mean free path or the energy independent relaxation time was confirmed to be valid in many papers including our previous ones.10–14,19–21)
It should be also noted here that the present calculation has advantage in the calculation of ZT-value because the straightforward numerical integration was used instead of the complicated mathematical transformations employed in many other theoretical papers.19–23) This advantage was
explained in more detail elsewhere.10–14)
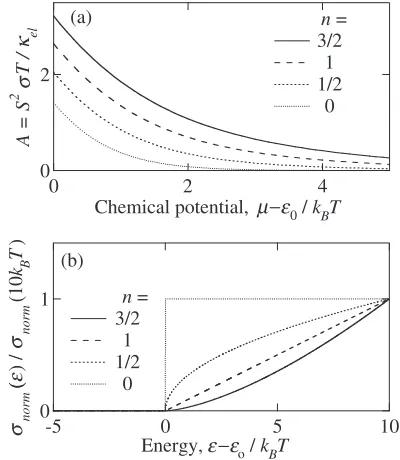
The calculated value of A is shown in Fig. 2(a) as a function of chemical potential together withnormð"Þused in
the calculation in (b). Obviously the factor A possesses a larger value with larger exponentn innormð"Þ / ð""0Þn.
This fact clearly indicates that the three-dimensional model always possesses a larger A-value than that of the one- or two-dimensional model at a given chemical potential. It is also easily realized that the value of A increases with decreasing chemical potential, and that the large A-value exceeding 2 is obtainable at a chemical potential near the band edge.
One has to remember, however, that the magnitude of factorBbecomes much smaller than unity at this particular condition because the chemical potential near the band edge limits the number of electrons in the band to a small value. The small number of carriers definitely makes el much
smaller thanph, and a largeR-value exceeding two, a small
B-value less than 1/3, and consequently a small ZT-value much less than unity must be obtained. It is strongly argued, therefore, that as far as the degenerate semiconductors possessing a very simple free-electron-like electronic struc-ture near the band edge are used, we cannot obtain a largeZT -value much larger than unity.
It is often argued that the magnitudes of thermoelectric power and power factorPF¼S2increase when the slope of
electrical density of states at the Fermi levelð@Nð"Þ=@"Þ"¼"F
becomes larger. One may, therefore, feel strange by knowing the difference of our newly proposing condition from a large ð@Nð"Þ=@"Þ"¼"F to obtain a largeZT-value.
We stress here that the argument using ð@Nð"Þ=@"Þ"¼"F
is valuable only when the spectral conductivity is directly proportional to the density of states and linearly varying with energy. This condition is satisfied for some metallic elements, such as fcc cupper and other simple metals, over a wide temperature range, but is applicable only in a very low temperature for the thermoelectric materials possessing a fine electronic structure in the vicinity of "F
including the materials well described with the present model.
Equation (3) suggests that the larger magnitude of thermoelectric power is obtained with a larger ratio R in
magnitude of spectral conductivity around 1.5kBT above the
chemical potential to that around 1.5kBTbelow the chemical
potential.10–14)In the present model, the largeRis obtained
with a larger value of n, because it is described as
1
0
norm
( (
) /
norm
(
10
kB
T
)
10 5
0 -5
Energy, o / kBT (b)
n = 3/2
1 1/2
0 2
0
A = S
2
T /
el
4 2
0
Chemical potential, µ ε− 0 / kBT n = 3/2
1 1/2
0 (a)
ε ε−
σσ
ε
σ
κ
Fig. 2 (a) The value ofA¼S2T=
el, which represents the maximumZT
[image:3.595.326.526.73.303.2]R¼
ðþ1:5kBTÞ
ð1:5kBTÞ
¼ "bottomþ1:5kBT
"bottom1:5kBT
n
>1: ð9Þ
In the case of a spectral conductivity linearly varying with energy as ð"Þ / ðNð"FÞ þ ð@Nð"Þ=@"Þ"¼"Fð""FÞÞ, a larger
Ris obviously obtained with a largerð@Nð"Þ=@"Þ"¼"Fbecause
R is explained as R¼ ðNð"FÞ þ1:5kBTð@Nð"Þ=@"Þ"¼"FÞ= ðNð"FÞ 1:5kBTð@Nð"Þ=@"Þ"¼"FÞ. Thus we strongly argue that
our newly proposing condition is consistent with the well-known strategy of a large ZT-value, although the latter is applicable only for limited materials.
Before leaving the calculation with the free-electron-like electronic structure, we should make comments on the previously reported calculation using low-dimensional struc-tures.
Hicks and Dresselhause proposed that ZT drastically increases in low dimensional quantum-well structures.4)
The largeZT-values obtained in their calculation was mainly brought about by the step structure in the electronic density of states which is produced by the band edge of the sub-bands. The decrease in lattice thermal conductivity due to the well also makes the magnitude ofZT-value larger, although it is considered as a rather minor effect. In the present calculation, we also employed one- and two-dimensional structure, but the presence of sub-bands was not assumed because the two dimensional materials, such as the layered cupper oxides12–14) and the layered cobalt oxides,16–18)does not possess such sub-bands. The absence of the sub-bands prevented us to obtain the drastic increase in ZT-value predicted by Hicks and Dresselhause4)even with the low-dimensional structures.
4. Possible Electronic Structures for a Large ZT-Value Exceeding Unity
In this section, we propose a new model of electronic structure to develop the thermoelectric materials possessing a high ZT-value exceeding unity. We found in the previous section that a larger magnitude of A is obtained when the chemical potential exists near the band edge and the exponent
n in normð"Þ / ð""0Þn is large. Unfortunately, however,
then-value larger than 3/2 is unlikely to be obtained as far as the assumptions of free-electron-like, single band and the assumptions of constant mean free path or constant relaxation time are used. By knowing that the large exponent n in normð"Þ / ð""0Þn indicates more significant variation of normð"Þ with varying energy, one may realize some other
electronic structures capable of leading to the large magni-tude ofA. One typical example isnormð"Þconsisting of a step
function as that used in the low dimensional sub-bands model.4)
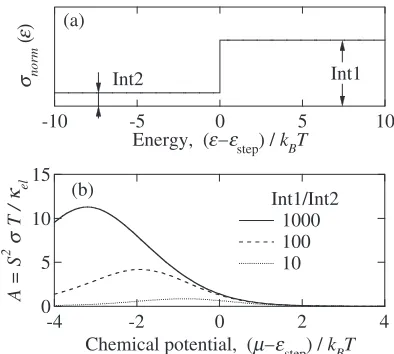
The chemical potential dependence ofAwas calculated for a hypothetical spectral conductivity consisting of a step function, in which the magnitude of spectral conductivity increase from Int2 to Int1 at a given energy "step. We
employed three different magnitude ratio at the step, Int1/ Int2 = 10, 100, and 1000. Since "step is not the energy of
band edge and a finite magnitude of spectral conductivity persists at the energy range below "step, we calculated the
magnitude ofAeven at the negative value of"step. This
hypothetical spectral conductivity is shown in Fig. 3 together with the calculated A-value. Obviously, the magnitude of
A increases with increasing Int1/Int2, and a very large magnitude of A exceeding 3 is easily obtained in this hypothetical model. In sharp contrast to the free-electron model, this model provides us with a finite magnitude of spectral conductivity at the energy range below "step. This
finite magnitude, Int2, leads to a finite electrical conductivity even with the condition of < "step. The finite value ofel
must lead to a relatively large magnitude of the factorB. The consequently obtained large magnitudes both in A and B
definitely provide us with a large magnitude ofZTexceeding unity.
Unfortunately, however, it is very difficult to obtain a step function with a large Int1/Int2 ratio innormð"Þof real, bulk
materials. Instead of using this hypothetical spectral con-ductivity possessing a step-structure, we propose here a possible electronic structure showing a step-like behavior in its energy dependence. That is a model consisting of two bands possessing a fairly different energy-width. By placing the narrow band at the energy near the band-edge of wider band, we can obtain a step from the small magnitude of wider band to the large magnitude of narrower band, such as the step from Int2 to Int1 in the step-function model.
The result obtained from the hypothetical spectral func-tion consisting of a step-funcfunc-tion suggests that the magnitude of A becomes larger with larger Int1/Int2 ratio with the chemical potential located at the energy range where the smaller intensity Int2 persists. Such a smaller magnitude is obtainable near the band edge rather than the center of band. One may, therefore, naturally realized that the chemical potential must be located at the energy range between the edge of the wider band and the step as"0< < "step.
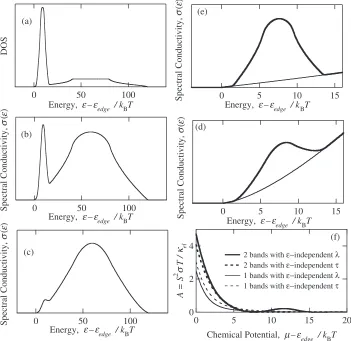
Figure 4(a) shows the density of states consisting of the two bands calculated under the assumption of tight-binding model with a three-dimensional simple cubic lattice by assuming a large difference in the band-width, w1/w2 = 10. The spectral conductivity calculated under the assumption of energy independent mean free path and that of energy
15
10
5
0
A = S
2
T /
el
-4 -2 0 2 4
Chemical potential, (µ ε– step) / k
ε ε–
BT Int1/Int2
1000 100 10 (b)
norm
()
-10 -5 0 5 10
Energy, ( step) / kBT
Int2 Int1
(a)
σ
ε
σ
κ
Fig. 3 (a) Hypothetically introduced spectral conductivity possessing of a step from a small intensity Int2 to a large intensity Int1 at a given energy "step. (b) The value ofA¼S2T=el, which represents the maximumZT
[image:4.595.328.525.71.248.2]independent relaxation time is also shown in Fig. 4(b) and (c), respectively. The spectral conductivity near the band edge is enlarged in Fig. 4(d) and (e) for the sake of better understanding. Obviously, a step-like structure appears in the density of states, and this characteristic persists even in the spectral conductivity, although the step-structure becomes less obvious in the latter because of the small group velocity of the narrower band.
In order to calculate the magnitude of A, the wider band is tentatively assumed to have120kBT in energy-width. The
narrower band of 12kBT in width is located near the band
edge of the other band with its center at 7.5kBT from the
edge. The magnitude of A was calculated as a function of chemical potential. The resultingAis shown in Fig. 4(f) as a function of chemical potential together with the calculated value without the narrow band.
The structure of the tight-binding band is well approxi-mated with the free-electron model at its band edge, and therefore the chemical potential dependence of A-value without the narrow band shows almost the same behavior with that of the three-dimensional free-electron model shown in Fig. 2. Notably, however, the magnitude of A is signifi-cantly enhanced when the narrow band is additionally located
near the band edge of the wide band. It should be also mentioned that the presence of the narrow band together with the wide band causes an increase in the electron thermal conductivity, and therefore the magnitude ofBis effectively increased. The large magnitude of A exceeding 3 together with relatively largeB naturally leads to a large magnitude inZT, which may exceed unity.
The present model has the step structures not only at
"step"edge¼1:5kBT but also at 13.5kBT. Note, however,
that the step-structure persisting at "step"edge¼13:5kBT
has less importance because the wider band has a rather large magnitude at this energy range. Although finite increase of
A-value, which is caused by the step-structure, is observable around "edge¼13:5kBT, the magnitude is limited less
than 0.25. This result strongly let us consider that we have to place the chemical potential near the edge of the wider band to obtain a large A-value exceeding unity. It is explained, in other words, that the use of degenerate semiconductor possessing some additional narrow bands near the chemical potential is of great importance to obtain a practical thermo-electric material. We conclude from the present calculations that the degenerated semiconductors with two bands pos-sessing a different energy-width and overlapping with each
4
2
0
A = S
2
T /
el
20 15
10 5
0
Chemical Potential, µ ε– edge / kBT
(f)
2 bands with ε−independent λ 2 bands with ε−independent τ 1 bands with ε−independent λ 1 bands with ε−independent τ
Spectral Conductivity,
()
100 50
0
Energy, edge / kBT
(b)
Spectral Conductivity,
()
100 50
0
Energy, edge / kBT
(c)
Spectral Conductivity,
()
15 10
5 0
Energy, edge / kBT
(d)
Spectral Conductivity,
()
15 10
5 0
Energy, edge / kBT
(e)
DOS
100 50
0
Energy, edge / kBT
(a)
–
ε ε
σκ
σε
–
ε ε
σε
σε
σε
–
ε ε
–
ε ε
–
ε ε
Fig. 4 (a) The electronic density of states calculated from the overlapping two tight-binding bands of a simple cubic lattice. The spectral conductivity calculated under the assumption of constant mean free path and constant relaxation time is shown in (b) and (c), respectively. These spectral conductivity near the edge of wider band is magnified using the thick solid line in (d) and (e) for the constant mean free path and constant relaxation time model, respectively, together with that of the wider band using the thin line. The factorA¼S2T=
el,
[image:5.595.123.474.74.415.2]other near the chemical potentialare the potential candidates for the thermoelectric material of a largeZT-value exceeding unity even in the bulk form.
We have to make a comment on ‘‘the multi-band model’’ previously proposed by Tse and Klug.24)Our proposed idea
using several bands possessing a different effective mass is essentially the same with the ‘‘the multi-band model’’ of Tse and Klug. Note, however, that the use of the band-edge of the wider band, which is one of the most important arguments to get a large A-value in this study, was not suggested in the Tse-Klug’s ‘‘multi-band model’’. Thus, we safely argue that our proposing idea of the degenerated semiconductors consisting of two bands possessing a different energy-width and overlapping with each other near the chemical potential
would be a new, effective idea to produce practical thermo-electric materials.
5. Discussion
We propose, here, two groups of materials that possibly have an electronic structure in the conditions mentioned above.
Alloys consisting of simple metal elements and transition metal elements are proposed as the first possible candidate because the widers;p-bands are supposed to overlap with the narrowerd-bands. Degeneracy of the severald-bands would make the step in spectral conductivity more significant. Unfortunately, however, the energy width of the narrow d -band in transition metal oxides generally exceeds a few eV, which is slightly wider than the energy width required for the narrow band used in our present analysis. Since the energy width of the band is determined from the transfer integrals between the neighboring local wave functions, one may find some transition metal alloys with a large ZT, provided that the alloys are characterized by a relatively low packing-density. Band folding due to the small Brillouin zone also makes eachd-band narrower, and therefore transition metal alloy with a complex structure would be another candidate.
Transition metal oxides, in which all the bands possess a relatively narrower energy-width because of the relatively low packing density and subsequently obtained small transfer integrals, is another candidate possessing the particular electronic structure leading to a large A-value. The bands consisting of thed-orbital spreading towards the neighboring atoms have a relatively wider energy-width, while the bands ofd-orbital spreading towards the vacant spaces must possess a narrower width. If those bands overlap with each other with the chemical potential near the band edge, the materials would possess a largeZT-value.
Note here that the electronic structure of the layered cobalt oxide NaxCoO2near the chemical potential is characterized
by the several narrow-band overlapping with each other. Although the width of each band is not significantly different, it possesses the similar energy dependence in spectral conductivity we proposed in this paper because of the nontrivial energy-momentum dispersion.16–18)
Finally, the role of factorBis discussed in more detail. The factor B in a given electronic structure is increased by the smallphor largeel. This condition would be realized if the
ideal condition of electron crystals and phonon glass (ECPG)
were satisfied. The concept of ECPG is know as one of the most famous guiding principles to prepare a thermoelectric material of high performance.2)We should stress, however,
that a large ZT-value exceeding unity cannot be obtained solely with a large magnitude of factor Beven if it reaches nearly the maximum, because the magnitude of B never exceed unity. Thus theB-factor must be considered as less important, while the characteristic spectral conductivity and the resultingAshould be the dominant factor for a largeZT -value exceeding unity. Note that the concept of ECPG is still useful, but only when materials possess the electronic structure capable of possessing a largeA-value.
It should be also mentioned that the magnitude of factorB
is effectively increased almost independently from the factor
Aby artificially introducing a super structure or by selecting materials with a large lattice constant. This is because that a superstructure or a large unit cell leads to the reduction in size of the first Brillouin zone, and consequently to the reduction in the number of acoustic phonons and to the development of the umklapp scattering of phonons. This mechanism was discussed in detail in our previous paper.11)
Combinational use of the newly proposed conditions for the factorsA andB would provide us with a bulk material possessing a largeZTexceeding unity. We strongly hope that new thermoelectric materials of a large ZT-value will be developed with the idea proposed in this paper.
6. Conclusion
In this paper, we employed a new method to evaluate the maximum dimensionless figure of meritZT obtainable from a given electronic structure. By calculating the maximum dimensionless figure of merit from possible electronic structures, we found that the degenerated semiconductors consisting of two bands could have a large ZT-value, provided that those bands possess different energy-width and overlap with each other near the chemical potential.
REFERENCES
1) A. F. Ioffe: Semiconductor Thermoelements and Thermoelectric cooling, (Infosearch Limited, London, 1956).
2) G. A. Slack:CRC Handbook of Thermoelectrics, ed. by D. M. Rowe (CRC press, Boca Raton, 1995) pp. 407–440.
3) J. W. Sharp, E. C. Jones, R. K. Williams, P. M. Martin and S. C. Sales: J. Appl. Phys.78(1995) 1013–1018.
4) L. D. Hicks and M. S. Dresselhaus: Phys. Rev. B47(1993) 12727– 12731.
5) R. Venkatasubramanian, E. Siivola, T. Colpitts and B. O’Quinn: Nature
413(2001) 597–602.
6) I. Terasaki, Y. Sasago and K. Uchinokura: Phys. Rev. B56(1997) R12685–R12687.
7) R. Funahashi, I. Matsubara, H. Ikuta, T. Takeuchi, U. Mizutani and S. Sodeoka: J. Appl. Phys.39(2000) L1127–L1129.
8) T. Takabatake and F. Iga: Physica B328(2003) 53–57.
9) J. T. Okada, T. Hamamatsu, S. Hosoi, T. Nagta, K. Kimura and K. Kirihara: J. Appl. Phys.101(2007) 103702.
10) T. Takeuchi, T. Otagiri, H. Sakagami, T. Kondo, U. Mizutani and H. Sato: Phys. Rev. B70(2004) 144202.
11) T. Takeuchi, N. Nagasako, R. Asahi and U. Mizutani: Phys. Rev. B74
(2006) 054206.
12) H. Komoto and T. Takeuchi: J. Elec. Mater.38(2009) 1365–1370. 13) T. Takeuchi, H. Kaga, Y. Okada, H. Ikuta, T. Baba, S. Tsuda and
14) T. Kondo, T. Takeuchi, T. Yokoya, S. Tsuda, S. Shin and U. Mizutani: Phys. Rev. B72(2005) 024533.
15) For example, Z. M. Ziman: Principle of the theory of solids, (Cambridge University Press, Cambridge, 1972).
16) T. Kitao, T. Takeuchi, T. Kondo, H. Ikuta, M. Mikami, M. Shikano and R. Funahashi: Tras. MRSJ31(2006) 367–370.
17) S. Kuno, T. Takeuch, H. Ikuta, T. Kondo, A. Kaminski, Y. Saito and S. Fujimori: IEEE conf. proc., (26th International Conference on Thermo-electrics, 2007/6/3-6/7, Jeju, South Korea) pp. 99–102.
18) T. Takeuchi and S. Kuno:Thermoelectric Power Generation, ed. by T. P. Hogan, J. Yang, R. Funahashi and T. Tritt, (Mater. Res. Soc.
Symp. Proc. Volume1044, Warrendale, PA, 2007) 1044-U02-07. 19) N. Arita, S. Sakurai, H. Kurisu, S. Yamamoto and M. Matsuura: Trans.
MRSJ29(2004) 2555–2558.
20) D. J. Singh: Mat. Res. Soc. Symp. Proc.691(2002) G1.2.1-8. 21) J. Yang, H. Li, T. Wu, W. Zhang, L. Chen and J. Yang: Adv. Funct.
Mater.18(2007) 2880–2888.
22) R. R. Heikes and R. W. Ure:Thermoelectricity: Science and Engineer-ing, (Interscience, New York, 1961).
23) J. Tauc: Phys. Rev.95(1954) 1394.