Original citation:
Buddelmeyer, Hielke and Powdthavee, Nattavudh. (2016) Can having internal locus of control insure against negative shocks? Psychological evidence from panel data. Journal of Economic Behavior & Organization, 122 . pp. 88-109.
Permanent WRAP URL:
http://wrap.warwick.ac.uk/81472
Copyright and reuse:
The Warwick Research Archive Portal (WRAP) makes this work by researchers of the University of Warwick available open access under the following conditions. Copyright © and all moral rights to the version of the paper presented here belong to the individual author(s) and/or other copyright owners. To the extent reasonable and practicable the material made available in WRAP has been checked for eligibility before being made available.
Copies of full items can be used for personal research or study, educational, or not-for-profit purposes without prior permission or charge. Provided that the authors, title and full bibliographic details are credited, a hyperlink and/or URL is given for the original metadata page and the content is not changed in any way.
Publisher’s statement:
© 2016, Elsevier. Licensed under the Creative Commons Attribution-NonCommercial-NoDerivatives 4.0 International http://creativecommons.org/licenses/by-nc-nd/4.0/
A note on versions:
The version presented here may differ from the published version or, version of record, if you wish to cite this item you are advised to consult the publisher’s version. Please see the ‘permanent WRAP URL’ above for details on accessing the published version and note that access may require a subscription.
Can Having Internal Locus of Control Insure Against Negative
Shocks? Psychological Evidence from Panel Data
Hielke Buddelmeyer
MIAESR, University of Melbourne
Nattavudh Powdthavee*
CEP, London School of Economics and MIAESR, University of Melbourne
2nd November 2015
Abstract
We investigate whether the intensity of emotional pain following a negative shock is different across the distribution of a person’s locus of control – the extent to which individuals believe that their actions can influence future outcomes. Using panel data from Australia, we show that individuals with strong internal locus of control are psychologically insured against own and others’ serious illness or injury, close family member detained in jail, becoming a victim of property crime and death of a close friend, but not against the majority of other life events. The buffering effects vary across gender. Our findings thus add to the existing literature on the benefits of internal locus of control.
JEL: D03; I19
1. Introduction
A rapidly growing literature in economics is highlighting the importance of non-cognitive skills in determining economic choices and behaviors. The overall
consensus among these studies is clear: Measures of non-cognitive skills such as the Big Five personality traits (conscientiousness, extraversion, openness to experience, emotional stability, and agreeableness), creativity, and self-esteem are important predictors of many successful educational and labor market outcomes, including highest completed education level, productivity in the labor market, retention rates, and wages (see, e.g., Barrick and Mount, 1991; Salgado, 1997; Bowles et al., 2001; Heckman et al., 2006; Heineck, 2011).
In this paper, we focus our attention on one specific non-cognitive skill: locus of control. Locus of control represents a person’s generalized attitude, belief, or expectancy regarding the nature of the causal relationship between his/her behavior and its consequences (Rotter, 1966; Lefcourt, 1976). The distinction is typically made between “internal” locus of control – that is, the belief that much of what happens in life stems from one’s own actions – and “external” locus of control – that is, the belief that events in one’s life are outcomes of external factors (e.g., fate, luck, other people) and are therefore beyond one’s control.
Empirical evidence that documents the benefits of internal locus of control is now becoming well established in the labor market literature (for a review, see Cobb-Clark, 2015). Studies in this area have shown that people who have internal locus of control tend to invest more in human capital accumulation than people with an external locus of control, because the former’s expected return to human capital investment is higher (Coleman and DeLeire, 2003).1 People with internal locus of
control also tend to live a healthier lifestyle through healthier diets and exercise (Cobb-Clark et al., 2014), save more money for “rainy days” (Cobb-Clark et al., 2013), invest more time to stimulate cognitively their children (Lekfuangfu et al., 2014), and hold riskier assets (Salamanca et al., 2013). Another interesting and important property of internal locus of control is grit or perseverance in the face of adversity. For example, evidence is emerging that people who have internal locus of control tend to continue employment following a health shock (Schurer, 2014) and
1 One exception is a study by Cebi (2007), who does not find internal locus of control to be a
search for a job more intensively when unemployed (Caliendo et al., 2015; McGee, 2015).
The current study contributes to the literature on locus of control by investigating whether an individual’s belief about the ability to control future outcomes has important implications for the individual’s psychological resilience against negative shocks. According to the world-leading scholar on resilience George Bonanno (2004), psychological resilience can be defined as the ability of individuals
in otherwise normal circumstances who are exposed to an isolated and potentially highly disruptive event such as the death of a close relation or a violent or a life-threatening situation to maintain relatively stable, healthy levels of psychological and physical functioning … as well as the capacity for generative experiences and positive emotions. (pp. 20–21)
The potentials for humans’ psychological resilience are important not only to psychologists but also to economists and judges. Knowledge of the extent to which people are psychologically insured against various adverse life events can, for example, improve the way that compensatory damages (or the level of
compensation for a bad life event due to negligence) are calculated in the courts of law (Oswald and Powdthavee, 2008). It can also help improve the accuracy of many existing cost–benefit models that take into account people’s subjective
experiences (see, e.g., Kahneman and Sugden, 2005; Dolan and Kahneman, 2008). However, although Bonanno and colleagues have been able to show that an average person is remarkably resilient across various adverse life events, including bereavement (Bonanno et al., 2002), sexual assault (Bonanno, 2013), and surviving a terror attack (Bonanno et al., 2005), more remains to be understood about the heterogeneity and the determinants of the heterogeneity that forms the average (Bonanno, 2005).
able to show that many life events are detrimental to our life satisfaction and mental health. However, for some life events – for example, becoming seriously injured/ill or becoming a victim of physical violence – the negative effects associated with these life events are significantly smaller for individuals with a strong internal locus of control.
2. Background literature
2.1.Psychological resilience and hedonic capital
Over the last two decades, George Bonanno and his colleagues at the Loss, Trauma, and Emotion Lab have almost single-handedly dominated the field of research of people’s propensity for psychological resilience (for a recent review of progress, see Southwick et al., 2014). One of their long-standing research agendas is to empirically establish factors – which may be genetic, epigenetic, developmental, demographic, cultural, economic, or social – that determine psychological resilience and explain why some groups of people may be more resilient than others.
The econometric evidence of individual differences among emotional responses to negative life events is well established. For example, using a latent growth mixture model as an empirical strategy to identify heterogeneity in long-term stress responses, Mancini et al. (2011) report that approximately 59% of the people in their German sample scarcely experienced any emotional loss to the death of a loved one (i.e., their life satisfaction remained relatively high pre- and post-loss), whereas approximately 21% experienced a significant drop in their life satisfaction and then a gradual improvement toward the pre-loss level. In Mancini et al.’s study, 71% of the sample did not report any significant changes in their life satisfaction at the year of divorce, and only 19% experienced a moderate decrease in their subjective well-being. Zhu et al. (2014), using the Health and Retirement Study survey, report that 72% of people experienced zero or minimal depression symptoms prior to, and following, chronic pain onset.2
What explains why some groups of individuals are more resilient than others? There is little economic theory in this area. One notable exception is Graham and Oswald (2010), who sketched out a theory in which psychological resilience is conceptualized as a byproduct of how much stock of hedonic capital the individual
2 For more evidence, see Galatzer-Levy and Bonanno (2013), Lotterman et al. (2014), and Orcutt et al.
has accumulated over the years. According to Graham and Oswald, the definition of hedonic capital may include
social relationships with partners, friends and colleagues; health … self-esteem; status; and meaningful work. For some people, religious faith may also play a part. These things are stocks in that they rely on past inputs and are carried across time periods. (p. 373)
This implies that our ability to cope with stress and adversity is determined by the current level of our hedonic capital, which has since been shown to be empirically consistent across types of shocks and types of psychological resources, including the respondent’s level of religiosity (Clark and Lelkes, 2005), personality traits (Boyce and Wood, 2011), and childhood experiences (Powdthavee, 2014).
2.2.Locus of control, beliefs, and coping strategy
Conversely, psychologists explain evidence of heterogeneity in psychological resilience as an outcome of individual differences in the efficacy of regulatory strategies (Bonanno and Burton, 2013). Basically, this is the idea that preferences for various coping strategies tend to vary significantly among people and situations. Because some coping strategies have been shown to be more effective for some situations than others (Folkman and Moskowitz, 2004), individuals’ decision on whether or not to invest in the more suitable strategies is therefore paramount to the rate of success in people’s coping process. For example, in preparation for an examination, students are advised to engage in problem-focused coping prior to the exam, and to practice “distancing” themselves while waiting for their results
(Folkman and Lazarus, 1985). By contrast, when dealing with bereavement, it may be more effective for the bereaved initially to adopt some palliative coping strategy to deal with the loss and then later to engage in a more instrumental coping strategy to deal with future plans (Stroebe and Schut, 2001).
those with an external locus of control, such as actively looking for solutions rather than relying solely on emotional support (e.g., Butterfield, 1964; Pearlin and
Schooler, 1978; Gianakos, 2002; Ng et al., 2006). In situations amenable to change, persons with an internal locus of control have also been found to use more direct coping efforts and fewer attempts of suppression, whereas externally oriented persons show the reverse pattern (Parkes, 1984). In addition, there is evidence that people’s expectations of self-control over their environment play a mediating role in their adaptation process and that individuals with internal locus of control are better adjusted than individuals with external locus of control (Benson and Deeter, 1992).
Given the evidence that individuals who have internal locus of control tend to be more proactive at finding solutions for their problems, it is likely that they will also search more intensively for the most effective coping strategies for a specific situation than individuals who are more external in their perceived locus of control. As a result, there is evidence that people with an internal locus of control tend to suffer less from severe psychiatric disorders (Lefcourt, 1976), particularly from chronic depression (Abramson et al., 1978) and post-traumatic stress disorder (Solomon et al., 1988), and that reported well-being is generally higher among people with a strong internal locus of control (Huebner, 1991; Menec and Chipperfield, 1997; Judge et al., 1998).
However, given that previous studies in psychology tend to be based on small cross-sections of either students or employees working in specific firms, the extent of any heterogeneity in psychological resilience by locus-of-control type continues to be imperfectly understood. Our study aims to fill this research void by using a nationally representative dataset to estimate systematically the longitudinal relationship between locus of control and psychological resilience for various measures of subjective well-being and for various types of negative life events.
3. Data
The data comes from Waves 1-13 of the longitudinal Household Income and Labour Dynamics in Australia (HILDA) Survey –– and have been extracted using PanelWhiz (Hahn and Haisken-DeNew, 2013)3. The members of 7682 households who
3 Wave 1 is omitted from our main analysis simply because questions on life events are only available
participated in first wave (Wooden et al., 2002)4 form the basis of the panel pursued
in subsequent annual survey waves. Interviews are conducted with all adults (defined as persons 15 years of age or older) who are members of the original sample and any other adults who, in later waves, are residing with an original sample member. Annual re-interview rates (the proportion of respondents from one wave who are successfully interviewed in the next wave) are reasonably high, rising from 87% in Wave 2 to over 96% by Wave 9 (see Watson and Wooden, 2012).
Our dependent variables originate from responses in every wave to (i) one question about overall life satisfaction and (ii) a series of questions about mental health (SF-36). The life satisfaction question reads: “All things considered, how satisfied are you with your life? Pick a number between 0 and 10 to indicate how satisfied you are.” A visual aid is used in the administration of these questions and involves a pictorial representation of the scale with the extreme points labeled “totally dissatisfied” and “totally satisfied.” By definition, life satisfaction is constructed with an aim to elicit the respondent’s past, present, and future global well-being (Diener et al., 1985). It has been shown in the literature to represent a measure of cognitive well-being as opposed to affective well-well-being.
The mental health questions ask individuals “How much of the time during the past four weeks: a) Have you been a nervous person; b) Have you felt so down in the dumps that nothing could cheer you up; c) Have you felt calm and peaceful; d) Have you felt down; e) Have you been a happy person?” The responses to these questions range from “1. None of the time” to “6. All the time”. Responses to these questions are then recoded and transformed into a 0-100 index to form the mental health variable, with a scale that ranges from 0 “worst possible mental health” to 100 “best possible mental health.” The SF-36 Mental Health construct has been shown by medical scholars and other researchers to be a good proxy for an individual’s usual state of mental well-being (see, e.g., McHorney et al., 1993).
Other variables used in the analysis are asked in a consistent manner every year, with the exception of the locus-of-control variables (asked only in 2003, 2004, 2007, and 2011) and the Big Five personality traits (asked only in 2005, 2009, and 2013).5
4 For details on the top-up sample and the HILDA Survey in general, see Watson and Wooden (2013). 5 To have the personality traits (Big 5) available for all years, we use the average of all available Big
To define locus of control, we follow Cobb-Clark and Schurer (2013) and use responses to seven questions, each of which is answered by a score ranging from 1 (strongly disagree) to 7 (strongly agree). The questions are: (1) I have little control over the things that happen to me; (2) There is really no way I can solve some of the problems I have; (3) There is little I can do to change many of the important things in my life; (4) I often feel helpless in dealing with the problems of life; (5) Sometimes I feel that I’m being pushed around in life; (6) What happens to me in the future mostly depends on me; and (7) I can do just about anything I really set my mind to do. We compute the locus-of-control score by adding the responses to questions 1 through 5, subtracting the scores from questions 6 and 7, and adding a constant of 16. Using this metric, the locus-of-control variable ranges between 7 (internal) and 49 (external). A similar index has been used in Andrisani (1977), Pearlin and Schooler (1978), Semykina and Linz (2007), and Caliendo et al. (2015). For ease of interpretation, we reverse these scores so that a higher value represents relatively more internal locus of control.
The negative life event variables are taken from responses to the
self-completed life event questions, which are available from Wave 2 (2002) onward. In particular, we focus on the following negative life events that the individual may have experienced in the last 12 months:
(i) Death of a close friend
(ii) Death of close family members, including spouse and child (iii) Major worsening in finances
(iv) Fired from job or made redundant (v) Serious injury/illness to family members (vi) Serious personal injury/illness
(vii) Close family member detained in jail (viii) Victim of a property crime
(ix) Separated from spouse (x) Victim of physical violence.
4. Empirical strategy
Let us assume that there exists a well-being function of the form
where r denotes some self-reported number or level of well-being collected in the survey. The f(…) function is the individual’s true well-being and is observable only to the person asked; h(.) is a non-differentiable function that relates actual to reported well-being; n is a vector of negative life events that either took place in the
respondent’s life or in that of his/her close friends or relatives; l is the respondent’s locus of control; x represents a set of individual characteristics; t is time trend; and e
is an error term that subsumes the respondent’s inability to communicate accurately his/her well-being level. Here, one of the key assumptions is that negative life events significantly reduce the respondent’s well-being, at least in the short run. However, these negative effects are moderated by how much the respondents believe that they can influence their environment and influence the events affecting them. The empirical counterpart of (1) can be written out as
𝑊𝑖𝑡 = 𝛼 + 𝛽0𝑙𝑖𝑡+ ∑10𝑠=1𝑛𝑠𝑖𝑡𝛽𝑠+∑10𝑠=1(𝑛𝑠𝑖𝑡× 𝑙𝑖𝑡)𝛾𝑠+ 𝑥𝑖𝑡′𝜆 + 𝑇𝑡+ 𝑢𝑖+ 𝑒𝑖𝑡
(2) where 𝑊𝑖𝑡 represents either life satisfaction or mental health of individual i at time t;
𝑇𝑡 is dummies for survey year (i.e., 2003 to 2012); and 𝑢𝑖 is the unobserved individual fixed effects. The subscript s denotes a particular type of (negative) shock.
One issue with (2) is that locus of control, 𝑙𝑖𝑡, is potentially endogenous in the life satisfaction regression equation. According to Cobb-Cark and Schurer (2013), locus of control has been found to be most stable among working-age individuals and is mostly unrelated to changes in life events. Our own analysis appears to confirm their findings.6 In addition, it is also possible that any observed relationship between
changes in life satisfaction and changes in locus of control are due to both measures sharing common measurement errors over time rather than being causally related to each other.
In an attempt to solve part of this endogeneity problem, we first estimate the following locus-of-control regression equation on the unbalanced subsample of all working-age individuals (21 to 59 years old) who responded to the locus-of-control questions in at least two of waves 3, 4, 7, and 11 (“Sample 1”) while retaining almost the same set of explanatory variables used for (2)7
6 We refer readers to Table 2A in the Appendix for coefficients on the determinants of changes in locus
of control.
7 The only main difference between the right-hand sides of (2) and (3) is the absence of locus of
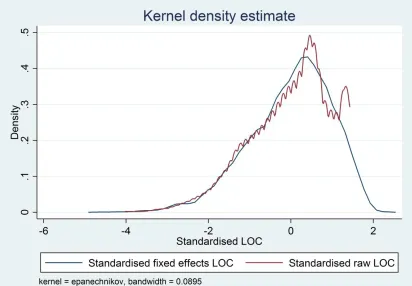
𝑙𝑖𝑡 = 𝛿 + ∑10𝑠=1𝑛𝑠𝑖𝑡𝜃𝑠+𝑥𝑖𝑡′𝜋 + 𝑇𝑡+ 𝜔𝑖+ 𝜀𝑖𝑡. (3) From estimating (3), we are able to obtain the “individual fixed effects,” 𝜔𝑖, or the time-invariant locus of control that is orthogonal to changes in negative life events and the respondent’s socio-economic status. This individual specific constant, or fixed effect, is then standardized and used in the estimation of (2) instead of the raw locus of control, 𝑙𝑖𝑡. A plot of the distribution of this standardized fixed effect 𝜔𝑖 against its pooled raw data counterpart 𝑙𝑖𝑡 can be seen in Fig. 1. Equation (2) thus becomes
𝑊𝑖𝑡 = 𝛼 + 𝛽0𝜔𝑖 + ∑10𝑠=1𝑛𝑠𝑖𝑡𝛽𝑠+∑10𝑠=1(𝑛𝑠𝑖𝑡× 𝜔𝑖)𝛾𝑠+ 𝑥𝑖𝑡′𝜆 + 𝑇𝑡+ 𝑢𝑖 + 𝑒𝑖𝑡 (4) where 𝜔𝑖 is unexplained, person-specific locus of control obtained from estimating (3). We estimate (4) using a within estimator on the full sample of all working-age individuals across all waves 2–13 (“Sample 2”).8 In doing this, we note that the 𝜔
𝑖
will drop out, but the interactions with the negative shocks will remain. Note also that
𝐶𝑂𝑉(𝜔𝑖, 𝑛𝑠𝑖𝑡) = 0 by design. Given that many of these events are closely related (e.g. unemployment and worsening of finances), we followed Cobb-Clark and Schurer’s (2014) empirical strategy and estimate (4) separately for each of the ten negative life events.
To aid the interpretation of the coefficients in our fully interacted model, we standardize both the outcome variable and the locus of control variable to have a mean of 0 and a standard deviation of 1. This implies that we can interpret the coefficient on a negative life event s, 𝛽𝑠, as the well-being effect of this life event on respondents who have an average locus of control – that is, whose standardized locus of control is equal to 0 – and 𝛽𝑠+ 𝛾𝑠 as the well-being effect of this life event on respondents whose standardized locus of control is one standard deviation above the mean.
For ease of interpretation, all of our estimation is carried out using either a random-effects or a fixed-effects linear model with cluster-robust standard errors (clustered at the individual level) (Cameron and Miller, 2013) 9.
8 Allowing for an extensive set of control variables, we have 29 242 observations (12 047 unique
individuals) in Sample 1. In Sample 2 we are able to maintain 87 005 observations with the same number of individuals. Summary statistics of all variables used in the analysis can be found in Table 1A in the Appendix.
9 Following the work by Ferrer-i-Carbonell and Frijters (2004), it should be stated here that it makes
5. Results
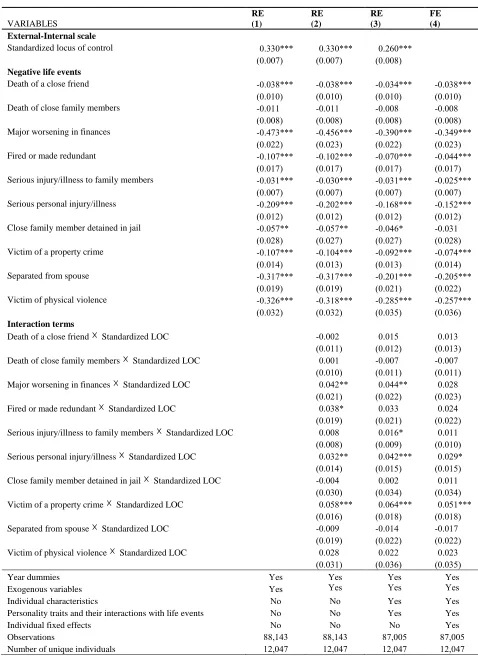
Table 2 presents our first estimates from the random-effects and fixed-effects micro-econometric models of life satisfaction, with unexplained, person-specific locus of control shown on the right-hand side (i.e., the estimated ωi from (3)). The dependent
variable is standardized self-reported satisfaction with life as a whole. Exogenous variables consist of that appears in the random-effects regressions. Individual characteristics include log of real disposable personal income and dummies for
current labor market status, marital status, highest completed education level, and
homeownership status, self-assessed health, and total number of resident and
non-resident children. We also include each of the within-person average of the Big Five
personality traits (extraversion, agreeableness, conscientiousness, emotional stability,
and openness to experience), as well as their interactions with the negative life events,
to allow for the possibility that the well-being effects of the negative life events on
life satisfaction vary among people by different personality types rather than by
different locus-of-control types.10
Column 1 of Table 2 presents simple random-effects regressions in which the only right-hand side variables are standardized locus of control, each of the ten negative life events entered separately, a set of exogenous control variables, and year dummies. Standardized locus of control, in which a positive deviation from the mean indicates a relatively more internalized person, and a negative deviation from the mean indicates a relatively more externalized person, enters the life satisfaction regression equation in a positive and statistically well-defined manner.11 This implies
that individuals who are relatively more internalized in their perceived locus of control tend to report higher levels of life satisfaction than individuals who are relatively more externalized, consistent with previous findings in this area (Huebner, 1991; Menec and Chipperfield, 1997; Judge et al., 1998). The estimated partial correlation appears to be moderately sizeable for a variable in a life satisfaction
much more important for researchers to allow for individual fixed effects in their econometric model, which is something we are able to do in our study.
10 Although personality traits have generally been shown to be relatively stable over time (Cobb-Clark
and Schurer, 2012), other studies have shown them to be powerful predictors of within-person changes in life satisfaction (Boyce et al., 2013).
11 Although there are ten separate coefficients on “Standardized LOC” from estimating (4) separately
regression model; a 1 standard deviation increase in locus of control is associated with an approximately 0.3 standard deviation increase in life satisfaction.
Regarding the negative life events that took place within the last twelve months, we can see that nine out of ten events (with the exception of death of close family members) are negatively and statistically significantly related to life
satisfaction. The ranking of the partial correlations between life satisfaction and negative life events is in the following order: major worsening in finance (−0.473), victim of physical violence (−0.326), separated from spouse (−0.317), serious personal injury/illness (−0.209), victim of a property crime (−0.107), fired from job or made redundant (−0.107), close family member detained in jail (−0.057), death of a close friend (−0.038), serious injury/illness to family members (−0.031), and death of close family members (−0.011).
Column 2 of Table 2 introduces the interaction terms between standardized locus of control and each of the ten negative life events as regressors in the random-effects regression equation. Of the ten interaction coefficients, three (major worsening in finances, serious personal injury/illness and victim of a property crime) are positive and statistically significant at least at the 5% level. This implies that the effects of these three life events on life satisfaction are statistically significantly less negative for individuals who are relatively more internal in their perceived locus of control than the mean. Qualitatively similar results are obtained in Column 3 of Table 2 when we control for individual characteristics as well as the Big Five personality traits and their individual interaction terms with each of the negative life events.
Finally, in Column 4 of Table 2 we correct for any unobserved heterogeneity bias at the individual level, that is, the presence of 𝑢𝑖, by introducing individual fixed effects into the linear estimation of (2). Because locus of control is person-specific and time-invariant by design, it naturally drops out from the estimation.
the estimated coefficient on the main effect of being a victim of a property crime, we can see that its effect on life satisfaction for a person with an average locus of control is −0.074 [𝑆. 𝐸. = 0.014]. However, for a person who is one standard deviation more internal in the perceived locus of control scale than the average, the effect is
approximately one half of the effect experienced by a person with an average locus of control at −0.074 + 0.051 = −0.023 [𝑆. 𝐸. = 0.019].
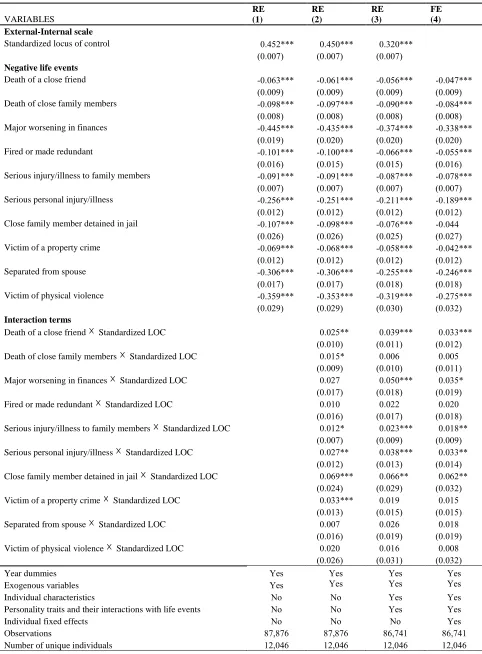
In Table 3 we re-estimate the specifications of Table 2 with standardized mental health (SF-36) as the outcome variable. In the full specification model with individual fixed effects, we can see that nine out of ten life events have negative and statistically important main effects on the respondent’s mental health (with the exception of close family member detained in jail). However, it appears that the psychic costs for four life events (death of close friends, serious personal
injury/illness, close family member detained in jail, and victim of a property crime) are statistically significantly moderated – at least at the 5% confidence level – by internal locus of control. For example, the average well-being effect of losing a close friend is almost completely offset for a person who is one standard deviation more internal in the perceived locus of control scale, that is, −0.047 + 0.033 =
−0.014 [𝑆. 𝐸. = 0.015]. In addition, there is some weaker evidence that major worsening in finances may also hurt less for relatively more internal locus of control individuals; the coefficient on the interaction between locus of control and “Major worsening in finances” is 0.035 [𝑆. 𝐸. = 0.019]. The estimated effects of various life events on both measures of subjective well-being for (i) a person with an average locus of control and (ii) a person whose locus of control is one standard deviation higher than the average are better illustrated in Fig. 2A and Fig. 2B.
Therefore, to summarize the results of Table 2 and Table 3, there is evidence to suggest that internal locus of control acts as a psychological buffer against some but certainly not all types of negative life event.
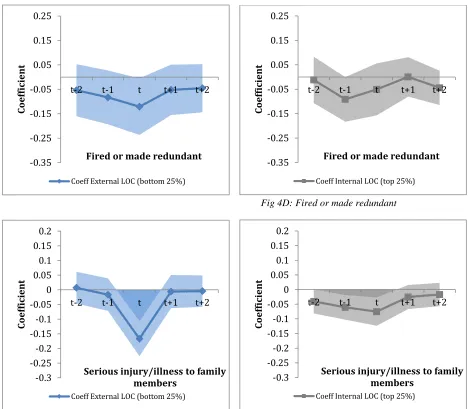
represent (i) people who are placed at the bottom 25% of the external–internal locus-of-control scale, that is, the strongly externalized, and (ii) people who are placed at the top 25% of the external–internal locus-of-control scale, that is, the strongly internalized. Doing this allows us to compare the well-being dynamics – measured before, during, and after the onset of each life event – between people with a strong external locus of control and people with a strong internal locus of control. We then estimate this new equation using the fixed-effects estimator on a sample in which at least five years of life satisfaction and mental health are consecutively observed (because of the need to go backward two periods and forward two periods). Our empirical strategy here is similar to that adopted by Clark et al. (2008), Frijters et al. (2011), and Powdthavee (2012). Given that the table produced a large number of coefficients, we choose to present only the graphical representations of the implied dynamic effects of each life event on life satisfaction and mental health for people at the different ends of locus-of-control distribution in Fig. 3 and Fig. 4, respectively.
Some interesting patterns emerge when we compare the well-being dynamics before and after each of the ten life events. For example, we can see a statistically significant drop beyond zero in life satisfaction at the year of reporting to be a victim of a property crime for individuals with a strong external locus of control (i.e., the bottom 25% of external–internal locus-of-control scale), but not for those with a strong internal locus of control (i.e., the top 25% of external–internal locus-of-control scale). A similar pattern is also observed with respect to individual’s mental health in the years leading to and following a death of a close friend; there is a significant drop in mental health for individuals with a strong external locus of control, but not for those with a strong internal locus of control. People with a strong external locus of control also experienced a significant dip into the negative in both life satisfaction and mental health at the year of becoming seriously injured/ill and at the year of becoming a victim of physical violence, whereas the drops in well-being experienced by people with a strong internal locus of control are either not as negative or statistically
insignificantly different from zero. In short, although Figures 3 and 4 confirm our previous results that locus of control acts as a psychological buffer to some adverse events in the short run, we find that in the long-run hedonic adaptation to different negative life events is mostly completed for both groups of individuals.
well-being effects from the majority of the ten life events are negative and statistically significant for both males and females.
With respect to life satisfaction, internal locus of control acts as psychological insurance against only one life event for women and against three life events for men. For women, the life event is being fired from a job or made redundant. For men, it appears that internal locus of control actually buffers the negative effects arising from becoming seriously injured or ill, having a close family member detained in jail, and becoming a victim of a property crime. Interestingly, for women, internal locus of control amplifies the negative well-being effect from having a close family member detained in jail – although the estimated negative interaction effect is only marginally significant at the 10% level. What this seems to suggest is that females who have internal locus of control may be more likely to blame themselves or feeling guilt or shame for not having prevented the incarceration of a close relative, whereas females who have external locus of control would consider the incarceration of the family member to be inevitable and so would not feel personal blame, shame, or guilt.
In terms of mental health, relatively more internalized men, but not women, are buffered psychologically from death of a close friend, major worsening in finances, and becoming seriously injured/ill. This implies that, although the main effects of the life events are generally qualitatively similar across male and female subgroups, there is some noticeable heterogeneity by gender with respect to the extent in which internal locus of control moderates these negative effects. 12
6. Discussions
Our results indicate some benefits to having a strong internal locus of control in the face of adversity. Yet, despite our preferred interpretation of these results being that individuals with a strong internal locus of control are more likely to react to a problem by actively looking for solutions rather than relying solely on emotional support (e.g., Butterfield, 1964; Gianakos, 2002; Ng et al., 2006), we still cannot rule out other potential explanations for our findings. We list some of our caveats and other testable hypotheses on the possible mechanisms here.
12 One natural objection is that people with external locus of control may drop out more frequently
One hypothesis is that individuals with a strong internal locus of control may endogenously select themselves into some types of events that would normally be considered negative by normative standards. For instance, because uncertain outcomes feel less certain to people with a strong internal locus of control, it is conceivable that they may be much more risk-loving than people with a strong external locus of control (see, e.g., Salamanca et al., 2013), which may lead to the former reporting the experience of “major worsening in finances” (through risk investments) and/or “becoming seriously injured/ill” (through risky lifestyles) than the latter. However, the treatment effect on these individuals’ well-being is unlikely to be the same as for individuals who may not have selected themselves into making risky investments or into a risky situation.
To test whether individuals who are relatively more internal in their perceived locus of control are also more likely to make risky investments, Table 5 estimates separately by gender a set of random effects regression equations in which the
dependent variable is standardized individual’s willingness to take financial risks with their spare cash13. Consistent with Salamanca et al. (2013), who demonstrated using
Dutch data, we find that individuals with internal locus of control are, on average, more likely than individuals with external locus of control to take substantial financial risks with an expectation of receiving substantial financial returns. This result,
noticeably stronger for men, is robust to controlling for negative life events and other individual characteristics. In other words, negative life events such as “Major
worsening in finances” and “Serious personal injury/illness” are more likely to occur – and therefore expected – among individuals with a relatively strong internal locus of control, thus explaining in part why these events may “hurt” these individuals less compared to those who are less likely to select themselves into experiencing these life events.
13 There are two different variables on willingness to take financial risks: FIRISK and FIRISKA.
Another alternative explanation is that people with a strong internal locus of control tend to invest early and more intensively in accumulations of human capital, health capital, and social capital than people within a strong external locus of control (see, e.g., Coleman and DeLeire, 2003; Cobb-Clark et al., 2014), and this may act as an indirect psychological insurance against future shocks. This would be more consistent with the idea of “hedonic capital,” or the theory that people with a large stock of psychological resources tend to be more resilient in general (Graham and Oswald, 2010; see also Powdthavee, 2014). In other words, it is possible that the moderation effects observed in our study are caused by long-run lagged impacts of early accumulations of these hedonic capitals rather than short-run contemporaneous impacts of internal locus of control, which has so far been our preferred interpretation of the estimated interaction effects.
To test whether people with an internal locus of control have higher levels of accumulated psychological resources than individuals with an external locus of control, Tables 6 and 7 estimate separately by gender a set of random effects and fixed effects regressions in which the dependent variables are standardized responses to the question: “How often the respondent get together socially with friends/relatives not living in the same household?” (LSSOCAL).14 We also include as independent
variables a set of interactions between individual’s locus of control and negative life events in order to test whether individuals with a strong internal locus of control also benefit more from their stock of social capital following a negative life shock.
Looking across columns of both Tables 6 and 7, we can see from the random effects regressions that men and women with a relatively stronger internal locus of control tend to socialize more with their friends and/or relatives not living with them. We find little evidence to suggest that either men or women with an internal locus of control see more of their friends and/or relatives following a major life shock – although this is probably due partly to the way the question on seeing friends was phrased in HILDA (i.e. most people are probably less likely to get together socially with friends and/or relatives following a major negative life event, regardless of their locus of control).
The estimates in Tables 5, 6 and 7 imply that our original findings may have been significantly confounded by omitting individual’s attitudes toward risks and the
14 The LSSOCAL question appeared in every wave in HILDA, with the possible responses range from
extent of social capital from the well-being equation. Nevertheless, we find that allowing for individual’s willingness to take financial risks and the extent of social capital in the fixed effects life satisfaction and mental health regressions does very little to change the estimates obtained from an estimation that does not condition for both variables in the regression.15
Table 8 carried out – as suggested by a referee – an additional check on the possible heterogeneous effects of positive life events on well-being by individual’s perceived locus of control. One hypothesis is that, in addition to the buffering effect of internal luck of control on negative life shocks, individuals with an internal locus of control may also be more elated by a positive life event simply because they would have attributed the good fortunes to their own actions. However, we could only find evidence to suggest the opposite. Looking across Table 8’s columns, we can see that the positive effect of a major improvement in finances on life satisfaction is
significantly reduced for women with a strong internal locus of control, while the positive effect of being promoted at work on mental health is significantly reduced for men with a strong internal locus of control. In other words, it appears that people with a strong internal locus of control are not only psychologically insured against some negative life shocks, but they are also less likely to experience a large increase in their well-being following certain positive life events. We cannot be certain why having internal locus of control moderates (rather than amplifies) the well-being effect of a positive life event, but one reason could be that these positive life events (e.g. major improvement in finances and promotion at work) tend to be anticipated by individuals with an internal locus of control. However, it seems likely that future research will have to return to this issue.
Finally, one referee suggested that it might be worth to improve the timing of each life event in our analysis by utilizing the quarterly timing data available in the HILDA. In addition to asking individuals whether each life event happened during the past 12 months, if the person answered ‘YES’ then he/she would have also been asked to indicate how long ago the event happened or started. The information is then given
15 See Table 4A in the Appendix for the fixed effects estimates. Note the reduced sample size from
by quarter16. As a check, we re-estimated our main regression equations with the
quarterly data and reported the results in Table 5A in the Appendix. We find that, in a lot of cases – especially when mental health is the outcome of interest, the effect of an adverse life event is notably more negative when it happened closer to the time of the interview. Additionally, we found that for life events that internal locus of control acts as a psychological buffer against (see Tables 3 and 4), the buffering effect tends to be more positive and statistically more robust for those events that happened relatively recently (i.e., 0-3 months prior to the interview) compared to events that happened a while ago (i.e., 10-12 months prior to the interview). However, because these quarterly variables have a significantly smaller cell size compared to the life event variables used in Tables 3 and 4, care must be taken when interpreting the interaction effects between these variables and the interaction effect in a fixed effects regression.
7. Conclusion
In this paper we set out to test the importance of internal locus of control (or self-efficacy) on people’s subjective well-being in the face of adversity. Using unique longitudinal data for Australia, we initially show that individuals with internal locus of control are generally more satisfied with life and have better mental health than those with external locus of control. We are also able to present evidence that an onset of most of the selected negative life events is observed together with a significant dip in both measures of subjective well-being, particularly within 12 months of having experienced a major worsening in finances, becoming seriously injured/ill, separating from spouse, or becoming a victim of physical violence.
However, some evidence indicates that people who are more internal in their perceived locus of control tend to either suffer less from or be entirely indifferent to some negative life events than people who are more external in their perceived locus of control. The internal locus of control’s capacity to buffer against shocks varies by gender, and its marginal benefit is more apparent for people with a strong internal locus of control. Our findings thus contribute to the rapidly expanding literature with new evidence of the benefits of internal locus of control and the importance of non-cognitive skills on people’s lives in general.
16 See Frijters et al. (2011) for an example that utilizes the quarterly timing data of life events in the
Like most papers in social sciences, our study is not without significant limitations. One important caveat is that the observed buffering effects of internal locus of control may simply be due to differences in the actual intensity of the treatment effect (e.g. illness, worsening in finances), which a binary variable cannot capture. For example, it might be the case that a cancer patient and someone who suffers from hypertension would have responded to the “serious personal
injury/illness” in the same way (for a discussion of this particular issue, see, e.g., Schurer, 2014). Another natural objection to our results will always be that internal locus of control is not randomized across the sample. Although our fixed-effects estimation may have taken care of the unobserved person-specific characteristics that correlate simultaneously with internal locus of control and with being more
psychologically resilient to some life events, we still do not know enough about what may have caused someone to be relatively more internal in their perceived locus of control in the first place. This is a difficult question to address, given that we are not able to influence people’s locus of control through a randomized control trial (or to find an appropriate variable to instrument for locus of control) prior to them
Acknowledgement
For detailed suggestions, we are deeply grateful to Nikhil Jha, Stefanie Schurer, Mark
Reference
Abramson, L.Y., Seligman, M.E., and Teasdale, J.D. 1978. Learned helplessness in humans: Critique and reformulation. Journal of Abnormal Psychology, 87, 49-74. Andrisani, P. 1977. Internal-external attitudes, personal initiative, and the labor market experience of white and black men. Journal of Human Resources, 12(3), 308-328.
Barrick, M.R. and Mount, M.K. 1991. The big five personality dimensions and job performance: A meta-analysis. Personnel Psychology, 44, 1-26.
Benson, L.T. and Deeter, T.E. 1992. Moderators of the relation between stress and depression in adolescents. School Counselor, 39, 189-194.
Bonanno, G.A. 2005. Resilience in the face of potential trauma. Current Directions in Psychological Science, 14, 135-138.
Bonanno, G.A. 2013. How prevalent is resilience following sexual assault? Journal of Traumatic Stress, 26, 1-2.
Bonanno, G.A. and Burton, C.L. 2013. Regulatory flexibility: An individual differences Perspective on coping and emotion regulation. Perspectives on Psychological Science, 8(6), 591-612.
Bonanno, G.A., Wortman, C.B., Lehman, D.R., Tweed, R.G., Haring, M., Sonnega, J., et al. 2002. Resilience to loss and chronic grief: A prospective study from preloss to 18-months postloss. Journal of Personality and Social Psychology, 83, 1150-1164. Bonanno, G.A., Rennicke, C., and Dekel, S. 2005. Self-enhancement among high-exposure survivors of the September 11th terrorist attack: Resilience or social maladjustment? Journal of Personality and Social Psychology, 88, 984-998 Bowles, S.; Gintis, H., and Osborne, M. 2001. Incentive-enhancing preferences: Personality behaviour and earning. American Economic Review, 91, 155-158. Boyce, C.J. and Wood, A.M. 2011. Personality prior to disability determines adaptation: Agreeable individuals recover lost life satisfaction faster and more completely. Psychological Science, 22, 183-191.
Caliendo, M., Cobb-Clark, D.A., and Uhlendorff, A. 2015. Locus of control and job search strategies. Review of Economics and Statistics, 97(1), 88-103.
Cameron, C.A. and Miller, D.L. 2013. A practitioner’s guide to cluster-robust inference. University of California, Davis, mimeo.
Clark, A.E., Diener, E., Georgellis, Y., and Lucas, R.E. 2008. Lags and leads in life satisfaction: a test of the baseline hypothesis. Economic Journal, 118(529), F222- F243.
Clark, A.E. and Lelkes, O. 2005. Deliver us from evil: Religion as insurance. Paris School of Economics, manuscript.
Cobb-Clark, D.A. 2015. Locus of control and the labour market. IZA Journal of Labor Economics, 4(3).
Cobb-Clark, D.A. and Schurer, S. 2012. The stability of big-five personality traits.
Economics Letters, 115(1), 11-15.
Cobb-Clark, D.A., Kassenboehmer, S., and Sinning, M.G. 2013. Locus of control and savings. IZA Discussion Paper No. 7837, University of Bonn.
Cobb-Clark, D. A., Kassenboehmer, S. C., and Schurer, S. 2014. Healthy habits: The connection between diet, exercise, and locus of control. Journal of Economic
Behavior & Organization, 98, 1-28.
Cobb‐ Clark, D. A. and Schurer, S. 2013. Two economists' musings on the stability of locus of control. The Economic Journal, 123(570), F358-F400.
Coleman, M. and DeLeire, T. 2003. An economic model of locus of control and the human capital investment decision. Journal of Human Resources, 38(3), 701-721. Diener, E., Emmons, R.A., Larsen, R.J., and Griffin, S. 1985. The satisfaction with life scale. Journal of Personality Assessment, 49, 71-75.
Dolan, P. and Kahneman, D. 2008. Interpretations of utility and their implications for the valuation of health. Economic Journal, 118(525), 215-234.
Ferrer-i-Carbonell, A. and Frijters, P. 2004. How important is the methodology for the estimates of the determinants of happiness? Economic Journal, 114(497), 641-659. Folkman, S. and Lazarus, R.S. 1985. If it changes it must be a process: Study of emotion and coping during three states of a college examination. Journal of Personality and Social Psychology, 48, 150-170.
Frijters, P., Johnston, D.W., and Shields, M.A. 2011. Life satisfaction dynamics with quarterly life event data. Scandinavian Journal of Economics, 113(1), 190-211. Galatzer-Levy, I.R. and Bonanno, G.A. 2013. Heterogeneous pattern of stress over the four years of college: Associations with anxious attachment and ego-resiliency.
Journal of Personality, 81(5), 476-486.
Gianakos, I. 2002. Predictors of coping with work stress: The influences of sex, gender roles, social desirability, and locus of control. Sex Roles, 46, 149-158. Graham, L. and Oswald, A. J. 2010. Hedonic capital, adaptation and resilience.
Journal of Economic Behavior & Organization, 76(2), 372-384.
Hahn, M. and Haisken-DeNew, J. 2013. Panel Whiz and the Australian Longitudinal
Data Infrastructure in Economics. Australian Economic Review, 46, 379-86.
Heckman, J.J., Stixrud, J., and Urzua, S. 2006. The effects of cognitive and noncognitive skills on human capital and social behaviours. Journal of Labor Economics, 24, 411-482.
Heineck, G. 2011. Does it pay to be nice? Personality and earnings in the UK.
Industrial and Labor Relations Review, 64(5), 1020-1038.
Huebner, E. S. 1991. Correlates of life satisfaction in children. School Psychology Quarterly, 6(2), 103.
Judge, T. A., Locke, E. A., Durham, C. C., and Kluger, A. N. 1998. Dispositional effects on job and life satisfaction: the role of core evaluations. Journal of applied psychology, 83(1), 17-34.
Kahneman, D. and Sugden, R. 2005. Experienced utility as a standard of policy evaluation. Environmental and Resource Economics, 32(1), 161-181.
Lefcourt, H.M. 1976. Locus of control: Current trends in theory and research. New York: Halstead Press.
Lekfuangfu, W. N., Cornaglia, F., Powdthavee, N., and Warrinnier, N. 2014. Locus of Control and Its Intergenerational Implications for Early Childhood Skill Formation. IZA Discussion Paper No. 8487, University of Bonn.
Lotterman, J.H., Bonanno, G.A., and Galatzer-Levy, I. 2014. The heterogeneity of long-term grief reactions. Journal of Affective Disorders, 167, 12-19.
McHorney, C.A., Ware Jr, J.E., and Raczek, A.E. 1993. The MOS 36-Item Short-Form Health Survey (SF-36): II. Psychometric and clinical tests of validity in measuring physical and mental health constructs. Medical care, 247-263.
McGee, A. 2015. How the perception of control influences unemployed job search.
Industrial and Labor Relations Review, 68(1), 184-211.
Menec, V. H. and Chipperfield, J. G. 1997. Remaining active in later life the role of locus of control in seniors' leisure activity participation, health, and life satisfaction.
Journal of Aging and Health, 9(1), 105-125.
Ng., T.W.H., Sorensen, K.L., and Eby, L.T. 2006. Locus of control at work: a meta-analysis. Journal of Organizational Behavior, 27, 1057-1087.
Orcutt, H.K., Bonanno, G.A., Hannan, S.M., and Miron, L.R. 2014. Prospective trajectories of posttraumatic stress following a campus mass shooting. Journal of Traumatic Stress, 27, 1-8.
Oswald, A. J. and Powdthavee, N. 2008. Death, happiness, and the calculation of compensatory damages. The Journal of Legal Studies, 37(S2), S217-S251. Parkes, K.R. 1984. Locus of control, cognitive appraisal, and coping in stressful situations. Journal of Personality and Social Psychology, 46, 655-668.
Pearlin, L., and Schooler, C. 1978. The structure of coping. Journal of Health and Social Behavior, 19(1), 2-21.
Powdthavee, N. 2012. Jobless, friendless and broke: what happens to different areas of life before and after unemployment? Economica, 79(315), 557-575.
Powdthavee, N. 2014. What childhood characteristics predict psychological resilience to economic shocks in adulthood? Journal of Economic Psychology, 45, 84-101. Rotter, J.B. 1966. Generalized expectancies for internal versus external control of reinforcement. Psychological Monographs: General and Applied, 80(1), 1-28. Salamanca, N., Grip, D. A., Fouarge, D., and Montizaan, R. M. 2013. Locus of control and investment in risky assets. GSBE Research Memorandum, 52.
Salgado, Jesús F. 1997. The five factor model of personality and job performance in the European community. Journal of Applied Psychology, 82, 30-43.
Schurer, S. 2014. Bouncing back from health shocks: Locus of control, labor supply, and mortality. IZA Discussion Paper 8203.
Solomon, Z., Mikulincer, M., and Avitzur, E. 1988. Coping, locus of control, social support, and combat-related posttraumatic stress disorder: A prospective study.
Journal of Personality and Social Psychology, 55(2), 279-285.
Stroebe, M.S. and Schut, H. 2001. Meaning making in the dual process model of coping with bereavement. In Meaning Reconstruction, the Experience of Loss, ed. R.A. Neimeyer, pp. 55-73. Washington, DC: American Psychological Association. Southwick, S.M., Bonanno, G.A., Masten, A.S., Panter-Brick, C., and Yehuda, R. 2014. Resilience definition, theory, and challenges: Interdisciplinary perspectives.
European Journal of Psychotraumatology, 5.
Watson, N. and Wooden, M. 2012. The HILDA Survey: a case study in the design
and development of a successful household panel study. Longitudinal and Life Course
Studies, 3(3), 369-381.
Wooden, M., Freidin, S. and Watson, N. 2002. The Household, Income and Labor
Dynamics in Australia (HILDA) Survey: Wave 1. The Australian Economic Review,
35(3), 339-348.
Zhu, Z., Galatzer-Levy, I.R., and Bonanno, G.A. 2014. Heterogeneous depression responses to chronic pain onset among middle-aged adults: A perspective study.
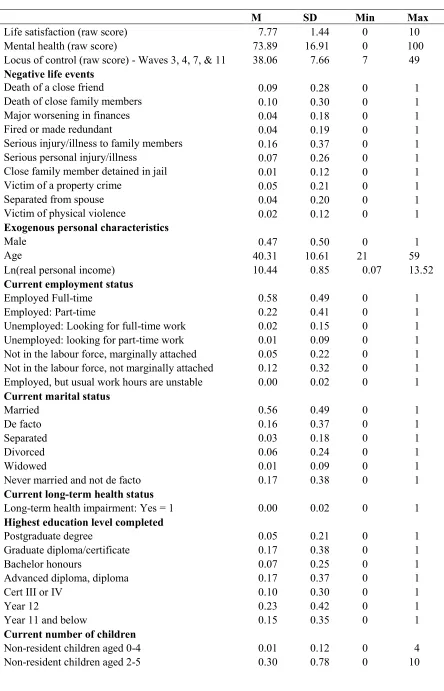
Table 1: Descriptive statistics
M SD Min Max
Life satisfaction (raw score) 7.77 1.44 0 10
Mental health (raw score) 73.89 16.91 0 100
Locus of control (raw score) - Waves 3, 4, 7, & 11 38.06 7.66 7 49
Negative life events
Death of a close friend 0.09 0.28 0 1
Death of close family members 0.10 0.30 0 1
Major worsening in finances 0.04 0.18 0 1
Fired or made redundant 0.04 0.19 0 1
Serious injury/illness to family members 0.16 0.37 0 1
Serious personal injury/illness 0.07 0.26 0 1
Close family member detained in jail 0.01 0.12 0 1
Victim of a property crime 0.05 0.21 0 1
Separated from spouse 0.04 0.20 0 1
Victim of physical violence 0.02 0.12 0 1
Exogenous personal characteristics
Male 0.47 0.50 0 1
Age 40.31 10.61 21 59
Ln(real personal income) 10.44 0.85 0.07 13.52
Current employment status
Employed Full-time 0.58 0.49 0 1
Employed: Part-time 0.22 0.41 0 1
Unemployed: Looking for full-time work 0.02 0.15 0 1
Unemployed: looking for part-time work 0.01 0.09 0 1
Not in the labour force, marginally attached 0.05 0.22 0 1
Not in the labour force, not marginally attached 0.12 0.32 0 1
Employed, but usual work hours are unstable 0.00 0.02 0 1
Current marital status
Married 0.56 0.49 0 1
De facto 0.16 0.37 0 1
Separated 0.03 0.18 0 1
Divorced 0.06 0.24 0 1
Widowed 0.01 0.09 0 1
Never married and not de facto 0.17 0.38 0 1
Current long-term health status
Long-term health impairment: Yes = 1 0.00 0.02 0 1
Highest education level completed
Postgraduate degree 0.05 0.21 0 1
Graduate diploma/certificate 0.17 0.38 0 1
Bachelor honours 0.07 0.25 0 1
Advanced diploma, diploma 0.17 0.37 0 1
Cert III or IV 0.10 0.30 0 1
Year 12 0.23 0.42 0 1
Year 11 and below 0.15 0.35 0 1
Current number of children
Non-resident children aged 0-4 0.01 0.12 0 4
Non-resident children aged 6-14 0.05 0.31 0 6
Non-resident children aged 15-24 0.20 0.55 0 6
Resident children aged 0-4 0.25 0.57 0 4
Resident children aged 2-5 0.03 0.18 0 5
Resident children aged 6-14 0.49 0.86 0 7
Resident children aged 15-24 0.29 0.66 0 7
Current homeownership status
Own home/paying mortgage 0.69 0.46 0 1
Rent or pay board 0.29 0.45 0 1
Involved in a rent-buy scheme 0.00 0.03 0 1
Live here rent free/free tenure 0.02 0.15 0 1
Raw Big Five personality variables (average)
Agreeableness 5.40 0.82 1 7
Conscientiousness 5.10 0.94 1 7
Emotional stability 5.12 0.95 1 7
Extraversion 4.43 1.02 1 7
Table 2: Random effects and fixed effects life satisfaction regression equations with locus of control and negative life events as independent variables
VARIABLES RE (1) RE (2) RE (3) FE (4) External-Internal scale
Standardized locus of control 0.330*** 0.330*** 0.260***
(0.007) (0.007) (0.008)
Negative life events
Death of a close friend -0.038*** -0.038*** -0.034*** -0.038***
(0.010) (0.010) (0.010) (0.010)
Death of close family members -0.011 -0.011 -0.008 -0.008
(0.008) (0.008) (0.008) (0.008)
Major worsening in finances -0.473*** -0.456*** -0.390*** -0.349***
(0.022) (0.023) (0.022) (0.023)
Fired or made redundant -0.107*** -0.102*** -0.070*** -0.044***
(0.017) (0.017) (0.017) (0.017)
Serious injury/illness to family members -0.031*** -0.030*** -0.031*** -0.025***
(0.007) (0.007) (0.007) (0.007)
Serious personal injury/illness -0.209*** -0.202*** -0.168*** -0.152***
(0.012) (0.012) (0.012) (0.012)
Close family member detained in jail -0.057** -0.057** -0.046* -0.031
(0.028) (0.027) (0.027) (0.028)
Victim of a property crime -0.107*** -0.104*** -0.092*** -0.074***
(0.014) (0.013) (0.013) (0.014)
Separated from spouse -0.317*** -0.317*** -0.201*** -0.205***
(0.019) (0.019) (0.021) (0.022)
Victim of physical violence -0.326*** -0.318*** -0.285*** -0.257***
(0.032) (0.032) (0.035) (0.036)
Interaction terms
Death of a close friend Standardized LOC -0.002 0.015 0.013
(0.011) (0.012) (0.013)
Death of close family members Standardized LOC 0.001 -0.007 -0.007
(0.010) (0.011) (0.011)
Major worsening in finances Standardized LOC 0.042** 0.044** 0.028
(0.021) (0.022) (0.023)
Fired or made redundant Standardized LOC 0.038* 0.033 0.024
(0.019) (0.021) (0.022)
Serious injury/illness to family members Standardized LOC 0.008 0.016* 0.011
(0.008) (0.009) (0.010)
Serious personal injury/illness Standardized LOC 0.032** 0.042*** 0.029*
(0.014) (0.015) (0.015)
Close family member detained in jail Standardized LOC -0.004 0.002 0.011
(0.030) (0.034) (0.034)
Victim of a property crime Standardized LOC 0.058*** 0.064*** 0.051***
(0.016) (0.018) (0.018)
Separated from spouse Standardized LOC -0.009 -0.014 -0.017
(0.019) (0.022) (0.022)
Victim of physical violence Standardized LOC 0.028 0.022 0.023
(0.031) (0.036) (0.035)
Year dummies Yes Yes Yes Yes
Exogenous variables Yes Yes Yes Yes
Individual characteristics No No Yes Yes
Personality traits and their interactions with life events No No Yes Yes
Individual fixed effects No No No Yes
Observations 88,143 88,143 87,005 87,005
Number of unique individuals 12,047 12,047 12,047 12,047
Table 3: Random effects and fixed effects mental health regression equations with locus of control and negative life events as independent variables
VARIABLES RE (1) RE (2) RE (3) FE (4) External-Internal scale
Standardized locus of control 0.452*** 0.450*** 0.320***
(0.007) (0.007) (0.007)
Negative life events
Death of a close friend -0.063*** -0.061*** -0.056*** -0.047***
(0.009) (0.009) (0.009) (0.009)
Death of close family members -0.098*** -0.097*** -0.090*** -0.084***
(0.008) (0.008) (0.008) (0.008)
Major worsening in finances -0.445*** -0.435*** -0.374*** -0.338***
(0.019) (0.020) (0.020) (0.020)
Fired or made redundant -0.101*** -0.100*** -0.066*** -0.055***
(0.016) (0.015) (0.015) (0.016)
Serious injury/illness to family members -0.091*** -0.091*** -0.087*** -0.078***
(0.007) (0.007) (0.007) (0.007)
Serious personal injury/illness -0.256*** -0.251*** -0.211*** -0.189***
(0.012) (0.012) (0.012) (0.012)
Close family member detained in jail -0.107*** -0.098*** -0.076*** -0.044
(0.026) (0.026) (0.025) (0.027)
Victim of a property crime -0.069*** -0.068*** -0.058*** -0.042***
(0.012) (0.012) (0.012) (0.012)
Separated from spouse -0.306*** -0.306*** -0.255*** -0.246***
(0.017) (0.017) (0.018) (0.018)
Victim of physical violence -0.359*** -0.353*** -0.319*** -0.275***
(0.029) (0.029) (0.030) (0.032)
Interaction terms
Death of a close friend Standardized LOC 0.025** 0.039*** 0.033***
(0.010) (0.011) (0.012)
Death of close family members Standardized LOC 0.015* 0.006 0.005
(0.009) (0.010) (0.011)
Major worsening in finances Standardized LOC 0.027 0.050*** 0.035*
(0.017) (0.018) (0.019)
Fired or made redundant Standardized LOC 0.010 0.022 0.020
(0.016) (0.017) (0.018)
Serious injury/illness to family members Standardized LOC 0.012* 0.023*** 0.018**
(0.007) (0.009) (0.009)
Serious personal injury/illness Standardized LOC 0.027** 0.038*** 0.033**
(0.012) (0.013) (0.014)
Close family member detained in jail Standardized LOC 0.069*** 0.066** 0.062**
(0.024) (0.029) (0.032)
Victim of a property crime Standardized LOC 0.033*** 0.019 0.015
(0.013) (0.015) (0.015)
Separated from spouse Standardized LOC 0.007 0.026 0.018
(0.016) (0.019) (0.019)
Victim of physical violence Standardized LOC 0.020 0.016 0.008
(0.026) (0.031) (0.032)
Year dummies Yes Yes Yes Yes
Exogenous variables Yes Yes Yes Yes
Individual characteristics No No Yes Yes
Personality traits and their interactions with life events No No Yes Yes
Individual fixed effects No No No Yes
Observations 87,876 87,876 86,741 86,741
Number of unique individuals 12,046 12,046 12,046 12,046
Figures 2A & 2B: The estimated effects of different life events on life satisfaction and mental health for working-age respondents, regression-corrected
Fig.2A: Life satisfaction
Fig.2B: Mental health
Note: 4-standard-error bands (95% C.I.) are reported: 2 above 2 below.
DCF = death of close friends, DCFM = death of close family members, including spouse and children, MWF = major worsening in finances, FMR = fired or made redundant, SFM = serious injury/illness to family members, SPI = serious personal injury/illness, CFIJ = close family member detained in jail, VPC = victim of a property crime, SFS = separated from spouse, VPV = victim of physical violence.
-0.5 -0.4 -0.3 -0.2 -0.1 0 0.1 0.2
DCF DCFM MWF FMR SIFM SPI CFIJ VPC SFS VPV
Ma rgin al effe ct on st and ar d ized life sa tisfa cti on
Marginal effect of the event on an average LOC person + 1 S.D. in external-internal locus of control
-0.5 -0.4 -0.3 -0.2 -0.1 0 0.1 0.2
DCF DCFM MWF FMR SIFM SPI CFIJ VPC SFS VPV
Ma rgin al effe ct on st and ar d ized ment al h ea lt h
Fig 3A-3J: Leads and lags in life satisfaction to negative life events by locus of control type
[image:37.595.92.552.524.724.2]Fig 3A: Death of close friends
Fig 3B: Death of close family members, including spouse/child
Fig 3C: Major worsening in finances
-0.2 -0.15 -0.1 -0.05 0 0.05 0.1 0.15 0.2
t-2 t-1 t t+1 t+2
Coe
fficien
t
Death of close friends
Coeff. Internal LOC (top 25%)
-0.2 -0.15 -0.1 -0.05 0 0.05 0.1 0.15 0.2
t-2 t-1 t t+1 t+2
Coe
fficient
Death of family members
Coeff Internal LOC (top 25%)
-0.5 -0.4 -0.3 -0.2 -0.1 0 0.1 0.2 0.3
t-2 t-1 t t+1 t+2
Coe
fficien
t
Major worsening in finances
Coeff Internal LOC (top 25%) -0.2 -0.15 -0.1 -0.05 0 0.05 0.1 0.15 0.2
t-2 t-1 t t+1 t+2
Coe
fficien
t
Death of close friends
Coeff. External LOC (bottom 25%))
-0.2 -0.15 -0.1 -0.05 0 0.05 0.1 0.15 0.2
t-2 t-1 t t+1 t+2
Coe
fficien
t
Death of family members
Coeff External LOC (bottom 25%)
-0.5 -0.4 -0.3 -0.2 -0.1 0 0.1 0.2 0.3
t-2 t-1 t t+1 t+2
Coe
fficient
Major worsening in finances
Fig 3D: Fired or made redundant
Fig 3E: Serious injury/illness to family members
Fig 3F: Serious personal injury/illness
-0.4 -0.3 -0.2 -0.1 0 0.1 0.2 0.3
t-2 t-1 t t+1 t+2
Coe
fficien
t
Fired or made redundant
Coeff Internal LOC (top 25%)
-0.2 -0.15 -0.1 -0.05 0 0.05 0.1 0.15
t-2 t-1 t t+1 t+2
Coe
fficien
t
Serious injury/illness to family members
Coeff Internal LOC (top 25%)
-0.4 -0.3 -0.2 -0.1 0 0.1 0.2 0.3
t-2 t-1 t t+1 t+2
Coe
fficien
t
Serious personal injury/illness
Coeff Internal LOC (top 25%) -0.4 -0.3 -0.2 -0.1 0 0.1 0.2 0.3
t-2 t-1 t t+1 t+2
Coe
fficien
t
Fired or made redundant
Coeff External LOC (bottom 25%)
-0.2 -0.15 -0.1 -0.05 0 0.05 0.1 0.15
t-2 t-1 t t+1 t+2
Coe
fficien
t
Serious injury/illness to family members
Coeff External LOC (bottom 25%)
-0.4 -0.3 -0.2 -0.1 0 0.1 0.2 0.3
t-2 t-1 t t+1 t+2
Coe
fficien
t
Serious personal injury/illness