Allocation in Multivariate Stratified Surveys with
Non-Linear Random Cost Function
Mohammed Faisal Khan1, Irfan Ali2*, Yashpal Singh Raghav2, Abdul Bari2 1
CSIRO Department of Mathematics, Integral University, Lucknow, India 2
Department of Statistics & Operations Research, Aligarh Muslim University, Aligarh, India Email: *[email protected]
Received December 25, 2011; revised January 26, 2012; accepted February 12,2012
ABSTRACT
In this paper, we consider an allocation problem in multivariate surveys with non-linear costs of enumeration as a prob-lem of non-linear stochastic programming with multiple objective functions. The solution is obtained through Chance Constrained programming. A different formulation of the problem is also presented in which the non-linear cost func-tion is minimised under the precision constraints on estimates of various characters. The solufunc-tion is then obtained by using Modified E-model. A numerical example is solved for both the formulations.
Keywords: Stratified Survey; Optimum Allocation; Compromise Allocation; Stochastic Programming; Chance Constraints; Modified E-Model
1. Introduction
In multivariate stratified sampling where more than one characteristic are to be estimated, an allocation which is optimum for one characteristic may not be optimum for other characteristics. In such situations a compromise criterion is needed to work out a usable allocation which is optimum for all characteristics in some sense. Such an allocation may be called a “Compromise Allocation”.
Several authors have studied various criteria for ob-taining a usable compromise allocation. Among them are Neyman [1], Dalenius [2], Gosh [3], Yates [4], Aoyama [5], Folks and Antle [6], Kokan and Khan [7], Chatterji [8], Ahsan and Khan [9], Jahan et al. [10], Khan et al.
[11] and many others.
The problem of optimum allocation in stratified sam-pling is generally stated in two ways. Either one mini-mizes the cost of survey for a desired precision or the variance of the sample estimate is minimized for a given budget of the survey. Kokan and Khan [7] formulated the minimization of the cost of the survey for desired preci-sions on various characters as the following convex pro-gramming problem;
1 1
Min , subject to 1, , , 2 , 1,
L L
ij i i
n
i i
i i
c n
j p n N i
1
, ,
L ij
j i
i i
a a
k
n N
L
p
,
i
c aij
(1.1)
where L is the number of strata, is the number of
characters to be estimated in the survey and , kj
N
,
C
p
and i are all positive constants.
If the budget of the survey is fixed in advance, say, then the multivariate allocation problem is stated to minimize the variances for various characters for a de-sired precision as the following convex program-ming problems;
1 1
0 1
Min. , 1, ,
subject to , 2 1, , .
L L
ij ij
n
i i i i
L
i i i i
i
a a
V j p
n N
c n c C n N i L
c a
(1.2)
Further, in a survey the costs for enumerating a char-acter in various strata are not known exactly, rather these are being estimated from sample costs. As such the for-mulated allocation problem should be considered as sto-chastic programming problem. When the constants i and ij,
are fixed, the prob-lem (1.1) was solved by Kokan and Khan by using an analytical procedure. Prekopa [12] developed a method from stochastic point of view. The case when sampling variances are random in the constraints (i.e. ij random in (1.1)) has been dealt with Diaz-Garcia and Garay Tapia [13]. Javed et al. [14] considered the case of ran-dom costs in (1.1) and used modified E-model for solv-ing this problem. Bakhshi et al. [15] find the optimal Sample Numbers in Multivariate Stratified Sampling with a Probabilistic cost constraint in (1.2).1, , , and 1, ,
i L j p
a
*
with random coefficients. The equivalent deterministic model for the problem in (1.1) is obtained by applying the chance constrained programming technique. The re-sult of optimal allocation using Chance Constrained pro-gramming when the weighted sum of variances of the estimates of various characters is minimized is compared through a numerical example with the proportional allo-cation. The model in (1.2) with non-linear cost function in constraints is handled by using the modified-E model of Diaz-Garcia and Garay Tapia [13]. The results are applied to a simulated example.
2. Problem Formulation
We consider a multivariate population consisting of N
units which is divided into L disjoint strata of sizes
1, 2, , L
N N
1
L i i
N N
p
j1,,p
n
, .L
th
j N such that . Suppose that
characteristics are measured on each unit of the population. We assume that the strata boundaries are fixed in advance. Let i units be drawn according to a stratified simple random sampling plan without re-placement from the stratum For character, an unbiased estimate of the population mean
th
i i 1,
j
Y
j1,,p
, denoted by yjst, has its sampling variance
2 21 1
L L
i ij i
jst
i i i i
W S W
V y
n N
2 2
1, ,
ij S
j p (2.1)
where i i
N W
N
is the stratum weight and
2 1i
N
ijh ij
y Y
jthth
i
,
2 1
1 ij
h i
S N
is the variance for the
character in the stratum. Let C be the upper limit on the total cost of the survey. The problem of optimal sample allocation involves determining the sample sizes
1, 2, L
n n n that minimize the variances of various characters under the given sampling budget C. Within any stratum the linear cost function is appropriate when the major item of cost is that of taking the measurements on each unit. If travel costs between units in a given stratum are substantial, empirical and mathematical studies indicate that the costs are better represented by
the expression 1
L i i
n
tith
i
k
i
t , where is the travel cost in-
curred in enumerating a sample unit in the stratum, see Beardwood et al. [16], who observe that the distance between randomly scattered points is proportional to
k . Assuming this non-linear cost function one should have
0 ,
i
t n t C
0
t
2 ni Ni
1
L i i
(2.2)where is the overhead cost.
The restrictions on the sample sizes from various strata are
(2.3)
Ignoring the constant term in (2.1), the allocation problem with non-linear cost function can be written as the following p convex programming problems
2 2
1
0 1
Min. , 1, , 1)
subject to
2)
and 2 , 1, , , 3)
L i ij n
i i L
i i i
i i i
W S
V j p
n
t n t C
n N i L n N
t
t (i1,, )L
(2.4)
In many practical situations the travel costs i in the various strata are not fixed and may be considered as random. Let us assume that i, are inde-pendently normally distributed random variables.
So, we write the above problem in the following chance constrained programming form (see, charnes & cooper [17])
2 2
1
0 0
1
Min. , 1, , 1)
subject to
2)
2 , 1, , , 3)
L i ij
n i
i
L i i i
i i i
W S
V j p
n
P t n t C p
n N i L n N
0
p 0 p0 1
(2.5)
where ,
t i1,, ,L
1, ,
is a specified probability.
3. Solution Using Chance Constrained
Programming
Let us assume that the costs i, in the con-straint function (2.5 2)) are independently and normally distributed random variables. Let t t tL and
1, , L
n n n . Then the function
t nt0
will alsobe normally distributed with mean 0 1
L i i
E t n t
and variance 1
L i i
V t n
.The mean of the function 0 1
L i i
E t n t
isob-tained as
0 0 0
1 1 1
L L L
i i
i i i i
i i i
E t n t n E t t n t
(3.1)
E t i 1, ,L
where i i , .
2 1L i i i
i
V t n
1 1
L L
i
i i
i i
V t n n
2, i1,,L
(3.2)
where i V t
i .
Now let 0
1
L i i i
f t t n t
p0, then {2.5 2)} is given
by P f t
C which is equivalent to
0E f t
P p f t
f t E f t C
V f t V
where f t
E f tV f t
is a standard normal variable
with mean zero and variance one. Thus the probability of realizing f t
less than or equal to C can be written as
C E f tV f t
z P f t C (3.3)
where represents the cumulative density function of the standard normal variable evaluated at z. If K
represents the value of the standard normal variable at which
K p0
, then the constraint (3.3) can be written as
t
C E f
K
V f t
(3.4)The inequality (3.4) will be satisfied only if
C E f t
K
V f t
or equivalently,
E f t K V f t C (3.5)
Substituting from (3.1) and (3.2) in (3.5), we get
2 1 1 L L i i i i n C
0 ii n t K
(3.6)The constants i and i in (3.6) are unknown (by hypothesis). So we will use the estimators of mean
0 1
L i i i
E t n t
and variance 0 1
L i i i
V t n t
givenby 0 0 1 1 L L i i i
n t t
ˆ
i i
E t n t
(3.7)2 0 1 1 L L i i i t n ˆ i i
V t n
(3.8)where ti and 2
i
are the estimated m ances from the sample.
Thus, an equivalent deterministic constraint to the i
eans and
vari-chastic constraint s given by
2 0
1
L
i i i i
t n t K n C
L
1
i
(3.9)The equivalent deterministic non-linear programming problem to the stochastic programming probl
given by
em (2.5) is
2 2
Min. , 1, ,
L i ij n
W S
V j p
1
2 0
1 1
subject to
2 , 1, , ,
i i
L L
i
i i i
i i
i i i
n
t n t K n C
n N i L n N
(3.10)A compromise solution to these p problems can be obtained by assigning the weights to various characters according to some measure of their importance, see Khan
et r
tics are of interes
al. [18]. It is assumed that the cha acteristics are mu-tually independent so that the co-variances are zero. Let
0, 1, , j
a j p be the weights assigned to various characteristics according to some measure of their im-portance. If the population means of various characteris-t, it may be a reasonable criterion for obtaining the compromise allocation to minimize the
weighted sum
1p
j jst j
a V y
. It is conjectured that weights 0, 1, ,j
a j p should be proportional to the sum of the stratum v r jth
characteristics, that is
L
ariances fo
2 1
j ji
a S
i
,j1,, .pp Letting 1 1, j a j
the above conjecture leads to2
1
, 1, , ji i S p
2 1 1 L j p Lji j i a j S
Then the deterministic non-linear prog g prob-lem with a single compromise objective function is
rammin 2 2 0 1 1 subject to 2)
2 , 1, , , 3)
L L
i i i i
i i
i i i
t n t K n C
n N i L n N
2 1 1 Min. 1) p L i j ij n
i i j
W
V a S
The non-linear programming problem in (3.11) is con-vex as the objective function in {3.11 1)} is concon-vex, see Kokan and Khan [7] and the left hand side in {3.11 2)} is also convex. So it is possible to solve the con
gramming problem (CPP) (3.11) by using any st convex programming algorithm. The optimal sample numbers thus obtained may turn out to be fractional. However, it is known that the variance functions are flat at
vex pro-andard
the optimum solution. So for large sample size it is enough to round the fractional values to the nearest inte-gers. However, for small n an integer solution can be obtained by using branch and bound method.
4. Modified E-Model
Let us consider the situation in which the survey is to be conducted in such a way that the budget of the survey for all the p characters is minimized for given upper limits on the variances. The non-linear cost function of modi-
fied E-model is given by Ck E f t1
k2 V f t
,k k non-negative constant whose
i of
where 1 and 2 are the
values indicate the relative mportance E f t
and
V f t for minimization. From (3.7) and (3.8) we
have
2
1 0 2
1 1
.
L L
i
i i i
i i
C k t n t k n
(4.1)Now let the upper limits fixed for the variance of jth
character be Vj* j1,, .p
The precision constraints are then given b ,
y 2 2
L W S
* 1
, 1, ,
i ij j
i i
V j p
n
(4.2)Using Modified E-model technique, the formulated as
problem is
2
2 2 *
1) Subject to
, 1, , 2)
, 1, , , , 3)
L i ij
j
i i
t n t k n
W S
V j p
i L n N
1 0 2
1 1 i
i
i i t
n
i i
1
2
i i
i
n
n N
Min.
L L
Ck
w e k1 and k2 are non-negative constants, and their v es show the relative importance of the expectation variance. Some author at k1 k2 1
(4.3)
her alu
and the s suggest th , Rao ([19], p. 599).
Remarks
ta and k20 in the problem (4.3), ltin
v rd
see
1) If we ke k11 ode
the resu g m l is known as the E-model, see Uryase and Pa alos [20]. For E-model the objective
function (4.3) reduces to
0 1
i i n
i
t n t
take k1 0 Min.
L
C
2)If we and k21 in (4.3), the result-ing model is known as the V-model. For V-model the objective function in (4.3) reduces to
2 1
i i
n i
n
Min.
L
C
5. Numerical Illustration
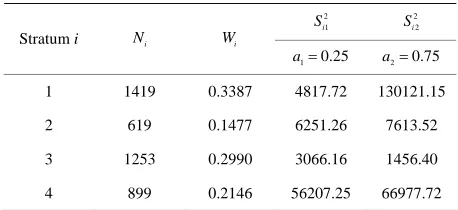
Th meric ple
rvey conducted in Varanasi district of Uttar Pradesh (U.P), India to study the distribution of manurial resources among different crops and cultural practices (see Sukhatme et al. [21]). Relevant data with respect to the two characteristics
ated area” in the district e following nu al exam demonstrates the use of the solution procedure. The data used in this example is from a stratified random sample su
“area under rice” and “total cultiv
are given in Table 1. The total number of villages in the district was 4190.
In order to demonstrate the procedure the following are also assumed. The per unit travel costs ti,
i1,, 4
of measurement in various strata are independently nor-mally distributed with the following means and variances
1E t = 3, E t
2 = 4, E t
3 = 5, E t
4 = 7 and
1V t = 0.6, V t
2 = 0.5, V t
3 = 0.7, V t
4 = 0.8. The total amount available for the survey C is assumed as 300 units including an expected overhead cost t = 250
Let th e con .5 2) ired t fied w roba en
units.
5.1. Minimization of the Variances Subject to the Non-Linear Cost Function
e chanc straint 2 be requ o be satis-ith 99% p bility. Th K is such that
K 0.99. The value of standard normal variable
K corresponding to 99% confidence limits is 2.33. Thus, the (non-linear programming) problem (3.11) is obtained as
1 2 3
4
1 2 3 4
2960.5328
bject to
3 4 5 7
n
n n n n
1 2 3 4
1 2 3 4
Mi
Su
2.33 0.6 0.5 0.7 0.8 275
2 1419, 2 619, 2 1253, 2 899
n n
n n n n
n n n n
11333.5688 158.6615 166.1824 n.V
n n
NLP problem (5.1) is solved by using LINGO com-puter program a package for constrained optimization by LINDO systems Inc, see LINGO users Guide [22].
The solutio ained is 624.23, n2 = 37.27,
3
n .04 an n4 = 17 with objective function val
n obt d
1
n = 2.80 = 33
ue f n .57. The in solution is n1 = 623
n 37, = 34 and n4 with value of the
ob-j
= 44 tege
= 17 r 2
,
2 ective fun
= n3
ction f n = 44
n erical illustratio ted above the total 4
1
866.
i i
n n
As suggested by Ney-man [1], if proportional allocation with n
.58. n pr
In the um esen
sample size is
is used, 866
and values Wi as given in Table 1, we get the sample sizes ni nW; i = 1, 2, 3 and 4 as:
293,
n1 n2128, n3259 and n4186.
Note that the left hand side of the cost constraint in (5.1) from roportional allocation is obtained 286.62. s that it is adly violated
Further, under roportional allocation the weighted su
p as
o b .
the p
m of variances is worked out as:
2
0.75 69.29 56.44
j jst
a V y
1
0.25 17.94
j
ed
5.2. Minimization of the Cost Subject to Bounds
ances. Then, using the modi-fie
1 2
k k
wing NLP prob (4.3):
The solutio tained is 1 = 68 n2 = 32, n = 23 and n4 h ue of t e objective
func-886.
i n
ues we get the sample sizes as: which is much more greater than the minimum value 44.58 obtain through compromise allocation.
on Variances
In the above example let us minimize the cost restricted to given upper limits on vari
d E-model technique with given upper limits on the variances as *
1 10
V , *
2 40
V and taking lem from
0.5, we solve the follo
n ob = 150 wit
n
the val
1, h
3
tion as C = 117.15.
The total sample size turns out to be 4
n
1
i
For proportional allocation, with n886 and the val-i
W as given in Table 1
1 300,
n n2131, n3265 and n4190. Under the proportional allocation the min cost is ob-tained as C = 149.88. Also the constraints in (5.2) are not satisfied by the allocation.
6. Conclusion
We have considered the allocation problem in multivari-ate stratified s inear
stochas-tic ion. We have
progr ed E-m
ab
2
i
S
urveys as a problem of non-l programming with non linear cost funct
proposed the Chance Constrained amming tech-nique and the techtech-nique of modifi odel for their
T le 1. Data for four strata and two characteristics.
2 1
i
S 2
Stratum i Ni Wi
1 0.25
a a20.75
1 1419 0.3387 4817.72 130121.15
2 619
3 1253
0.1477 6251.26 7613.52
0.2990 3066.16 1456.40
4 899 0.2146 56207.25 66977.72
solutions. These techniques are then used on a numerical example in Section 5.The respective solutions obtained
are on
in the constraints than the corresponding solutions with pr al allocation.
EFE
CE
[1] eyman, the T erent Aspects of e-sentative Metho : The Method of Stratified Sampling
Method rposi tion l o al
tistical S y,Vol . 4, 55
doi:10.2307 2192
seen much better even for the non-linear cost functi
oportion
R
REN
S
J. N “On wo Diff the Repr d
of Pu
and
f the Roy
the ve Selec ,” Journa
Sta ociet
/234
. 97, No 1934, pp. 8-625.
958, pp. 81-89.
[4] F. Yates, “Sampling Methods for Censuses and Surveys,” 3rdEdition, C ondon, 1960. [5] H. Aoyama, “Stratified Ra
[2] T. Dalenius, “Sampling in Sweden: Contributions to the Methods and Theories of Sample Survey Practice,” Alm-qvist Och Wiksell, Stockholm, 1957.
[3] S. P. Ghosh, “A Note on Stratified Random Sampling with Multiple Characters,” Calcutta Statistical
Associa-tion Bulletin, Vol. 8, 1
harles Griffin and Co., L
ndom Sampling with Optimum Allocation for Multivariate Populations,” Annals of the
Institute of Statistical Mathematics, Vol. 14, No. 1, 1963,
pp. 251-258. doi:10.1007/BF02868647
[6] J. L. Folks and C. E. Antle, “Optimum Allocation o Sampling Units to th
f e Strata When There Are R Re-sponses of Interest,” Journal of the American Statistical
Association,Vol. 60, No. 309, 1965, pp. 225-233.
doi:10.2307/2283148
[7] A. R. Kokan and S. U. Khan, “Optimum Allocation in Multivariate Surveys: An Analytical Solution,” Journal of
the Royal Statistical Society, Series B, Vol. 29, 1967, pp.
al of
115-125.
[8] S. Chatterji, “Multivariate Stratified Surveys,” Journ
the American Statistical Association, Vol. 63, No. 322,
1968, pp. 530-534. doi:10.2307/2284023
[9] M. J. Ahsan and S. U. Khan, “Optimum Allocation in Multivariate Stratified Random Sampling Using Prior
In-
atisti-2, No. atisti-2, 1994, pp. 95-101. formation,” Journal of Indian Statistical Association, Vol. 15, 1977, pp. 57-67.
[10] N. Jahan, M. G. M. Khan and M. J. Ahsan, “A General-ized Compromise Allocation,” Journal of Indian St
cal Association, Vol. 3
[image:5.595.308.537.100.205.2]9-79.
Allocation in Multivariate Stratified Sampling: An Inte-ger Solution,” Naval Research Logistics, Vol. 44, No. 1, 1997, pp. 6
doi:10.1002/(SICI)1520-6750(199702)44:1<69::AID-NA V4>3.0.CO;2-K
[12] A. Prekopa, “Stochastic Programming,” Series
Mathe-ed Surveys: Stochastic Program-matics and Its Applications, Kluwer Academic Publishers, Berlin, 1995.
[13] J. A. Diaz Garcia and M. M. Garay Tapia, “Optimum Allocation in Stratifi
ming,” Computational Statistics and Data Analysis, Vol. 51, No. 6, 2007, pp. 3016-3026.
doi:10.1016/j.csda.2006.01.016
[14] S. Javed, Z. H. Bakhshi and M. M. Khalid, “Optimum Allocation in Stratified Sampling with Random Costs,”
International Review of Pure and Applied Mathematics,
Vol. 5, No. 2, 2009, pp. 363-370.
[15] Z. H. Bakhshi, M. F. Khan and Q. S. Ahmad, “Optimal Sample Numbers in Multivariate Stratified Sampling with
phical Society, Vol. 55,
a Probabilistic Cost Constraint,” International Journal of
Mathematics and Applied Statistics, Vol. 1, No. 2, 2010,
pp. 111-120.
[16] J. Beardwood, J. H. Halton and J. M. Hammersley, “The Shortest Path through Many Points,” Mathematical Pro-ceedings of the Cambridge Philoso
No. 4, 1959, pp. 299-327. doi:10.1017/S0305004100034095
[17] A. Charnes and W. W. Cooper, “Chance Constrained Pro- gramming,” Management Science,Vol. 6, No. 1, 1959, pp. 73-79. doi:10.1287/mnsc.6.1.73
s,” Wily [18] E. A. Khan, M. G. M. Khan and M. J. Ahsan, “On
Com-promise Allocation in Multivariate Stratified Sampling,”
Aligarh Journal of Statistics, Vol. 23, 2003, pp. 31-47.
[19] S. S. Rao, “Optimization-Theory and Application Eastern Limited, New Delhi, 1979.
[20] S. Uryasev and P. M. Pardalos, “Stochastic Optimiza-tion,” Kluwer Academic Publishers,Dordrecht, 2001. [21] P. V. Sukhatme, B. V. Sukhatme, S. Sukhatme and C.
Asok, “Sampling Theory of Surveys with Applications” 3rdEdition, Iowa State University Press, Ames, 1984. [22] Lindo Systems Inc., “LINGO User’s Guide,” Lindo