Analysis of the Multi-Relationships and Their Structures
for Safety Culture
Teh-Sheng Su1, Pei-Ru Lin2, Yi-Liang Shu1, Jo-Ming Tseng3, Chen-Shan Kao2* 1
Department of Safety, Health and Environmental Engineering, Central Taiwan University of Science and Technology, Taichung, Chinese Taipei
2
Department of Safety, Health and Environmental Engineering, National United University, Miaoli, Chinese Taipei
3
Institute of Safety and Disaster Prevention Technology, Central Taiwan University of Science and Technology, Taichung, Chinese Taipei
Email: *[email protected]
Received June 14,2012; revised July 20, 2012; accepted August 5, 2012
ABSTRACT
Studies on safety culture and safety performance have been increasing recently and several proposed models have been developed and evaluated to identify their key dimensions. However, many studies focus more on measuring the scales of the safety culture and safety performance dimensions. This study aims to seek a deeper understanding of the overall structures of safety culture, safety performance and their relationships by using exploratory and confirmatory factor analysis along with the structural equation modeling (SEM) statistical technique, because the above-mentioned concepts and technique have been seldom employed and are uncommon in manufacturing companies, in terms of Taiwan. We first carry out a thorough literature review and propose an integrated model of safety culture and safety performance with eight dimensions and four dimensions, respectively. We then state a series of hypotheses and test the proposed model on a sample of 370 valid data from three manufacturing companies in Taiwan. Results show that the third-order safety culture associated with second-order safety performance model turns out to be the desired model, where both the measured variables and latent variables have good reliability. The proposed model meets many criteria of the goodness of fit as well.
Keywords: Safety Culture; Safety Performance; Structure Equation Modeling
1. Introduction
Occupational safety and health management is an effi- cient way to increase industrial safety. People recognize how to improve on the limitations of health and safety problems by improving the technique and hardware. Adopting a safety work system and establishing work safety rules could improve the safety and health condi- tions, but some people do not obey the rules during the work period; therefore, efficiency is still limited. Many companies try to improve their safety and health condi- tions by three stages. The first one is the technique im- proving stage. This stage is comprised of engineering improvement, renewing of machines, engineering control systems, ventilation systems, and using PPE, etc. The second is the stage of improving the safety and health system; improving occupational safety and health only by controlling the hazard factors is not enough. Therefore, a safety management system is employed to establish a safety policy and safety structure to improve the safety performance by staff participation. However, safety man-
agers realized that improving safety and health by the previous stages is not enough; The last stage is created, as so-called safety culture. This safety culture could be employed to improve the safety performance in compa- nies. Safety culture and performance are both important ways to increase the degree of safety and health in an extensive work environment. Safety behavior can be im- proved by establishing a safety culture, even safety per- formance and degree of safety. Evaluation of safety per- formance has the following benefits: understanding the risk degree of safety and health, continuing improvement of the system, increasing the efficiency and potency of organizational communication, distributing the resource, and finding the basic problems of safety and health, etc.
Safety performance [1] is defined as the overall per- formance of the organization safety management system in safe operation [2], and which is divided into three types [3]. Safety culture is defined through the sharing the safety concepts, safety attitude, safety opinions, and safety behavior in each staff regarding the policy of lessening exposure risk, way of doing, procedure, and so on for preventing accidents and diseases from occurring.
Though many safety culture models have been developed and tested by various researchers in an attempt to identify the key dimensions of safety culture [4-14], an overall structure of safety culture and safety performance and their relationship are still undeveloped. Only until re- cently applications of the structure equation modeling (SEM) to identify the structure of safety management, safety climate and firm performance have been proposed and assessed [15-20]. Concepts and techniques were sel- dom applied in manufacturing companies. This study with a view based on the previous studies [21-24] is to integrate and construct an overall structure of the safety culture and safety performance model and then to utilize SEM techniques to test if the theoretically driven struc- ture of the proposed model will be reflected in the data.
2. Methods
2.1. SEM
SEM is a statistical method for testing and estimating causal relationships with the combination of statistical data and qualitative causal assumptions. It is more like a confirmatory factor analysis (CFA) technique, rather than an exploratory factor analysis (EFA) technique, i.e., us- ing SEM to determine whether a certain model is valid to find a suitable model, although SEM analyses often in- volve certain exploratory elements. We start with a hy- pothesis, represent it as a model, and use confirmatory factor analysis to measure the patterns and confirm whether the observed variables can be effectively ex- plained by the latent variables. Then we test the potential causal relationship between variables by comparing the estimated matrices representing the relationships between variables in the model to the actual matrices. To perform the analysis, the constructed safety culture and safety performance models were submitted to a confirmatory factor analysis using the Amos17.0 software program.
2.2. Assessment of Fit
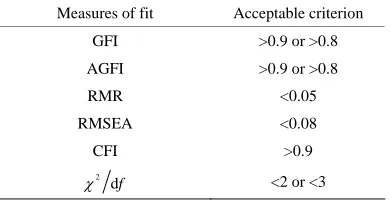
[image:2.595.327.523.635.735.2]There are more than ten of measures of fit, and in this study we used Goodness of Fit Index (GFI), Adjusted Goodness of Fit Index (AGFI), Comparative Fit Index (CFI), Root Mean Residual (RMR), Root Mean Square Error of Approximation (RMSEA), and Normed Chi- Square (2 df ) to determine the overall goodness of fit to the sample data. Their acceptable criteria are listed in
Table 1. The Amos program provides multiple indices to
ascertain the model fit. It is appropriate to present a se- lection of various fit measures since different measures of fit capture different elements of the fit of the model.
2.3. The Models
To perform the analysis, the following safety culture and
performance models are assumed, constructed and ac- cessed:
1) Null model: usually used as a baseline model as- suming that safety culture and performance model do not have any common factor existing and hence all the ob- served variables are mutually independent.
2) First-order single factor model: assuming that all the observed variables are not mutually independent and instead having one common factor.
3) Second-order single factor model: similar to first- order correlated multi-factor model; it further assumes that all the first-order factors can be explained by a common factor with higher order.
4) Second-order multi-factor model: further assuming that instead of having a single second-order factor, a correlated multi-factor will be appropriated.
5) Third-order single factor model: the highest order this study approached.
The overall safety culture and safety performance ques- tionnaire consists of 103 items that are associated with eight global factors for safety culture and four global factors for safety performance, respectively. For safety culture the following were specified: commitment & sup- port (CS), communication & involvement (CI), training & competence (TC), supervision & audit (SA), man- agement system & organization (SO), accident investi- gation & emergency response (AE), attitude & behavior (AB), reward and punishment & benefits (RB) were specified. For safety performance the following were identified: workplace safety organization (WSO), work- place safety management (WSM), workplace safety con- trol (WSC), workplace safety behavior (WSB).
3. Results and Discussions
The results of this analysis are presented in Table 2 and
Figures 1-4. Systematic testing of series of first-, sec-
ond-, and third-orders of correlated and uncorrelated factors models were performed. The research hypothesis of this study was as follows for demonstrating and dis- cussing: 1) Safety culture can be composed of eight di- mensions which are correlated; 2) The eight dimensions of safety culture can be explained with dimensions of a
Table 1. Measures of fit and their criteria (Baumgarther et al., 1996).
Measures of fit Acceptable criterion GFI >0.9 or >0.8 AGFI >0.9 or >0.8 RMR <0.05 RMSEA <0.08 CFI >0.9
2
df
RB 4 e1 1 RB 5 e2 1 RB 6 e3 1 RB 7 e4 1 RB 8 e5 1 SO 1 e6 1 SO 2 e7 1 SO 3 e8 1 SO 4 e9 1 SO 5 e10 1 SO 6 e11 1 SO 8 e12 1 SO 9 e13 1 SO 11 e14 1 SO 12 e15 1 AE1 e16 1 AE2 e17 1 AE4 e18 1 AE5 e19 1 AE7 e20 1 AE8 e21 1 AE9 e22 1 AE1 0 e23 1 TC 4 e2 4 TC 6 e25 TC 7 e26 TC 8 e27 TC 9 e28 TC 10 e29 CS 1 e3 0 CS 2 e31 CS 3 e32 CS 4 e33 CS5 e34 CS 7 e35 CS 8 e3 6 CS 9 e3 7 CS 10 e38 SA1 e39 SA 2 e40 SA4 e41 SA5 e42 SA6 e4 3 SA7 e44 SA8 e45 1 1 1 1 1 1 1 1 1 1 1 1 1 1 1 1 1 1 1 1 1 1 SA 9 e46 1 SA 10 e47 1 SA1 1 e48 1 RB 1 e4 9 1 RB 2 e50 1 RB 3 e51 1 AB 1 e52 AB 2 e53 AB 3 e54 AB 4 e55 AB 5 e56 AB 8 e57 AB 9 e58 AB 11 e59 AB 12 e60 AB 13 e61 CI 1 e62 CI 2 e63 CI 3 e64 CI 4 e65 CI 5 e66 CI 7 e67 CI 8 e68 CI 9 e69 CI 11 e70 CI 12 e71 TC 1 e72 TC 2 e73 TC 3 e74 1 1 1 1 1 1 1 1 1 1 1 1 1 1 1 1 1 1 1 1 1 1 1 WS O 7 e7 5 WS M 2 e76 WS M 3 e77 WS M 4 e78 WS M 5 e79 WS M 6 e80 WS M 7 e8 1 WS C 1 e8 2 WS C 2 e83 WS C 3 e84 WS C 5 e85 WS C 6 e86 WS C 7 e87 WS C 8 e8 8 WS C 9 e89 W SB1 e90 W SB2 e91 WS B 3 e92 W SB4 e93 W
SB5 e94
W SB6 e95 W SB7 e96 W SB8 e97 1 1 1 1 1 1 1 1 1 1 1 1 1 1 1 1 1 1 1 1 1 1 1 WS O 6 e98 1 WS O 5 e99 1 WS O 4 e1 00 1 WS O 3 e10 1 1 WS O 2 e102 1 WS O 1 e103 1
Saf
ety
cult
ure
& performance
1 Sa fe ty c u lt u re & p er fo rma n ce Figu re 1 .First-order single fa
RB4 e1 1 RB5 e2 1 RB6 e3 1 RB7 e4 1 RB8 e5 1 SO 1 e6 1 SO 2 e7 1 SO 3 e8 1 SO 4 e9 1 SO 5 e1 0 1 SO 6 e1 1 1 SO 8 e1 2 1 SO 9 e1 3 1 SO 11 e1 4 1 SO 12 e1 5 1 AE1 e1 6 1 AE2 e1 7 1 AE4 e1 8 1 AE5 e1 9 1 AE7 e2 0 1 AE8 e2 1 1 AE9 e2 2 1 AE1 0 e2 3 1 TC 4 e24 TC 6 e25 TC 7 e2 6 TC 8 e2 7 TC 9 e2 8 TC 1 0 e2 9 CS1 e3 0 CS2 e31 CS3 e32 CS4 e3 3 CS 5 e3 4 CS 7 e3 5 CS 8 e3 6 CS9 e37 CS1 0 e38 SA1 e39 SA2 e4 0 SA4 e4 1 SA5 e4 2 SA 6 e4 3 SA 7 e44 SA 8 e45 1 1 1 1 1 1 1 1 1 1 1 1 1 1 1 1 1 1 1 1 1 1 SA9 e46 1 SA1 0 e4 7 1 SA 1 1 e4 8 1 RB 1 e4 9 1 RB2 e5 0 1 RB3 e51 1 AB1 e5 2 AB2 e5 3 AB3 e5 4 AB4 e5 5 AB5 e5 6 AB8 e5 7 AB9 e5 8 AB1 1 e5 9 AB1 2 e6 0 AB1 3 e6 1 CI 1 e6 2 CI 2 e6 3 CI 3 e6 4 CI 4 e6 5 CI 5 e6 6 CI 7 e6 7 CI 8 e6 8 CI 9 e6 9 CI1 1 e7 0 CI1 2 e7 1 TC 1 e7 2 TC 2 e7 3 TC 3 e7 4 1 1 1 1 1 1 1 1 1 1 1 1 1 1 1 1 1 1 1 1 1 1 1 WS O 7 e7 5 WS M 2 e7 6 WS M 3 e7 7 WS M 4 e78 WS M 5 e79 WS M 6 e8 0 WS M 7 e8 1 WS C 1 e8 2 WS C 2 e8 3 WS C 3 e84 WS C 5 e85 WS C 6 e86 WS C 7 e8 7 WS C 8 e8 8 WS C 9 e8 9 W
SB1 e90
W SB2 e91 W SB3 e92 WS B 4 e93 WS B 5 e9 4 WS B 6 e9 5 W SB7 e9 6 W
SB8 e97
1 1 1 1 1 1 1 1 1 1 1 1 1 1 1 1 1 1 1 1 1 1 1 WS O 6 e9 8 1 WS O 5 e9 9 1 WS O 4 e1 00 1 WS O 3 e1 01 1 WS O 2 e10 2 1 WS O 1 e 103 1
WS
B
AB
WS
C
CI
AE
WS
M
WS
O
SO
TC
CS
SA
RB
1 1 1 1 1 1 1 1 1 1 1 1Safety
c
u
lture
Sa
fety
performa
nce
1 e 104 1 e1 0 5 1 e1 0 6 1 e1 0 7 1 e1 0 8 1 e 109 1 e1 1 0 1 e 111 1 e1 1 2 1 e1 1 3 1 e 114 1 e1 1 5 1 e1 1 6 1 Ma n a g e rs ' C o mm itme n t In di vi dual s' Co m m it m e nt O rgan iz a ti on s' C o mm itme n t 1 1 1 1 e1 1 7 1 e 118 1 e1 1 9 1 S af ety c u ltu re S af et y pe rf o rm anc eTC Cl AB
Table 2. Summary of overall measures of fit.
Overall measures of fit Model
GFI AGFI RMR RMSEA CFI 2
df
Null model 0.034 0.015 0.403 0.145 0.000 8.876
First order single factor model 0.332 0.305 0.049 0.083 0.679 3.547 First order single factor model
(safety culture vs safety performance) 0.484 0.464 0.043 0.073 0.755 2.948 Second order single factor model
(safety culture vs safety performance) 0.568 0.550 0.042 0.061 0.826 2.386 Third order single factor model
(safety culture vs safety performance) 0.569 0.551 0.041 0.061 0.828 2.371
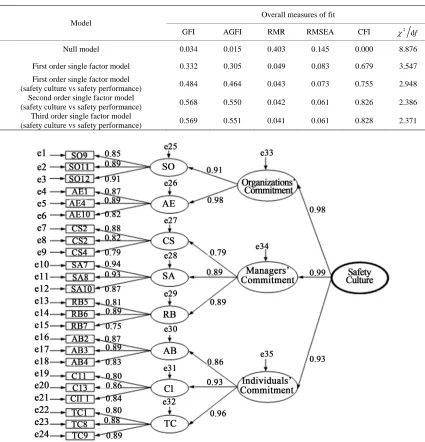
Figure 5. Third-order single factor model (safety culture) with 36 items.
One way to analyze the model more effectively is to reduce the total of 103 items to a reasonable degree. To do this, the following requirements were applied:
higher level; 3) Safety performance is composed of four correlated dimensions; 4) The four dimensions of safety performance can be explained with dimensions of a higher level. From Table 2 and Figure 4 we can see that the third-order single factor of safety culture vs the second- order single factor of the safety performance model fitted the data well. That is, the eight global factors represent the first-order factors; organization, managerial, and in- dividual commitments as the second-order factors; and the safety culture as the third-order factor; four global factors represented the first-order factors and safety per- formance as the second-order factor of the safety per- formance. However as shown in Table 2 the GFI and AGFI are far from being acceptable.
1) To assure model consistency all factors are consid- ered equally important such that each factor will remain 4 or 3 items. That is, model with total of 48 items and 36 items, respectively.
2) Cronbach’s alpha coefficients of each of the twelve factors must be greater than 0.8.
3) The loading factors of all selected items must be greater than 0.7.
4) All the acceptable criteria of the measures of fit in
Table 1 must be achieved.
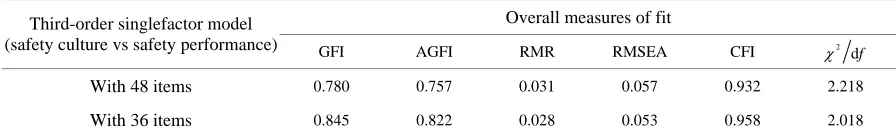
Table 3. Overall measures of fit with reduced items.
Overall measures of fit Third-order singlefactor model
(safety culture vs safety performance) GFI AGFI RMR RMSEA CFI 2
df
With 48 items 0.780 0.757 0.031 0.057 0.932 2.218
With 36 items 0.845 0.822 0.028 0.053 0.958 2.018
of 0.980 were obtained and satisfied all the measures of fit as shown in Table 3. The extremely high Alpha val- ues of all factors assured that the underlying structure of the factors was appropriate. The third-order safety cul- ture model was constructed. The final model is presented
in Figure 5. It can be shown that the model is excellent
since all the standardized path coefficients are greater than 0.7.
4. Conclusion
Proposed safety culture and safety performance models were constructed, tested, and verified. Results showed that the third-order single factor safety culture vs second- order single factor safety performance model is the de- sired model where the measures of fit are fulfilled and both of the observed variables and latent variables have good reliability.
5. Acknowledgements
We are indebted to the sponsor of the National Science Council in Taiwan for supporting this research project.
REFERENCES
[1] F. Wegman and S. Oppe, “Benchmarking Road Safety
Performances of Countries,” Safety Science, Vol. 48, No.
9, 2010, pp. 1203-1211. doi:10.1016/j.ssci.2010.02.003
[2] T. C. Wu and C. L. Kang, “A Study on the Survey of
Safety Performance Perceived by the Workers of in the
Four Types of Manufacturing Industry in Taiwan,” Jour-
nal of Occupational Safety and Health, Vol. 12, No. 1,
2004, pp. 73-90.
[3] S. S. Wei, “A Study of Implementation of Safety Per-
formance Management,” Industrial Safety Technology
Quarterly, Vol. 66, 2008, pp. 7-10.
[4] R. Carl, “Can Focus on Safety Culture Become an Excuse
for Not Rethinking Design of Technology?” Safety Sci-
ence, Vol. 48, No. 2, 2010, pp. 268-278.
doi:10.1016/j.ssci.2009.07.008
[5] A. Ahmet and K. Sytze, “Safety Culture in an Aircraft
Maintenance Organisation: A View from the Inside,” Safety
Science, Vol. 49, No. 2, 2011, pp. 268-278.
doi:10.1016/j.ssci.2010.08.007
[6] T. O. Nævestad, “Evaluating a Safety Culture Campaign:
Some Lessons from a Norwegian Case,” Safety Science,
Vol. 48, No. 5, 2010, pp. 651-659. doi:10.1016/j.ssci.2010.01.015
[7] INSAG, “Safety Culture. Safety Reports Series No. 75-
INSAG-4,” International Atomic Energy Agency, Vienna, 1991.
[8] E. S. Geller, “Ten Principles for Achieving a Total Safety
Culture,” Professional Safety, September 1994, pp. 18-24.
[9] M. D. Cooper, R. A. Phillips, V. J. Sutherland and P. J.
Makin, “Reducing Accidents Using Goal Setting and
Feedback: A Field Study,” Journal of Occupational and
Organizational Psychology, Vol. 67, No. 3, 1994, pp. 219-
240. doi:10.1111/j.2044-8325.1994.tb00564.x
[10] S. J. Cox and R. Flin, “Safety Culture; Philosopher’s
Stone or Man of Straw?” Work & Stress, Vol. 12, No. 3,
1998, pp. 189-201. doi:10.1080/02678379808256861
[11] Health and Safety Executive, “Development of a Business
Excellence Model of Safety Culture,” HSE, Entec UK Ltd., London, 1999.
[12] Health and Safety Executive, “Safety Culture Maturity
Model,” Offshore Technology Report, HSE, Entec UK
Ltd., London, 2000.
[13] P. Hudson, “Understanding Safety Management in the
Context of Organizational Culture. NATO/Russia ARW,”
Forecasting and Preventing Catastrophes Conference, Uni-
versity of Aberdeen, 2-6 June 2003.
[14] M. Iotrowski and D. Hinshaw, “The Safety Checklist Pro-
gram: Creating a Culture of Safety in Intensive Care Units,”
Journal on Quality Improvement, Vol. 28, 2002, pp. 306-
315.
[15] M. C. Mario, G. Francisco, T. Inés and J. M. Peiró, “Lead-
ership and Employees’ Perceived Safety Behaviours in a
Nuclear Power Plant: A Structural Equation Model,” Safety
Science, Vol. 49, 2011, pp. 1118-1129.
doi:10.1016/j.ssci.2011.03.002
[16] F. M. Beatriz, M. P. José Manuel and V. O. Camilo José,
“Safety Management System: Development and Valida-
tion of a Multidimensional Scale,” Journal of Loss Pre-
vention in the Process Industries, Vol. 20, No. 1, 2007,
pp. 52-68. doi:10.1016/j.jlp.2006.10.002
[17] F. M. Beatriz, M. P. J. Manuel and V. O. C. José, “Safety
Culture: Analysis of the Causal Relationships between Its
Key Dimensions,” Journal of Safety Research, Vol. 38,
No. 6, 2007, pp. 627-641. doi:10.1016/j.jsr.2007.09.001
[18] F. M. Beatriz, M. P. J. Manuel and V. O. C. José, “Rela-
tion between Occupational Safety Management and Firm
Performance,” Safety Science, Vol. 47, No. 7, 2009, pp.
980-991. doi:10.1016/j.ssci.2008.10.022
[19] S. H. Hsu, C. C. Lee, M. C. Wu and K. Takano, “A
Cross-Cultural Study of Organizational Factors on Safety:
Japanese vs Taiwanese Oil Refinery Plants,” Accident
doi:10.1016/j.aap.2007.03.020
[20] S. E. Johnson, “The Predictive Validity of Safety Cli-
mate,” Journal of Safety Research, Vol. 38, 2007, pp. 511-
521. doi:10.1016/j.jsr.2007.07.001
[21] C. S. Kao, P. R. Lin, M. C. Yang, W. H. Lai and T. S. Su,
“Identification of Safety Culture Structure and Its Major
Factors of the Chemical Industry in Taiwan,” The 24th
APOSHO Annual Conference, Seoul, 2008, pp. 123-129.
[22] W. H. Lai, “The Safety Culture Assessment of Petrochemi-
cal Industries—Case Study of Five Companies in Tai-
wan,” MS Thesis, National United University, Miaoli, 2006.
[23] C. S. Kao, W. H. Lai, T. F. Chuang and J. C. Lee, “Safety
Culture Factors, Group Differences, and Risk Perception
in Five Petrochemical Plants,” Process Safety Progress,
Vol. 27, No. 2, 2008, pp. 145-152. doi:10.1002/prs.10246
[24] T. S. Su, “Safety and Health Policy and Intellectual Da-