© 2019, IRJET | Impact Factor value: 7.211 | ISO 9001:2008 Certified Journal
| Page 3259
COMPARATIVE STUDY BETWEEN SOAKED & UNSOAKED VALUE OF SOIL
SAMPLES
Chandravali Pandey
1, Dr. Shubha Agarwal
21
Research Scholar, Master of Construction Technology & Management, LNCT, Bhopal
2Professor & Head “Department of Civil Engineering” LNCT, Bhopal
---***---
Abstract- Soil is the principal material for the construction of fill or embankment and sub grade layer for highways. Soil is also used in the other pavement layers such as stabilized soil sub base and base layer. The design and performance of the pavement, particularly the flexible pavement. CBR test is important method of evaluating the sub grade strength, among the various methods but quick estimation of CBR is most important for highway engineer so this study is aims on comparative study between soaked and unsoaked CBR value. This Study is to understand the effect of soaking on CBR value subjected to zero hour to ninety six hour of soaking and the its variation in water content.Key words:- Unsoaked & Soaked ,CBR, MDD & OMC, Liquid Limit, Plastic Limit, Plasticity Index, soil testing.
I. INTRODUCTION
Development of the country assessed by the connectivity of the roads and pavements. Roads are damages by flood and in these phenomena huge amount of expenditure is required for improvement of road. Therefore aim of this research is finding the mode of damages of roads under flood and responsible factor for such damages. This study aim is determine the effect of depth of submergence and duration of submergence on the sub grade strength of soil. Therefore several test such as MDD, OMC, LL, PL, PI, Free Swelling Index, Specific Gravity, Natural Moisture Content & CBR are suitable for the study of soil as subgrade material. Subgrade strength is expressed in terms of CBR (California Bearing Ratio). Thicker layer is required for Weaker subgrade and thinner layer is required for stronger subgrade. In this project the effect of soaking on CBR value subjected to different days of soaking & corresponding valuation in moisture content is understand with some index and identification of soil.
II.OBJECTIVE
It is common that the subgrade strength for highway pavement design is determined by CBR test measurement. This can be from the laboratory CBR test or directly from field CBR test. The correlation between the result of CBR unsoaked value and CBR soaked value is hardly found.
The main objective of this study is finding the correlation between the results of CBR laboratory test without soaked CBR Value
and CBR soaked value.
The correlation is based on the comparison CBR unsoaked test value and CBR soaked value of the soil.
III. SCOPE
Scope of work for this study is to observe the CBR value under different soaking time conditions and to study the effect, in the
samples under varying soaking.
1. The determine its basic physical property such as LL, PL, PI and grain size distribution.
2. Determine the MDD and OMC for the soil sample.
3. To carry out CBR Test for sample soaked in different duration.
4. To study the effect of soaking on sub grade strength.
IV. DETAILS OF LABORATORY STUDIES
California Bearing Ratio
© 2019, IRJET | Impact Factor value: 7.211 | ISO 9001:2008 Certified Journal
| Page 3260
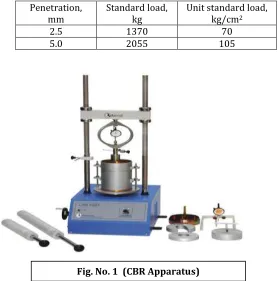
a measure of resistance to penetration of a soil or flexible pavement material, of standard plunger under controlled test conditions. The CBR test may be conducted in the laboratory either on remoulded or undisturbed soil specimens. The basic principle in CBR test is causing a cylindrical plunger of 50 mm diameter to penetrate into the soil or pavement component material to be tested at a rate of 1.25 mm per minute. The loads required causing 2.5mm and 5.0mm penetration of the plunger in the soil / material tested are recorded. The CBR value of the material tested is expressed as a percentage of standard load value in a standard material. The standard load values have been established based on tests conducted on a large number the standard material consisting of compacted hard crushed stone aggregates, at the respective penetration levels of 2.5 and 5.0mm.
Penetration,
mm Standard load, kg Unit standard load,kg/cm2
2.5 1370 70
5.0 2055 105
Maximum Dry Density And Optimum Moisture Content
This test is done to determine the maximum dry density and the optimum moisture content of soil using heavy compaction as per IS: 2720 (Part 8 ) – 1983.The apparatus used is
i) Cylindrical metal mould – it should be either of 100mm dia. and 1000cc volume or 150mm dia. and 2250cc volume and should
conform to IS: 10074 – 1982.
ii) Balances – one of 10kg capacity, sensitive to 1g and the other of 200g capacity, sensitive to 0.01g
iii) Oven – thermostatically controlled with an interior of noncorroding material to maintain temperature between 105 and
110oC
iv) Steel straightedge – 30cm long
v) IS Sieves of sizes – 4.75mm, 19mm and 37.5mm
Procedure to determine the maximum dry density and the optimum moisture content of soil
i) A 5kg sample of air-dried soil passing through the 19mm IS Sieve should be taken. The sample should be mixed thoroughly
with a suitable amount of water depending on the soil type .The soil sample should be stored in a sealed container for a minimum period of 16hrs.
ii) The mould of 1000cc capacity with base plate attached should be weighed to the nearest 1g (W1). The mould should be placed
[image:2.612.171.449.174.455.2]on a solid base, such as a concrete floor or plinth and the moist soil should be compacted into the mould, with the extension attached, in five layers of approximately equal mass, each layer being given 25 blows from the 4.9kg rammer dropped from a height of 450mm above the soil. The blows should be distributed uniformly over the surface of each layer. The amount of soil used should be sufficient to fill the mould, leaving not more than about 6mm to be struck off when the extension is removed.
© 2019, IRJET | Impact Factor value: 7.211 | ISO 9001:2008 Certified Journal
| Page 3261
The extension should be removed and the compacted soil should be leveled off carefully to the top of the mould by means of the straight edge. The mould and soil should then be weighed to the nearest gram (W2).
iii) The compacted soil specimen should be removed from the mould and placed onto the mixing tray. The water content (w) of a
representative sample of the specimen should be determined.
iv) The remaining soil specimen should be broken up, rubbed through 19mm IS Sieve and then mixed with the remaining original
sample. Suitable increments of water should be added successively and mixed into the sample, and the above operations i.e. ii) to iv) should be repeated for each increment of water added. The total number of determinations made should be at least five and the moisture contents should be such that the optimum moisture content at which the maximum dry density occurs, lies within that range.
Bulk density Y(gamma) in g/cc of each compacted specimen should be calculated from the equation,
Y(gamma) = (W2-W1)/ V
where, V = volume in cc of the mould. The dry density Yd in g/cc
Yd = 100Y/(100+w)
The dry density in g/cc corresponding to the maximum point on the moisture content/dry density curve should be reported as the maximum dry density to the nearest 0.01. The percentage moisture content corresponding to the maximum dry density on the moisture content/dry density curve should be reported as the optimum moisture content.
Moisture Content
Oven drying method and Calcium carbide method are the two popular methods of determination of water content. Determination of Moisture content is based on IS 2720 – Part 2- 1973.Oven Drying Method is an accurate method of determining water content of soil. The procedure is as follows:
1. Collect a representative sample of soil in a steel cup carrying a lid.
2. Find the weight of cup and lid along with soil (W1)
3. Keep the cup with lid open in a thermostatically controlled oven for 24 hours at around 105o C. Free water in the soil
evaporates.
4. After cooling the cup, find the weight of cup and lid along with dry soil (W2)
5. Find the empty weight of cup and lid (W3)
w (%) = Weight of Water = W1-W2 Weight of soil solids W2-W3
Particle Size Distribution
A sieve analysis (Particle Size Distribution) is a practice or procedure used to assess the particle size distribution of a granular material by allowing the material to pass through a series of sieves of progressively smaller mesh size and weighing the amount of material that is stopped by each sieve as a fraction of the whole mass.
Liquid Limit Test
© 2019, IRJET | Impact Factor value: 7.211 | ISO 9001:2008 Certified Journal
| Page 3262
Plastic Limit Test
Plastic limit is defined as minimum water content at which soil remains in plastic state. The plasticity index is defined as the numerical difference between its Liquid limit and Plastic limit.
V. DATA ANALYSIS
The result of CBR test of soil sample performed in the laboratory under different times of soaking are represent in this table. Analysis & result of sample 1 to 4.
Atterberg’s Limit Free Swell Index % Max. Dry Density
gm/cc OMC%
CBR Unsoaked (0 Hrs.) CBR soaked (24 Hrs.) CBR soaked (48 Hrs.) CBR soaked
(72Hrs.) day Soaking CBR with 4
Liquid Limit (LL) % Plastic Limit (PL) % Plasticity Index (PI) %
38.40 20.53 17.87 24.5 1.9 12 18.57 9.66 7.14 6.05 5.02
Atterberg’s Limit Free Swell
Index %
Max. Dry Density
gm/cc OMC%
CBR Unsoaked (0 Hrs.) CBR soaked (24 Hrs.) CBR soaked (48 Hrs.) CBR soaked (72Hrs.)
CBR with 4 day Soaking Liquid Limit (LL) % Plastic Limit (PL) % Plasticity Index (PI) %
34.50 20.53 13.97 29.25 1.9 12 25.25 13.37 10.40 7.35 6.19
Atterberg’s Limit Free Swell
Index %
Max. Dry Density
gm/cc OMC%
CBR Unsoaked (0 Hrs.) CBR soaked (24 Hrs.) CBR soaked (48 Hrs.) CBR soaked (72Hrs.)
CBR with 4 day Soaking Liquid Limit (LL) % Plastic Limit (PL) % Plasticity Index (PI) %
33.26 20.53 12.73 16.3 1.87 9 21.54 12.63 11.88 10.40 8.37
Atterberg’s Limit Free Swell
Index %
Max. Dry Density
gm/cc OMC%
CBR Unsoaked (0 Hrs.) CBR soaked (24 Hrs.) CBR soaked (48 Hrs.) CBR soaked (72Hrs.)
CBR with 4 day Soaking Liquid Limit (LL) % Plastic Limit (PL) % Plasticity Index (PI) %
31.53 20.53 11.00 19.3 1.93 10 17.83 9.66 8.91 7.43 5.31
© 2019, IRJET | Impact Factor value: 7.211 | ISO 9001:2008 Certified Journal
| Page 3263
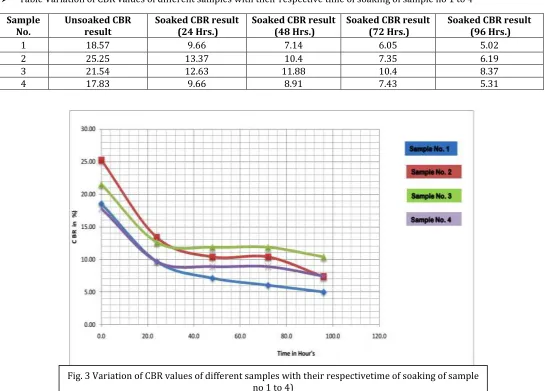
VI. CONCLUSIONIt is observed that the CBR value of the given soil sample decreases rapidly with time of soaking up to 24 hrs. and then decreases slowly. When soil samples are taken from different points of the CBR sample and tested. This Study is an attempt to understand the influence of soaking on CBR value subjected to different days of soaking and the corresponding variation in moisture content. It is observed that the CBR decreases and the moisture content increases for high degree of soaking. Table shows the results of different CBR values for different no. of samples for different conditions & durations.
Table Variation of CBR values of different samples with their respective time of soaking of sample no 1 to 4
VII. REFRENCES
[1] Arora K.R. (2009) “A Text book of Soil Mechanics” Standard Publishers Distributors.
[2] Annual Book of ASTM Standards 1997, Standard Test Method for CBR (California Bearing Ratio) of Laboratory-Compacted
Soils, ASTM D1883, West Conshohocken, PA
[3] Bindra S.P. (1977) "A Text Book of Highway Engineering" Dhanpat Rai and Sons, New Delhi
[4] Khanna S.K. and C.E.G. Justo (2013), “Highway Material and Pavement Testing” Nem Chand & Bros.
[5] Punmia B.C. , Ashok Kumar Jain & Arun Kumar Jain (2005) “A Text Book of Soil Mechanics & Foundations”.
[6] Singhal, R.P. (1967). Soil Mechanics and Foundation Engineering, Singhal Publications, India.
[7] Terzaghi, K. (1943). Theoretical soil Mechanics, Chapman and Hall, London and John Wiley & Sons.
[8] Terzaghi, K. and Peck, R.B. (1967). Soil Mechanics in engineering practice, Hohn Wiley & Sons.
Sample
No. Unsoaked CBR result Soaked CBR result (24 Hrs.) Soaked CBR result (48 Hrs.) Soaked CBR result (72 Hrs.) Soaked CBR result (96 Hrs.)
1 18.57 9.66 7.14 6.05 5.02
2 25.25 13.37 10.4 7.35 6.19
3 21.54 12.63 11.88 10.4 8.37
[image:5.612.35.580.182.573.2]4 17.83 9.66 8.91 7.43 5.31
© 2019, IRJET | Impact Factor value: 7.211 | ISO 9001:2008 Certified Journal
| Page 3264
[9] Vinod, P. and Reena, C. 2008. Prediction of CBR Value of Lateritic Soils Using Liquid Limit and Gradation Characteristics
Data, Highway Research Journal, IRC, 1 (1): 89-98.
[10] National Cooperative Highway Research Program (NCHRP). 2001. Guide for Mechanistic and Empirical–Design for New
and Rehabilitated Pavement Structures, Final Document, Appendix CC-1: Correlation of CBR Values with Soil Index Properties, West University Avenue Champaign, Illinois, USA.
[11] “Guidelines for the Design of Flexible Pavements for low volume of Rural road” IRC- SP-72
[12] IS 2720 Part-2 “Method of test for Soil-Determination of Moisture Content.
[13] IS 2720 Part-4 “Method of test for Soil-Determination of Sieve Analysis.
[14] IS 2720 Part-5 “Method of test for Soil-Determination of Liquid limit and Plastic limit”
[15] IS 2720 Part –8 “Method of test for Soil-Determination of Water Content, Dry density relation using a heavy Compaction”
[16] IS 2720 Part-16 “Methods of test for Soil-Laboratory determination of CBR ”Partha Chakroborty & Animesh Das “Principles
of Transportation Engineering” Ministry of Road Transport and Highways Report of the Specifications for Road and Bridge Work in India.
[17] IRC-SP 72-2007, "Guidelines for the Design of Flexible Pavements for Low Volume Rural Roads" IRC, New Delhi.