ANALYSIS OF PERFORMANCE EFFICIENCY OF SELECTED PUBLIC SECTOR BANKS IN INDIA
THROUGH INTERMEDIATION APPROACH
1
Premalatha, K. and
1
Anna
2
KCT Business School, Kumaraguru College of technology,
ARTICLE INFO ABSTRACT
A sound and profitable banking sector is better able to withstand negative shocks and contributes to the stability of the financial system (Athanasoglou
the growth of the economy and with stand the growth of
about the performance efficiency of Indian public sector banks, among nineteen public sector banks twelve Indian public sector banks has been selected for the analysis it is based on the weight age of Input and
other and they have the different efficiency level and to know where the banks stand will be identified in this paper. The result of the Data envelopment analysis and
Oriental bank of commerce is performed well in most of the years followed by united bank of Indian Bank and Indian Overseas bank. The results are based on the traditional cross efficiency matrix.
Copyright © 2014 Premalatha, and Dr. Nedunchezhian
unrestricted use, distribution, and reproduction in any medium, provided the original work is properly cited.
INTRODUCTION
The banking industry or systems are one of the necessary in the modern society. It plays a vital role in the way of economic development and supply of money of money in a advanced manner to the general public. During 1969 the government of India nationalized 14 major banks and 6 more banks in 1900. The forms and reforms of Indian economy started its progress after the LPG come into existence that is Liberalization, Privatization and Globalization. After the existence of RBI the Indian banking industry started its operation under the guidance or supervision of Reserve bank of India. The Indian banking industry comprises of four segments like financial institution, financial markets, financial instruments and financial services. The banking industry falls under the financial institution segment. The main aim of the banking industry is to mobilize funds and allocate them in a efficie manner. There are about 29 public sector banks, 13 Old private sector banks and 7 new private sector banks are functioning in India after 1990’s foreign also started its operation in India. The banking operations started with the healthy competition among the banks which were all functioning in India in the mean of financially, operationally, profitability, service and quality. Indian Banking industry valued at 77trillion (source: IBEF) is growing at slower pace and plagued by bad loans.
*Corresponding author:Dr. Nedunchezhian, V. R.
KCT Business School, Kumaraguru College of Technology Coimbatore, Tamilnadu, India.
ISSN: 0975-833X
Vol. 6, Issue, 11, pp.103
Article History:
Received 19th August, 2014
Received in revised form
28th September, 2014
Accepted 04th October, 2014
Published online 30th November,2014
Key words:
Benchmarking, Performance Efficiency, Data Envelopment analysis.
RESEARCH ARTICLE
ANALYSIS OF PERFORMANCE EFFICIENCY OF SELECTED PUBLIC SECTOR BANKS IN INDIA
THROUGH INTERMEDIATION APPROACH
Premalatha, K. and
2*Dr. Nedunchezhian, V. R.
Anna University, Chennai, Tamilnadu, India
KCT Business School, Kumaraguru College of technology, Coimbatore, Tamilnadu, India
ABSTRACT
A sound and profitable banking sector is better able to withstand negative shocks and contributes to the stability of the financial system (Athanasoglou et al., 2005). The sound banking system enhances the growth of the economy and with stand the growth of the country. The present study aims to study about the performance efficiency of Indian public sector banks, among nineteen public sector banks twelve Indian public sector banks has been selected for the analysis it is based on the weight age of Input and Output weight of the banks. Different types of banks are efficiently differing from each other and they have the different efficiency level and to know where the banks stand will be identified in this paper. The result of the Data envelopment analysis and
Oriental bank of commerce is performed well in most of the years followed by united bank of Indian Bank and Indian Overseas bank. The results are based on the traditional cross efficiency matrix.
and Dr. Nedunchezhian. This is an open access article distributed under the Creative Commons Att use, distribution, and reproduction in any medium, provided the original work is properly cited.
The banking industry or systems are one of the necessary in the modern society. It plays a vital role in the way of economic development and supply of money of money in a advanced manner to the general public. During 1969 the government of India nationalized 14 major banks and 6 more banks in 1900. The forms and reforms of Indian economy started its progress nto existence that is Liberalization, Privatization and Globalization. After the existence of RBI the Indian banking industry started its operation under the guidance or supervision of Reserve bank of India. The Indian gments like financial institution, financial markets, financial instruments and financial services. The banking industry falls under the financial institution segment. The main aim of the banking industry is to mobilize funds and allocate them in a efficient manner. There are about 29 public sector banks, 13 Old private sector banks and 7 new private sector banks are functioning in India after 1990’s foreign also started its operation in India. The banking operations started with the healthy competition ng the banks which were all functioning in India in the mean of financially, operationally, profitability, service and quality. Indian Banking industry valued at 77trillion (source: IBEF) is growing at slower pace and plagued by bad loans.
Dr. Nedunchezhian, V. R.
Technology,
During the financial year 2010
Growth Rate (CAGR) is around 8.2percentage for assets and Deposits was around 21.2percentage. It shows the growing pattern of Indian Banking Industry through corresponding years.
Review of literature
The review of literature speaks about the past analysis which speaks about the performance of banking industry in different area with different analysis in a different state of solutions.
Chernas et al. (1981), presented a model for measuring the
efficiency the efficiency of Decision Making Units (DMU), along with related methods for implementation and interpretation. The term DMU intends to emphasize the orientation towards management oriented entities Public and nonprofit sectors. The proposed approach
multiple outputs and designated inputs which were common for such DMUs. Here imputations of a market price value were not required. John and Green (1994), examined efficiency and cross efficiency in DEA, they developed the concept of cros efficiency in a new number of new directions, in terms of peer appraisal and as opposed to self appraisal implied to simple efficiency measures and discussed the relative measures/ metrics of each. They also presented mathematical formulations and initiative in three possible implementations of aggressive and cross efficiency.
International Journal of Current Research
Vol. 6, Issue, 11, pp.10363-10367, November,2014
INTERNATIONAL
ANALYSIS OF PERFORMANCE EFFICIENCY OF SELECTED PUBLIC SECTOR BANKS IN INDIA
, Tamilnadu, India
A sound and profitable banking sector is better able to withstand negative shocks and contributes to ., 2005). The sound banking system enhances the country. The present study aims to study about the performance efficiency of Indian public sector banks, among nineteen public sector banks twelve Indian public sector banks has been selected for the analysis it is based on the weight age of Output weight of the banks. Different types of banks are efficiently differing from each other and they have the different efficiency level and to know where the banks stand will be identified Cross efficiency result shows that Oriental bank of commerce is performed well in most of the years followed by united bank of Indian Bank and Indian Overseas bank. The results are based on the traditional cross efficiency matrix.
is an open access article distributed under the Creative Commons Attribution License, which permits
During the financial year 2010 – 2012 Compound Annual Growth Rate (CAGR) is around 8.2percentage for assets and Deposits was around 21.2percentage. It shows the growing pattern of Indian Banking Industry through corresponding
The review of literature speaks about the past analysis which speaks about the performance of banking industry in different area with different analysis in a different state of solutions. . (1981), presented a model for measuring the ncy the efficiency of Decision Making Units (DMU), along with related methods for implementation and interpretation. The term DMU intends to emphasize the orientation towards management oriented entities Public and nonprofit sectors. The proposed approach was applicable to multiple outputs and designated inputs which were common for such DMUs. Here imputations of a market price value were John and Green (1994), examined efficiency and cross efficiency in DEA, they developed the concept of cross efficiency in a new number of new directions, in terms of peer appraisal and as opposed to self appraisal implied to simple efficiency measures and discussed the relative measures/ metrics of each. They also presented mathematical tive in three possible implementations of aggressive and cross efficiency.
Bharathi Patak (2003), compares the performance of private sector banks in India. The analysis comprises in several ratios four main categories to assess the financial performance of the banks namely Parameters like Finance, Operational, Profitable and Productivity. The results provides that HDFC emerged as top performer in financially, operationally, profitable and productivity followed by ICICI bank they have close performance among the parameters. Edelstein (2004), used Data Envelopment Analysis (DEA) to examine the retail benchmark network of one Canada five largest banks using Deposits and Advances with intermediation efficiency levels, generated through branches their levels of bad loans and their business environment. Their first aim is to maximize loan quality by minimizing the levels of loans produced, second was to maximize the levels of deposits and loans generated; third to maximize the level of potential business that could be generated. The results obtained from the models were further broken down into market segments and geographical regions. It was concluded from the results that a smaller number of DMUs would lead to a higher percentage of efficient DMUs and higher average efficiency score.
Goncalves (2008), aims to study the quality measurement of Brazil top 50 banks during 1995 – 2006 by using Data Envelopment Analysis (DEA). Generally bank management is acknowledged to contributor to a financial institution failure it was not calculated for the lack of objective measure. The researcher presented a new paradigm approach for quantifying a banks managerial efficiency, using Data Envelopment Analysis (DEA) it influenced by multiple Inputs and Multiple outputs to compute the scalar measure of efficiency and management quality. The result provides the early identification of troubled banks and was commanded as a tool for off-site bank supervision in Brazil. Liang (2008), evaluated the Data Envelopment Analysis (DEA) and cross efficiency analysis which not only ranks the Decision Making Units (DMU) but also eliminates the unrealistic DEA weighting schemes without requires any weight restrictions. Eken and Kele (2011) measure bank branch performance using Data Envelopment Analysis (DEA) in Turkish bank branches and conclude that branch size and scale efficiency are related to each other. With the help of Data Envelopment Analysis and Tobit Model San, Theng and Heng (2011) compare the efficiency of domestic and foreign banks in Malaysia and find that Domestic banks have a higher efficiency level than foreign banks.
Marimuthu and Arokiasamy (2011) conducted a study on Conventional banks and productivity level: The Malaysian perspective. The results revealed that 70% of conventional banks have shown improvement in productivity level. Gebremichael and Rani (2012) used Malmquist Productivity Index to study the total factor productivity of Microfinance Institutions in Ethiopia and find that 84% MFI has shown technical efficiency change and 26.3% have shown technological efficiency change. Ram Pratap Sinha (2013), measures the comparison commercial banks by using DEA analysis, 49 Indian commercial banks were used for the study. The results assumed that each bank simultaneously attempts to maximize good output and minimize bad output. The analysis of results indicate that the new private sector commercial
banks performed the best, followed by the old private sector banks, nationalized banks and the SBI Group.
MATERIALS AND METHODS
Among the nineteen public sector banks in India ,twelve bank has been selected for the study. Twelve banks were selected based on the weight age of the input and output of the public sector banks. Secondary data was used for the study and it is collected from Prowess, Capitoline, RBI data publications. For theoretical purpose the data has been collected from journals, articles, reviews, banks bulletin etc., Data envelopment analysis and Cross efficiency were used for the analysis. The sample size selection is based on the Input and Output of the banks. The input and output selected based on the Intermediation approach.
Name of the Bank Input Output Average
State Bank of India 600872.7 605830.6 603351.7
Punjab National Bank 209114.6 203584.5 206349.5
Bank of Baroda 200114.6 182786.1 191450.4
Canara Bank 185754.3 179577.9 182666.1
Bank of India 188110.5 175597.1 181853.8
Union Bank of India 132987.9 127167.8 130077.8
Central Bank of India 120942.3 114427.8 117685.1
Allahabad Bank 151406.2 82179.99 116793.1
Indian Overseas Bank 101150.8 97154.34 99152.58
Syndicate Bank 96897.31 91695.18 94296.25
UCO Bank 92058.64 85767.65 88913.14
Oriental Bank of Commerce 89296.16 87051.66 88173.91
Corporation Bank 73990.76 71409.89 72700.32
Indian Bank 69215.93 68428.09 68822.01
Andhra Bank 60073.94 58242.12 59158.03
United Bank of India 51801.99 49599.4 50700.7
Bank of Maharashtra 49569.64 47427.11 48498.38
Vijaya Bank 49452.92 47326.3 48389.61
Dena Bank 43142.58 40988.09 42065.34
Punjab & Sind Bank 35050.94 33351 34200.97
Source: RBI statistics.
Among this last twelve bank has selected based on their ranking level. The total period of 2002-2002 – 2012-2013 covers the analysis.
Intermediation approach: Where banks are financial institutions which can use certain inputs to create a set of outputs. Input oriented model that captures the extent of reduction of costs that is essential for achieving a given level of output,
Source: “Analysis of efficiency in the Indian banking Sector using the data
envelopment analysis” RBI publications dated 21st November 2013.
Data Envelopment analysis
activities to be described as the conversion of certain inputs into various forms of output. The concept is formalized in the following linear programming model, introduced by Charnes, Cooper and Rhodes in their paper (Charnes, Cooper and Rhodes, 1978):
n
Max ho = ∑ wf yjko = 1
F=1
Such that
m
∑ vf iko = 1
F=1
n m
∑ wf yjk ≤ ∑ vf ik k=1,……,K
F=1 F=1
w,v ≥ ε
where K is the number of the decision making units, m is the number of inputs, and n is the number of outputs. This model is called the primal DEA model. It allows the unit being measured to determine the set of optimal weights for outputs denoted by and for inputs denoted by so as to maximize its efficiency. Along with it a dual model is used as well. It is a non parametric test which is used with Inputs and Outputs of the bank statement. Inputs and Outputs has selected on the basis of rbi article. Data Envelopment Analysis provides the bank level efficiency score and it does not require about any specific underlying technology. DEA is past analysis is done to identify the factors that determine for efficiency of the branch and suggest ways for improving the performance.
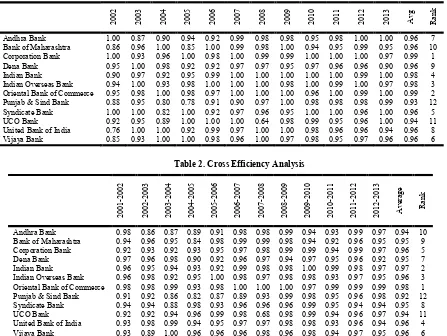
DEA is the tool used to asses the relative efficiency of units, in this case the banks in either minimization of Input or maximization of Output this study is based on the maximization of output. While running the DEA model with three inputs and two outputs, with reference to Table 1 all the selected efficiency scores has attained more than 90 percentage for all the selected Decision Making Units (DMU) and the main thumb rule while running the model is “The sample size should be at least two or three times larger than the sum of Inputs and Outputs”, here with this above table the efficiency score has attained. The Table 1 shows that the performance efficiency of selected twelve banks over a period of time the efficiency was measured through Data Envelopment Analysis-Intermediation approach. Every year by keeping a benchmark bank as reference bank the efficiency has measured based on that the average and the rank has been given. The benchmark bank was selected according to the maximum score of weighted input and output. The overall efficiency shows that Corporation bank has ranked one with the average score of (0.99) followed by oriental bank of commerce (0.99) it has also scored the same but point of difference in the years average level point score and rank as number 2. The score of other public sector banks are Indian Overseas bank (0.98), Indian bank (0.98), Syndicate bank (0.96), Vijaya bank (0.96), Andhra bank (0.96), United bank of India (0.96), Dena bank (0.96), Bank of Maharashtra (0.96), UCO bank (0.94), Punjab and sind bank (0.93).
DEA – Cross efficiency average
Cross efficiency: The cross efficiency analysis is analyzed every year by keeping every single bank as benchmark bank
Table 1. Data Envelopment Analysis
200
2
200
3
200
4
200
5
200
6
200
7
200
8
200
9
201
0
201
1
201
2
201
3
Avg Rank
Andhra Bank 1.00 0.87 0.90 0.94 0.92 0.99 0.98 0.98 0.95 0.98 1.00 1.00 0.96 7
Bank of Maharashtra 0.86 0.96 1.00 0.85 1.00 0.99 0.98 1.00 0.94 0.95 0.99 0.95 0.96 10
Corporation Bank 1.00 0.93 0.96 1.00 0.98 1.00 0.99 0.99 1.00 1.00 1.00 0.97 0.99 1
Dena Bank 0.95 1.00 0.98 0.92 0.92 0.97 0.97 0.95 0.97 0.96 0.96 0.90 0.96 9
Indian Bank 0.90 0.97 0.92 0.95 0.99 1.00 1.00 1.00 1.00 1.00 0.99 1.00 0.98 4
Indian Overseas Bank 0.94 1.00 0.93 0.98 1.00 1.00 1.00 0.98 1.00 0.99 1.00 0.97 0.98 3
Oriental Bank of Commerce 0.95 0.98 1.00 0.98 0.97 1.00 1.00 1.00 0.96 1.00 0.99 1.00 0.99 2
Punjab & Sind Bank 0.88 0.95 0.80 0.78 0.91 0.90 0.97 1.00 0.98 0.98 0.98 0.99 0.93 12
Syndicate Bank 1.00 1.00 0.82 1.00 0.92 0.97 0.96 0.95 1.00 1.00 0.96 1.00 0.96 5
UCO Bank 0.92 0.95 0.89 1.00 1.00 1.00 0.64 0.98 0.99 0.95 0.96 1.00 0.94 11
United Bank of India 0.76 1.00 1.00 0.92 0.99 0.97 1.00 1.00 0.98 0.96 0.96 0.94 0.96 8
[image:3.595.77.524.459.795.2]Vijaya Bank 0.85 0.93 1.00 1.00 0.98 0.96 1.00 0.97 0.98 0.95 0.97 0.96 0.96 6
Table 2. Cross Efficiency Analysis
200
1
-2
0
02
200
2
-2
0
03
200
3
-2
0
04
200
4
-2
0
05
200
5
-2
0
06
200
6
-2
0
07
200
7
-2
0
08
200
8
-2
0
09
200
9
-2
0
10
201
0
-2
0
11
201
1
-2
0
12
201
2
-2
0
13
Avera
g
e
Rank
Andhra Bank 0.98 0.86 0.87 0.89 0.91 0.98 0.98 0.99 0.94 0.93 0.99 0.97 0.94 10
Bank of Maharashtra 0.94 0.96 0.95 0.84 0.98 0.99 0.99 0.98 0.94 0.92 0.96 0.95 0.95 9
Corporation Bank 0.92 0.93 0.92 0.93 0.95 0.97 0.98 0.99 0.99 0.94 0.99 0.97 0.96 5
Dena Bank 0.97 0.96 0.98 0.90 0.92 0.96 0.97 0.94 0.97 0.95 0.96 0.92 0.95 7
Indian Bank 0.96 0.95 0.94 0.93 0.92 0.99 0.98 0.98 1.00 0.99 0.98 0.97 0.97 2
Indian Overseas Bank 0.96 0.98 0.92 0.95 1.00 0.98 0.97 0.98 0.98 0.93 0.97 0.95 0.96 3
Oriental Bank of Commerce 0.98 0.98 0.99 0.93 0.98 1.00 1.00 1.00 0.97 0.99 0.99 0.99 0.98 1
Punjab & Sind Bank 0.91 0.92 0.86 0.82 0.87 0.89 0.93 0.99 0.98 0.95 0.96 0.98 0.92 12
Syndicate Bank 0.94 0.94 0.88 0.98 0.93 0.96 0.96 0.96 0.99 0.95 0.94 0.94 0.95 8
UCO Bank 0.92 0.92 0.94 0.96 0.99 0.98 0.68 0.98 0.99 0.94 0.96 0.97 0.94 11
United Bank of India 0.93 0.98 0.99 0.94 0.95 0.97 0.97 0.98 0.98 0.93 0.96 0.94 0.96 4
and efficiency has been analyzed the rank has been provided for every single year and below table has ranked as per cross efficiency average. Traditional DEA models do not allow for ranking DMU’s on the basis of their performance of efficiency. Some time, it is possible in DEA that some of the inefficient DMU’s shows as better one. This is because of the unrestricted weights flexibility problem in DEA. In the determination of relative efficiency, the model allows for unrestricted weights. Thus, DMU can achieve a high relative efficiency score by being involved in an unreasonable weight scheme (Dyson & Thannassoulis, Wong & Beasley). Cross efficiency methods evaluate the performance of a DMU with
respect to the optimal input and output weights (Vj and Ui) of
other DMU’s. The resulting evaluations can be aggregated in a
cross efficiency matrix (CEM). In the CEM element in ith and
jth column represents the efficiency of DMUi when evaluated
with respect to the optimal weights of DMUj .
The results of the selected banks, were shown in Table 2, which scores high efficiency score constantly will attain maximum average score at attains ranked as 1, the lower earning bank will score lower score efficiency. The above table 2 represents average cross efficiency of all the selected twelve banks for the corresponding twelve years 2002- 2013. The overall cross efficiency of Oriental Bank of Commerce is 0.98 as it shows the maximum score in overall performance compare to other banks, followed by Indian bank 0.97. According to cross efficiency Table 3, Oriental bank of commerce there it was shows the most efficient bank during 2006-07, 2007-08, 2008-09, and 2012-13 and ranked 1. With reference to Table 3 Indian bank was ranked number 2 and it shows better performance during 2009-10 and 2010-11, third position was secured by Indian overseas bank which it has attained good performance score during 2002-03 and 2005-06. During analysis period four banks were secured Rank one one time during those years. The four banks are Andhra bank, Corporation bank, Syndicate bank and Vijaya bank. All the other banks ranks between 2 and 12 it clearly explained in both the above cross efficiency average and rank score table.
Findings and Conclusions
The DEA model is run with the components of Deposits, Borrowings, Operating expenses, Advances and Investments.
While running the model the result shows different efficiencies at the initial stage so to find the best efficiency bank created a problem. To overcome the problem, the cross efficiency is developed. The ranking of the banks are based on the overall cross efficiency table 3 revealed that oriental bank of
commerce, Indian bank and Indian overseas bank
outperformed compare to other banks during 2001-2002 to 2012-2013. The average cross efficiency of all the selected twelve banks for the corresponding twelve years 2002- 2013, the overall cross efficiency of Oriental Bank of Commerce is 0.98 it shows the maximum score in overall performance compare to other banks, followed by Indian bank 0.97. Oriental bank of commerce which shows the most efficient bank during 2006-07, 2007-08, 2008-09, and 2012-13 and was ranked as one. Indian bank ranked as number 2 and it shows better performance during 2009-10 and 2010-11, third position secured by Indian overseas bank attained good performance score during 2002-03 and 2005-06. During analysis period four banks secured Rank 1 one time during those years. The four banks are Andhra bank, Corporation bank, Syndicate bank and Vijaya bank. All the other banks ranks between 2 and 12 it clearly explained in both the above cross efficiency average and rank score table. The efficiency of the banks shows relatively efficient with one another and they also having the healthy completion among the selected banks. It can be conclude that the main objective of the study is to conform the efficiency banks through DEA model. DEA show the efficiency by using three inputs and two output variables and it also provides the efficiency and bench marking bank.
REFERENCES
Charnes, A., W. W. Cooper and E. Rhodas 1981. “Evaluating program and managerial efficiency: An application of DEA
analysis to program follow through” Management Science,
27(6): 668-697.
Barak Edelstein 2004. “Bank branch intermediation efficiency evaluation using Data Envelopment Analysis (DEA) and Non discretionary variables”, Ph.D. Thesis, Centre for management of technology and entrepreneurship, Toronto, Canada, http://www.cmte.utoronto.ca/home.shtml.
Charnes, A., Cooper, W.W. and Rhodes, E. 1978. Measuring
the efficiency of decision making units, European Journal
of Operation. Research, 2, pp 429-444.
Table 3. Cross efficiency ranks
200
1
-2
0
02
200
2
-2
0
03
200
3
-2
0
04
200
4
-2
0
05
200
5
-2
0
06
200
6
-2
0
07
200
7
-2
0
08
200
8
-2
0
09
200
9
-2
0
10
201
0
-2
0
11
201
1
-2
0
12
201
2
-2
0
13
Rank
Andhra Bank 1 12 11 10 11 4 3 4 11 10 2 4 10
Bank of Maharashtra 6 5 5 11 4 3 2 7 12 12 7 8 9
Corporation Bank 11 8 9 7 7 8 5 3 3 6 1 5 5
Dena Bank 3 4 4 9 10 10 9 12 9 4 11 12 7
Indian Bank 5 6 6 8 9 2 4 5 1 1 4 6 2
Indian Overseas Bank 4 1 8 4 1 6 8 6 5 11 5 9 3
Oriental Bank of Commerce 2 2 2 6 3 1 1 1 10 2 3 1 1
Punjab & Sind Bank 12 10 12 12 12 12 11 2 8 3 9 2 12
Syndicate Bank 7 7 10 1 8 11 10 10 4 5 12 10 8
UCO Bank 10 9 7 2 2 5 12 8 2 7 8 3 11
United Bank of India 9 3 3 5 6 7 7 9 7 9 10 11 4
Doyle John and Rodney Green 1994. “Efficiency and Cross
efficiency in DEA: Derivations, meaning and Uses”, The
Journal of the Operational Research Society, 45(5):
567-578.
Eken, M. and Kele, S. 2011. Measuring bank branch performance using Data Envelopment Analysis (DEA):
The case of Turkish bank branches. African Journal of
Business Management, 5(3), 889-901
Evaluation And Rating”, “Proceedings – 6th ISAHP 2001 Berne, Switzerland”, pp 149-158.
Gebremichael, B. and Rani, D. 2012. Total Factor Productivity Change of Ethiopian Microfinance Institutions (MFIs): A
Malmquist Productivity Index Approach (MPI). European
Journal of Business and Management, 4(3), ISSN
2222-2839.
Liang Liang, Jie Wu, Wade, D. Cook and Joe Zhu 2008, “Alternative Secondary Goals in DEA Cross efficiency
Evaluation”, International Journal of Production
Economics 113 (2), 1025-1030.
Marimuthu M. and Arokiasamy L. 2011. Conventional banks and productivity level: The Malaysian perspective. African Journal of Business Management, 5(6), 2493-2500.
Pires Goncalves, Ricardo 2008. “Manaagement Quality Measurement: Using Data Envelopment Analysis (DEA) estimation approach for banks in Brazil”, MPRA paper No.
11143, 16th October 2008,
http://mpra.ub.uni-muenchen.de/11142.
Dyson, R. G. and E. Thannassoulis 1988, “Reducing weight
flexibilityin Data Envelopment Analysis”, “Journal of
Operational research society” 39(6), 563-576.
Ram Pratap Sinha 2013. “A Comparison of the Performance of
Commercial Banks: DEA Evidence for India”, “The IUP
Journal of Bank Management”, Vol. XII, No. 2, 2013 pp
7-16.
Tihomir Hunjak, Drago Jakovčević 2001. “Ahp Based Model For Bank Performance
Wong, Y. H. B. and J.E. Beasley 1990. “Restricting weights
flexibility in Data Envelopment Analysis”, “Journal of
operational research society” 41(9) 829-835.