R E S E A R C H
Open Access
Colonization patterns of soil microbial
communities in the Atacama Desert
Alexander Crits-Christoph
1, Courtney K Robinson
1, Tyler Barnum
1, W Florian Fricke
2, Alfonso F Davila
3,
Bruno Jedynak
4, Christopher P McKay
3and Jocelyne DiRuggiero
1*Abstract
Background:The Atacama Desert is one of the driest deserts in the world and its soil, with extremely low moisture, organic carbon content, and oxidizing conditions, is considered to be at the dry limit for life.
Results:Analyses of high throughput DNA sequence data revealed that bacterial communities from six geographic locations in the hyper-arid core and along a North-South moisture gradient were structurally and phylogenetically distinct (ANOVA test for observed operating taxonomic units at 97% similarity (OTU0.03),P<0.001) and that
commu-nities from locations in the hyper-arid zone displayed the lowest levels of diversity. We found bacterial taxa similar to those found in other arid soil communities with an abundance ofRubrobacterales,Actinomycetales, Acidimicro-biales, and a number of families from theThermoleophilia.The extremely low abundance ofFirmicutesindicated that most bacteria in the soil were in the form of vegetative cells. Integrating molecular data with climate and soil geo-chemistry, we found that air relative humidity (RH) and soil conductivity significantly correlated with microbial com-munities’diversity metrics (least squares linear regression for observed OTU0.03and air RH and soil conductivity, P<0.001; UniFrac PCoA Spearman’s correlation for air RH and soil conductivity,P<0.0001), indicating that water availability and salt content are key factors in shaping the Atacama soil microbiome. Mineralization studies showed communities actively metabolizing in all soil samples, with increased rates in soils from the southern locations. Conclusions:Our results suggest that microorganisms in the driest soils of the Atacama Desert are in a state of stasis for most of the time, but can potentially metabolize if presented with liquid water for a sufficient duration. Over geological time, rare rain events and physicochemical factors potentially played a major role in selecting micro-organisms that are most adapted to extreme desiccating conditions.
Keywords:Soil microbial communities, Extreme environment, Arid soil, Atacama Desert, Desertification, High-throughput 16S rRNA sequencing
Background
Life can adapt to some of the harshest environments on Earth, from deep-sea hydrothermal vents to hypersaline lakes and acidic hot springs [1], but can life adapt to places where there is essentially no water and no nutri-ents? The Atacama Desert is one of the oldest and driest deserts in the world and its hyper-arid core has been described as ‘the most barren region imaginable’ [2,3]. While micro-organisms have been detected in the soil of the Atacama, little is known about the structure and composition of the microbial communities inhabiting its
soil and the processes shaping the assembly of those communities.
The Atacama Desert stretches 600 miles along the Pacific Coast of Northern Chile (19º-27ºS) and its sedi-mentary records indicates semi-arid to hyper-arid climates from the Jurassic period (150 million years ago) to the present day, with extremely arid conditions arising in the Miocene (15 million years ago) [3-5]. The Atacama Desert owes its extreme aridity to a constant climate regime pro-duced by a subtropical anticyclonic atmospheric subsid-ence - the Pacific Anticyclone. This is strengthened by the Humboldt Current - an upwelling, cold current along the west coast of South America - and the rain shadow effect from the Andean Cordillera to the East. The continentality effect that occurs when rain-bearing trade winds are * Correspondence:[email protected]
1
Biology Department, The Johns Hopkins University, 3400 N. Charles Street, Mudd Hall, Baltimore, MD 21218, USA
Full list of author information is available at the end of the article
blocked from penetrating continental interiors provides additional aridity in the desert [3,6]. Between parallels 22°S and 26°S is the hyper-arid core of the Atacama, one of the places with the lowest pluviometric activity in the world [2,6,7]. Long-term mean annual rainfall is only a few millimeters, with rain events typically occur-ring once per decade (http://www.meteochile.cl/; [2]). In addition, the high coastal mountains block the mar-ine fog [2]. As a result, soil surfaces are bare with sparsely vegetated areas found only where groundwater discharges via localized springs [6]. Geological and soil mineral analyses of the hyper-arid core report organic material detected at trace levels, nitrate accumulation -probably of atmospheric origin - and highly oxidizing conditions [2,8,9]. Other unique features include very low erosion and the accumulation of halite, gypsum, an-hydrite, and unusual salts such as perchlorates, nitrates, and iodates [5,10].
The extreme aridity of the Atacama Desert, together with broad daily temperature fluctuations and intense ultraviolet radiation, contribute to make the core of this desert an extreme habitat approaching ‘the dry limit of life on Earth’[8]. Nevertheless, micro-organisms inhabit this extreme environment. Studies have reported low numbers of culturable bacteria in soil samples of the arid core, ranging from not detectable to 106CFU/g of soil, and reflecting a great spatial heterogeneity [8,9,11-15]. With the use of molecular methods, the subsurface layers of the hyper-arid core were shown to harbor a very limited
microbial community dominated by Gemmatimonadetes
andPlantomycetesbacteria and also including Actinobac-teria,Thermomicrobia, and one member of the Proteobac-teria [9,11,12]. These micro-organisms were identified in soil samples where no vascular plant has grown for mil-lions of years and rain occurs only once every 20 to 50 years [8,9,11,12]. In less arid parts of the desert, soil bac-terial communities were characterized by a high
abun-dance of novel Actinobacteria and Chloroflexi taxa, and
low levels of Acidobacteria and Proteobacteria [11,16].
Fungi cultured from samples collected in several locations of the Atacama were all spore-forming saprophytes, sug-gesting that they might not be indigenous to the desert but rather dispersed by wind [17].
Relatively diverse, photosynthetic-based microbial communities have been described colonizing diaphan-ous rocks and halite evaporites in varidiaphan-ous parts of the desert [18-23]. These endolithic and hypolithic habi-tats are considered environmental refuges for life in hot and cold deserts, and harbor highly specialized communities [24]. Questions still remain about the presence of any stable and functional microbial com-munities in the Atacama soil, due to its physical in-stability, low nutrient content, and non-translucent properties [8,23,25].
Here, we use a combination of geological analyses, mineralization experiments, and non-culture based high throughput molecular methods to determine whether the Atacama soil is at the dry limit for life. Our analyses of community structure and composition, from soil sam-ples collected in the hyper-arid core and along a North-South moisture gradient, revealed a relatively simple ecosystem and indicated that salt content, together with water availability, significantly correlated with the diver-sity of microbial communities. Metabolic activity de-tected in soil samples with added moisture suggest that the soil community can be activated by rainfalls or heavy fog events, providing a means of adaptation to their ex-treme environmental conditions.
Methods
Sampling, soil geochemistry, and climate data
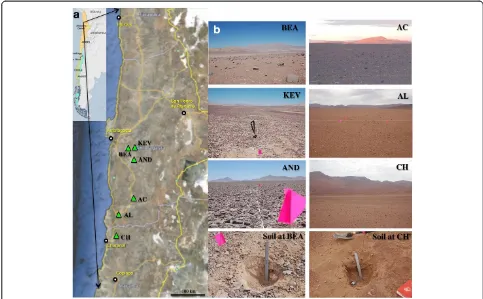
Soil samples were collected in the hyper-arid core of the Atacama Desert and along a 237-km North-South transect (Figure 1). The three locations in the hyper-arid core, Kevin Garden (KEV) (GPS: S24°01.943’, W069°42.257’; ele-vation 1,062 m above sea level), Bea Hill (BEA) (GPS: S24° 05.110’, W069°59.619’; elevation 1,003 m above sea level),
and Andrew Garden (AND) (GPS: S24°25.963’, W069°
41.096'; elevation 1,506 m above sea level) were sampled in 2009 along two perpendicular transects (A and B), every 10 m (from 0 to 50 m), and at the following soil depths: 0, 5, and 10 cm. Samples at each location along the North-South transect, Bea Hill (BEA), Aguas Calientes (AC) (GPS: S25°15.466’, W069°50.924’; elevation 1,888 m above sea level), Altamira (AL) (GPS: S25°41.114’, W070° 16.516’; elevation 936 m above sea level), and Chañaral (CH) (GPS: S26°09.839’, W070°17.105’; elevation 630 m above sea level) were collected in 2011, 1 m apart and in a triangle (A, B, and C), at the following soil depths: 0, 5, and 10 cm. Open soil samples were collected using aseptic techniques and stored in sealed sterile Whirl-Pack bags at room temperature during shipping (5 days) and then -20°C for all molecular analyses. A subset of the samples was stored at -4°C for mineralization experiments.
Soil total elemental analysis was performed by ICAP
spectrometry following HNO3/HClO4 digestion (method
2021; Cornell Nutrient Analysis Lab, Ithaca, NY, USA). Total carbon and total organic carbon (TOC) were deter-mined by total dry combustion with a LECO CNS-2000 Carbon Analyzer (Cornell Nutrient Analysis Lab, Ithaca, NY, USA). Soil measurements, pH, conductivity, water content, and texture were performed according to proto-cols described in the Standard Procedures for Soil Re-search in the McMurdo Dry Valleys LTER available through the MCM LTER public database at http://www. mcmlter.org.
sampling expeditions. Historical climate data were ob-tained from the literature [2,23,26].
Cell counts were carried out with DAPI as previously described [27].
DNA extraction, PCR amplification, and sequencing
Total genomic DNA was extracted from soil samples using the PowerSoil DNA Isolation kit (MoBio Labora-tories Inc., Solana Beach, CA, USA) following the man-ufacturer’s instructions. All sample manipulations and nucleic acid extractions were carried out in a laminar flow hood (AirClean Systems, Raleigh, NC, USA) and all materials and reagents were either filter sterilized, auto-claved, or UV-irradiated to prevent contamination. For 454 pyrosequencing, genomic DNA was amplified using the barcoded Universal primers 27 F (bacterial)/4Fa (ar-chaeal) and 534R for the V1-V3 hypervariable region of the 16S rRNA gene. The amplification reaction mixture
(25 μL) contained 200 μM deoxynucleoside
triphos-phates (dNTPs) each, 0.3 μM (each) primer, 1-5 ng/μL
of DNA template, 0.02 U/μL of Phusion High-Fidelity
DNA polymerase (New England BioLabs, Ipswich, MA),
1 × Phusion PCR buffer HF, 0.5 mM MgCl2, and 3%
DMSO. PCR conditions were one initial step of 30 s at 98°C, followed by 25 cycles of 10 s at 98°C, 15 s at 55°C,
and 15 s at 72°C, and with a final step of 10 min at 72°C, using a T3000 Thermal Cycler (Biometra, Horsham, PA, USA). Amplicons were purified with the AMPure Kit (Agencourt, Beckman Coulter Genomics, Danvers, MA, USA), and equimolar amounts (100 ng) of all amplicons were mixed in a single tube and sequenced by 454 pyro-sequencing using a Roche GS-FLX pyro-sequencing system (Roche-454 Life Sciences, Branford, CT, USA) by the Genomics Resource Center (GRC) at the Institute for Genome Sciences (IGS), University of Maryland School of Medicine using protocols recommended by the manu-facturer as amended by the GRC.
Processing of pyrosequencing data and analysis
The 454 sequences were processed using the QIIME package (v1.6.0) [28]. Sequences were de-multiplexed by binning sequences with the same barcode and primer se-quences in QIIME. Similar sese-quences with <3%
dissimilar-ity were clustered together using USEARCH [29] and de
novo chimera detection was conducted in UCHIME v5.1
[30]. The resulting average sequence length was 494 bp. Taxonomic ranks were assigned to each sequence using Ribosomal Database Project (RDP) Naïve Bayes Classifier v.2.2 [31], using 0.8 confidence values as the cutoff to a pre-built greengenes database of 16S rRNA sequences Figure 1Sampling site locations. (a)Relief map of northern Atacama Desert, Chile, with key field locations marked by green triangles;(b)
(Oct, 2012 vers.) [32]. Representative sequences of each
OTU0.03 were aligned with PyNAST [33] against the
Greengenes core set [34], gaps and parsimonious unin-formative characters were removed, and the filtered se-quences subsequently used to generate a phylogenetic tree with FastTree [35] for beta-diversity metrics using UniFrac [36,37]. Richness and diversity estimators were calculated based on OTUs with QIIME [28]. Principal Coordinate Analysis (PCoA) plots were generated with QIIME using unweighted and weighted UniFrac metrics, and Bray-Curtis distances [28,36]. Detrending of PCoA plots was also performed with QIIME [28]. The R statistical package was used to perform all statistical tests of diver-sity and geochemistry data [38]. The non-parametric Kruskal-Wallis one-way analysis of variance [39] was used to test differences in both diversity metrics and geochemistry between geographic locations and group-ings. Least Squares Linear Regression was used to test correlation hypotheses.
Mineralization
Soil microbial activity was assessed by monitoring the
mineralization of 14C-acetate added to microcosms
con-taining 5 g of soil and constructed according to [40]. Each microcosm, in triplicate with sterile controls (baked for 5 h at 160°C), was amended with a mixture of 1 mL of 10 mM sodium acetate (autoclaved and filtered sterilized) and 0.045μCi (1,2-14C) acetic acid (100,000 disintegrations per min) (Perkin Elmer, SA 54.3 mCi mmol-1) at the beginning of the experiment and at day 47. Microcosms were incu-bated at 20°C without shaking or illumination. CO2 traps
containing 0.5 mL of 1 M KOH were sampled every 1 to 7 days and radioactive counts were determined by liquid scintillation spectrometry using a Packard Tri-Carb 2200CA Scintillation Counter (Waltham, MA, USA). Mineralization was expressed as the cumulative radiolabel recovered as14CO2[40]. For days 47 to 89, mineralization
was calculated using the amount of radiolabeled substrate added at day 47.
Results
We combined environmental factor measurements with molecular data from non-culture-based high throughput molecular methods to identify the factors underlying the structure and composition of microbial assemblages in soil samples from the driest areas of the Atacama Desert.
Sampling locations and soil geochemical features
We focused our work on six locations along a North-South transect from the hyper-arid zone of the Atacama Desert to the north to a less arid area of the desert to the south; multiple sites were sampled within each of the six locations (Figure 1). The three Yungay locations within the hyper arid zone (KEV, AND, and BEA) have
identical mean annual temperatures, relative air humid-ity (RH), and annual rainfall while two of the southern locations (AL and CH) have similar climates (Table 1). The Yungay region in the hyper arid zone is extremely dry and receives an average of <1 mm of rainfall each year. These locations have a mean air temperature of 16.5°C, which is similar to the other three locations, and a significantly low air RH of 36%. The CH and AL sites receive a greater amount of yearly rainfall, up to 12 mm, and the air RH is twice as high. The AC location is both a geographic and climatic intermediate between Yungay and the two southern locations.
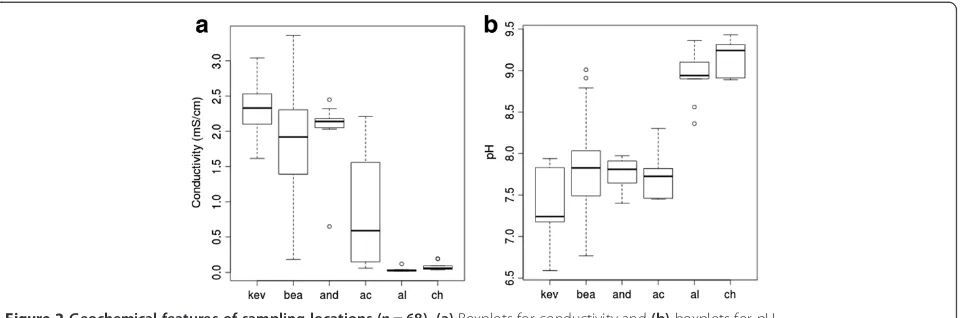
Analysis of the soil geochemistry of 68 samples (KEV, 16 samples; BEA, 18 samples; AND, 11 samples; AC, 5 sam-ples; AL, 9 samsam-ples; and CH, 9 samples) revealed trends among and within sampling locations (Table 2; Additional file 1: Table S1). Using the non-parametric Kruskal-Wallis test for one-way analysis of variance we identified signifi-cant differences between locations in terms of pH (H(5) = 42,P<0.001), and conductivity (H(5) = 46,P<0.001); these differences were not related to soil depth across all sam-ples (depths from 0 to 10 cm were sampled at all loca-tions). Of the 18 BEA samples, 15 were from 2008 and three were from 2011. There was no statistical differ-ence in conductivity between these groups (t (t-test statistic) = -1.39; P value = 0.27), but the 2011 samples had a higher mean pH than the 2008 samples (t = -9.35; P value <0.001). Partitioning the distributions of con-ductivity values for each geographic location separated the three Yungay locations (KEV, BEA, and AND) with higher conductivity values from the three southern loca-tions (AC, AL, and CH) with lower conductivity values (Figure 2a). With pH values, there is a distinct separ-ation between the two southernmost locsepar-ations (AL and CH) with higher pH values from the other four locations (KEV, BEA, AND, and AC) with lower average pH values (Figure 2b). We found a significant and direct inverse rela-tionship (β= -0.52,P<0.001) between pH and conductiv-ity values (Table 2).
Soil pH, conductivity, and calcium/sulfur elemental com-position were also significantly correlated across the dataset (Additional file 1: Tables S1 and S2). We found a positive linear correlation (β= 0.94, P <0.001) across locations be-tween the sulfur and calcium elemental compositions - the components of gypsum and anhydrite (CaSO4, +/-2H2O).
conductivity of 0.86 mS (millisiemens)/cm (s = 0.87) was re-corded. The variation in conductivity at AC was higher than any other location (Figure 2). The lowest variations in soil conductivity were observed in the AL and CH samples (s = 0.03, s = 0.06). Soil composition for most samples was sandy loam and we measured extremely low levels of total organic carbon (Table 2; data for 2009).
Within each location, we found some variability for conductivity and pH values. There was a significant posi-tive increase in pH (t = 4.55;P= 0.0002) with depth when the data were parsed for each sampling site, but no similar change in conductivity (Additional file 1: Table S10). Non-stochastic patterns of geochemistry across transects of sampling sites were not observed.
Molecular characterization of the soil microbial communities
We characterized the soil microbial communities from several geographic locations of the Atacama Desert using pyrosequencing of barcoded 16S rRNA gene PCR ampli-fication products using primer sets for Bacteria and for Archaea. No Archaea were found in any of the samples despite multiple attempts at PCR amplification using specific archaeal primers (4Fa and 338R [41]) with and without nested primers. We removed biases from se-quencing efforts, by generating taxonomic data rarefied to both 200 and 1,000 sequence counts using QIIME [28]. This resulted in the analysis of 139,549 sequence reads from 68 soil samples (as described above) with at least 200
sequences and 48 of these samples had at least 1,000 se-quences. This dataset represents an unprecedented level of detail for these communities. Assignment of Operational Taxonomic Units (OTUs0.03), defined as sharing at least
97% sequence similarity, resulted in a number of OTUs0.03
ranging from 69 to 332 (1,000-rarefaction level) per sam-ple, revealing that communities with wide ranges of rich-ness inhabit the soil of the Atacama Desert (Table 3). Diversity metrics at the 200-sequence level were lower than the same metrics at the 1,000-sequence level but comparative trends between samples were similar at both levels (Additional file 1: Table S3). Absolute diversity met-rics were reported at the 1,000-sequence level for max-imum coverage, while correlation analyses were performed at the 200-sequence level in order to include as many samples as possible. The slope of the rarefaction curves indicated that a large fraction of the community was sampled at the 1,000-sequence level (Additional file 1: Figure S1). While new OTUs were still being sampled at the 200-sequence level, the trend across the samples was conserved.
Several descriptive and predictive alpha metrics of diver-sity were calculated for each sample using QIIME [28] (Table 3). Ten iterations of the analyses were performed (1,000 sequence reads each) and the alpha diversity data from each were averaged. Across all samples, the average percent deviation from the mean was 4.1% for OTUs0.03,
1.6% for Shannon, and 14.0% for ChaoI. There was no stat-istical difference in richness between the BEA samples
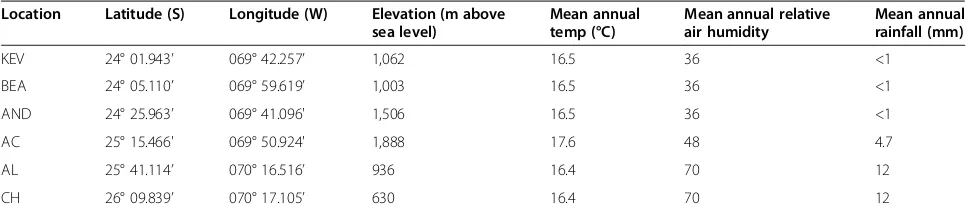
Table 1 Geographical and climate data for soil sampling locations in the Atacama Desert
Location Latitude (S) Longitude (W) Elevation (m above sea level)
Mean annual temp (°C)
Mean annual relative air humidity
Mean annual rainfall (mm)
KEV 24° 01.943’ 069° 42.257’ 1,062 16.5 36 <1
BEA 24° 05.110’ 069° 59.619’ 1,003 16.5 36 <1
AND 24° 25.963’ 069° 41.096' 1,506 16.5 36 <1
AC 25° 15.466' 069° 50.924' 1,888 17.6 48 4.7
AL 25° 41.114’ 070° 16.516’ 936 16.4 70 12
CH 26° 09.839’ 070° 17.105’ 630 16.4 70 12
Locations KEV, BEA, and AND are found in the Yungay hyper-arid zone.
Table 2 Mean soil geochemical properties, composition, and cell counts for each sampling location in the Atacama Desert
Location pH Conductivity
mS.cm-1 Ca mg.kg -1
S mg.kg-1 Na mg.kg-1 Sand % Silt % Clay % Texture TC % TOC % Cell count 103 cells.g-1soil
KEV 7.4 2.3 34186.3 24470.4 1944.5 70 13.8 16.3 Sandy loam 0.08 <0.01 3.1 (±2.5)
BEA 7.6 1.7 21308.2 9015.2 3233.1 85 6 9 Loamy sand 0.04 <0.01 6.7 (±4.3)
AND 7.8 2 33525.9 25218.2 2248.9 76 8 16 Sandy loam 0.16 <0.01 2.7 (±2.3)
AC 7.7 0.86 27244.9 12822.1 2908.6 87 5 8 Loamy sand nd nd 511 (±10.1)
AL 8.9 <0.1 9631.5 3.2 3498.3 93 5 2 Sand nd nd 24.5 (±3.1)
CH 9.2 0.1 6013.7 20.3 2928.5 83 15 2 Loamy sand nd nd 101 (±12.8)
collected in 2008 (15 samples) and in 2011 (3 samples) (t = 1.63;P= 0.185). A large number of observed OTUs0.03
were either singletons or doublets with abundance of those
‘rare’ OTUs0.03 (singletons + doublets) similar across all
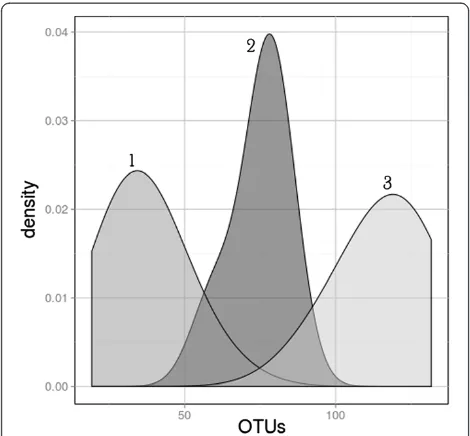
samples (Additional file 1: Table S4). We found there were three distinct clusters of locations based on alpha diversity; the northern Yungay locations (BEA, KEV, AND) with the lowest diversity, the central AC location, and the southern locations (CH, AL) with the highest levels of diversity (Table 3, Figure 3). Kernel probability density estimations of richness, which describe the relative likelihood of a sam-ple within a distribution having a given richness, were generated for each of the three aforementioned clusters. Comparing the probability densities between the clusters established three visually distinct geographic distributions (Figure 4). Variation in alpha diversity between locations was significant and greater than variation within each loca-tion. The KEV location had the lowest mean diversity, and a non-parametric Kruskal-Wallis ANOVA test showed that it was significantly lower in observed OTUs0.03 than the
BEA and AND locations (P <0.001 andP<0.001, respect-ively), both of which in turn were significantly lower than the AC site (P<0.001;P<0.001). The AC location also con-tained significantly fewer observed OTUs0.03 than the CH
and AL locations (P<0.001;P<0.001, respectively). The
range of alpha diversity metrics within each site was small with few outliers (Figure 3).
To test correlation between abiotic factors and soil microbial diversity metrics, we performed tests of Least Squares linear regression on the alpha diversity metrics
generated at the 200-sequence level (n= 68). We found
that conductivity and pH both significantly correlated with community richness, predicted diversity, evenness, phylogenetic diversity, and Shannon diversity across all locations (Additional file 1: Table S5). pH correlated dir-ectly with richness (P<0.0001) and conductivity correlated inversely with richness (P<0.001). Although the AC loca-tion had a slightly lower mean pH than either BEA or KEV, it had a significantly higher distribution of alpha di-versity metrics (Table 3). The same correlations proved significant at the 1,000-sequence level (Additional file 1: Table S6). There were no significant relationships between
both OTU0.03 count and Chao1 predicted diversity with
soil depth at either the 1,000 or the 200 level. Location cli-matic data were significantly correlated with all metrics of diversity (Additional file 1: Table S7). The climatic data are location-specific as opposed to sample-specific, and the correlation demonstrates the difference in diversity levels between the hyper-arid northern sites and the southern sites. Mean air relative humidity (RH), mean air Figure 2Geochemical features of sampling locations (n= 68). (a)Boxplots for conductivity and(b)boxplots for pH.
Table 3 Observed richness and diversity indices for soil samples based on 16S rRNA gene sequence assignments with
a 97% sequence similarity threshold, rarefied to 1,000 sequence reads (n= 48)
Samples OTU0.03observed
richness
Shannon index estimated diversity
Faith’s phylogenetic diversity index
Chao 1 diversity estimate
Pielou’s evenness index
KEV 69 2.6 3.1 134 0.42
BEA 99 4.3 5.7 157 0.64
AND 83 3.8 5.3 164 0.59
AC 163 5.9 9.6 244 0.80
AL 330 7.5 15.9 508 0.89
CH 282 7.0 14.5 396 0.85
temperature, and rainfall correlated directly with observed OTUs0.03 (P <0.001). Within locations, diversity did not
correlate with sample depth or with sampling site position and this included the sampling-transects for each of the three northern locations, KEV, BEA, and AND.
Beta diversity metrics were calculated to assess commu-nity similarity and to evaluate the effect of environmental and geographic metadata on the observed variations in diversity between sampling sites. Clustering analysis of rarefied 200-sequence (n= 68) for Bray-Curtis distances showed that communities from each location were more similar to each other than to communities from other locations and that communities from north/central and
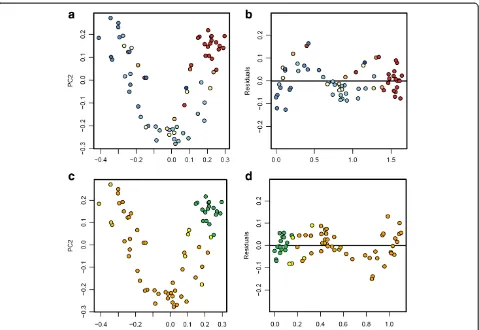
south locations clustered separately (Additional file 1: Figure S2). Average pairwise comparisons between all samples using unweighted UniFrac distances indicated that a community at any sampling site was more similar to another community from the same geographic location than to any other location (Additional file 1: Table S8). These results, together with non-parametric ANOVA test of alpha diversity metrics, indicated that each geographic location has distinct microbial assemblages. Principal co-ordinate analyses (PCoA) were performed on the rarefied 200-sequence (n= 68) unweighted UniFrac distance matrix using QIIME [28] (Figure 5a and 5c). Axis 1 of the PCoA plot explained 16% of the variation, and axis 2 explained 11% of the variation. When color-coded by conductivity values and air RH values, a visual separation of clusters is evident. Conductivity correlated strongly with both axis
1 of the unweighted UniFrac PCoA (Spearman’s R: 0.79;
P <0.0001) (Figure 5a) and axis 1 of a similar weighted UniFrac PCoA (Spearman’s R: 0.64;P<0.0001) (Additional file 1: Figure S3a). Mean air RH also correlated strongly with axis 1 of the unweighted UniFrac PCoA (Spearman’s R: -0.66;P<0.0001) (Figure 5c) and axis 1 of the weighted UniFrac PCoA (Spearman’s R: -0.63;P<0.0001) (Additional file 1: Figure S3c). As for pH, we found a good correlation with axis 1 of the unweighted UniFrac PCoA (spearman’s R: -0.78;P<0.0001), but a lower correlation with axis 1
of the weighted UniFrac PCoA (spearman’s R: -0.44;
P <0.001). In order to better represent the differences be-tween samples in a linear fashion, the plot was detrended using QIIME and color-coded (Figures 5b and 5d). Sample depth did not correlate with either axis of an unweighted UniFrac PCoA. Similar trends were observed using data rarefied at the 1,000-level sequence reads (Additional file 1: Figure S4).
Phylogenetic diversity of soil microbial communities
Sequence reads were classified with the Ribosomal Database Project Classifier at 0.8 confidence threshold Figure 3Alpha diversity metrics for each sampling location, rarefied to the 1,000-sequence level (n= 48). (a)Boxplots of OTUs0.03
richness and(b)boxplots of the Shannon diversity index, both at the 97% sequence similarity threshold.
Figure 4A density plot of observed OTU0.03richness, rarefied
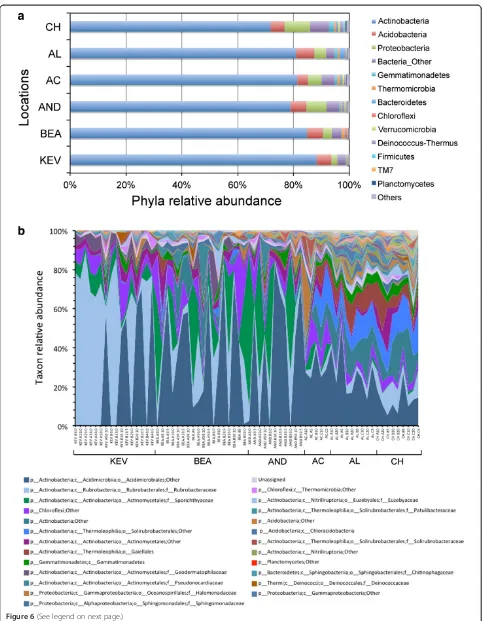
[31] in order to assess the phylogenetic distribution and taxonomic diversity of the soil samples. The overall phylum-level composition was similar among the six
desert locations and dominated byActinobacteria (72%
to 88%; Figure 6a), followed by Acidobacteria (3.8% to
6.6%), andProteobacteria(2.2% to 9.2%). Differences in
phyla abundance between sample’s groups were tested
using Metastats [42]. We found that the increased
abun-dance in members of theGemmatimonadetes and
Planc-tomycetes in the south samples (AC, AL, and CH) when compared to the north samples (KEV, BEA, and AND) was statistically significant (P>0.001; q = 0.02). No archaeal quences were found and 2.8% to 6.7% of the bacterial se-quences were unassigned.
Relative abundance of taxa at the order/family level (Figure 6b) greatly illustrated the change in community structure and composition revealed by analyses of alpha and beta diversity. Members of the Actinobacteriamostly belong to a small number of orders including Rubrobacter-ales, Actinomycetales, and Acidimicrobiales (Figure 6b). WhileRubrobacteraleswere dominant in the KEV location,
a shift toward Acidimicrobiales and Actinomycetales was
observed for the BEA and AND locations. At the taxo-nomic level, the most southern locations (AC, AL, and
CH) were more diverse with members of the
Acidimicro-biales, Rubrobacteralesbut also of theGemmatimonadetes, Bacteroidetes,and a number of families from the Thermo-leophilia (class of Actinobacteria) [43]. The evenness of these later communities, represented by the Pielou’s even-ness index, was notably higher than that of the northern communities (Table 3) and expressed by a larger number of members per taxonomic group (Figure 6b). While a number ofChloroflexitaxa were found across all soil sam-ples, very few members of theFirmicuteswere detected.
Soil metabolic activity
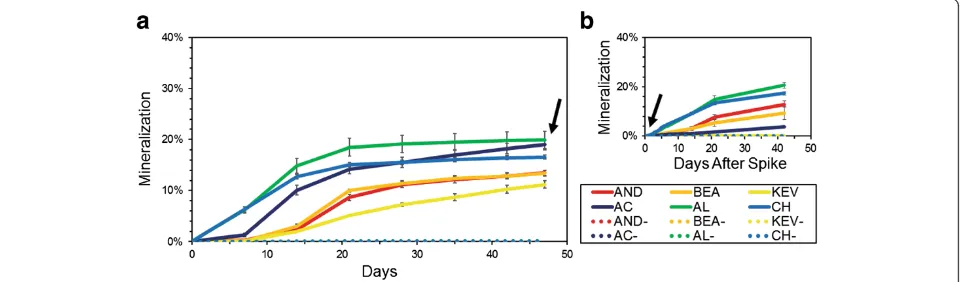
Mineralization of radiolabeled acetate was detected in all soil samples but rates were notably different (Figure 7). Samples from the south locations showed mineralization within 7 days and reach maxima of 18% to 21% of
acet-ate mineralized to CO2in 21 days, whereas we observed
a lag time for mineralization with samples from the Figure 5Unweighted Unifrac principal coordinate analyses (PCoA) of samples at the 200-rarefied level (n= 68), calculated with QIIME. (a)PCoA color-coded by conductivity values (low conductivity: red, average: white, high: blue), and(b)the same plot detrended with QIIME.
north locations and lower mineralization maxima. A second addition of substrate at 47 days resulted in a rapid restart of mineralization - within 1 day - for all samples with the exception of AC (Figure 7). Controls did not show any activity for the 90-day experiment.
Discussion
The Atacama Desert presents a unique physiography, a range of hyper-arid conditions, climate regimes, and geology within a relatively small region, providing a number of unique habitats for microbial communities [24,25]. Of particular relevance is a steep rainfall gradi-ent along a North-South transect between 23ºS and 29ºS, where precipitation increases from <1 mm year-1 to >40 mm year-1[2,23]. The Atacama rainfall gradient represents a unique natural setting to study how life re-sponds to increasing water stress towards the hypothet-ical dry limit of life. We conducted a high-resolution sampling of near surface soils (0-10 cm) and applied a combination of geochemistry and molecular data to characterize the microbial community along the rainfall gradient, and to determine the environmental factors shaping the community structure in these soils.
Geochemical analyses of our study sites revealed a high degree of heterogeneity with the greatest variability in soil mineralogy between geographical locations. The southernmost soils were more alkaline than the other soils, which might reflect a greater influence from salts of marine origin [44,45]. In contrast, more inland salt deposits in the Atacama are thought to be the result of eolian dispersion from local salars [44].
Our molecular data provided a good coverage of the soil microbial diversity, underlining the low microbial di-versity of the Atacama soil microbiome. Similarly low
numbers for OTUs0.03 richness were reported for
com-parable studies of Atacama soils at the hyper-arid mar-gin [16] and for several locations in the Antarctica Dry Valleys [46]. Alpha diversity metrics showed stochastic variations at multiple sampling sites within each geo-graphic location, but significant differences were found between locations. Analyses of beta diversity indicated that communities from each geographic location were structurally and phylogenetically distinct.
Changes in soil microbiology along the North-South transect were correlated with water availability, described as air mean RH and mean annual rainfall. Changes were also inversely correlated with soil conductivity, a proxy for water availability (that is, more salt, less water) [47]. Microbial diversity, community structure, and rates of metabolic activity were clearly distinct between the driest localities and the wettest ones, with an apparent inter-mediate transition zone (AC) located between S25º0’and S25º30’. Lowest diversity was found in the northern sam-ples where water availability reaches minimum values. These soils also had relatively high salt contents associated with high levels of Na, Ca, and S, and the presence of gyp-crust close to the soil surface (within 10 cm), indicating persistent aridity over geological time [48]. Microbial di-versity was significantly higher at the southernmost sampling localities where mean annual rainfall was one order of magnitude higher and near-surface soils were likely wetted yearly. The higher level of precipitation (See figure on previous page.)
Figure 6Relative abundance of major taxonomic groups in all Atacama soil samples based on environmental 16S rRNA gene sequences. (a)Phyla relative abundance; phyla with <1% abundance are represented in‘others’;(b)relative abundance of order/families (>10 counts summed across all samples); first 25 taxa are described in the figure legend; a list of all taxa is in (Additional file 1: Table S9). Analyses were performed using samples at the 200-rarefied level (n= 68).
Figure 7Mineralization of (1,2-14C) acetic acid at 20°C in microcosms with Atacama soil samples.Each point represents the mean
cumulative mineralization expressed as the cumulative % of radiolabel recovered as14CO
2from triplicate assays including sterile controls (dashed
experienced by the southern soils was substantiated by low salt contents as the result of leaching toward higher depths [48,49].
Soil heterotrophic bacteria commonly encountered in arid environments were shared between all soil samples
and included members of the Rubrobacterales,
Actino-mycetales, andAcidimicrobiales [16,50]. The abundance of the various taxonomic groups varied significantly be-tween soil locations. Radiation tolerant and desert dwelling
bacteria from theRubrobacteraleswere most abundant in
the driest locations while the southern locations displayed a number ofThermoleophiliafamilies, including Solirubro-bacteraceae andPatulibacteraceae. These taxa, closely re-lated to theRubrobacteraceae, are found in biological soil crusts [51] and have been reported in less arid soils of the Atacama Desert [16].Chloroflexiwere found across all soil locations and have been observed in hypolithic and various soil communities of the Atacama Desert [16,52-54]. No ar-chaeal sequences were found as was reported for Antarctic soils of similar composition [46,55].
Using soil microcosms amended with radiolabeled acetate we detected metabolic activity in all tested sam-ples, indicating a viable portion of the soil community in all localities. These are conventional methods typically used to detect metabolic activity in extreme environments such as at subzero temperatures and in hyper-arid deserts [8,56-59]. Different experimental settings make it difficult to compare our results with previous experiments using Atacama soil [8,57]; however, similarly to Quinn et al. [57], we observed a resumption of CO2production after a
second injection of substrate. Our mineralization rates were consistent with studies using Canadian high Arctic soil samples, taking into consideration differences in incu-bation temperatures [40,60,61]. Detectable mineralization rates in the northernmost Atacama samples were ob-served after 7 days of incubation, while the southernmost samples mineralized faster and in higher amounts. These trends could be due to a difference in cell abundance, resulting in smaller rates of mineralization and smaller consumption of labeled substrate in the northernmost samples. Alternatively, they could be explained by a differ-ence in the physiological state of soil micro-organisms, with a rapid activation in the southernmost samples that witness yearly rainfall, and a slow activation in the north-ernmost samples that witness decadal rainfall. While estimated cell abundances vary by up to two orders of magnitude between the northernmost and the southern-most samples (Table 2), mineralization rates and net
amounts were similar between AL (2.4×10⁴ cells g-1 of
soil) and CH (1×10⁵cells g-1of soil), suggesting that both cell abundance and physiological state might be significant in explaining the different rates of mineralization. Soil micro-organisms at the dry end of our sampling transect are challenged by severe oligotrophic conditions, as
illustrated by the extremely low TOC and total nitrogen levels in these soils (Table 2 and [11,16,62]), and it is therefore likely that both extreme water stress and re-stricted access to organic substrates are limiting factors for theirin situactivity and growth. Determining the state of dormancy and the rate at which metabolic activity is re-covered in Atacama soil communities will require careful isolation and in depth physiological and molecular studies of microbial strains from both the north and south locations.
Together, our results suggest that: (1) soil micro-organisms in the driest Atacama soils are in a state of sta-sis for most of the time, but can potentially metabolize if presented with liquid water for sufficient time; and (2) there is, or has been, a degree of selection on the soil microbial communities in response to environmental con-ditions. Correlation with water availability and soil salt content revealed that these factors are potentially the drivers for the variations in diversity observed in the soil, and likely the drivers for selection. One possible source of water in this extremely dry environment could be the deliquescence of soil salts such as NaCl, similar to micro-organisms inhabiting halite nodules in ancient saltpans within the same hyper-arid region [63,64]. A similar mechanism was also suggested for halite- and perchlorate-rich soils, 2-m-deep in the Atacama subsur-face [65]. The soils we analyzed did not contain nearly as much salt as the hypersaline subsurface described by Parro et al. [65], suggesting that near-surface soil (up to 10 cm) of the hyperarid core, because of its loose struc-ture and limited amount of hygroscopic salts, presents little potential for water retention. Only rain events with 2 mm of rainfall or more were shown to generate free water in the top few centimeters for this type of soil (measured by the increased voltage between two elec-trodes 5 mm apart [66]). These events are rare and short-lived, and seemingly linked to el Niño decadal cy-cles [2]. Therefore, it appears that conditions for meta-bolic activity and selection in these hyper-arid soils only occur during infrequent rain events over decades or longer. This would explain the very long residence time of organic carbon in these soils (c.a. 104 yr, [49]), and the long-term preservation of labile organic compounds such as amino acids [67].
Conclusion
Atacama is in stark contrast with other substrates found in the same hyper-arid region, such as calcite, gypsum, and ignimbrite rocks [19-21], and the interior of hygro-scopic salts (halites) that can sustain diverse and metabol-ically active communities by way of salt deliquescence [63,64,68]. Similarly, hygroscopic salts on Mars could have become one of the last refuges for life on the planet, long after soils became uninhabitable [69]. Hence, a rigorous search for life on Mars demands the study of a diversity of substrates, and particularly those that are known to sus-tain life in extremely dry environments on Earth.
Availability of supporting data
The datasets supporting the results of this article are available National Centre for Biotechnology Information Sequence Read Archive under SRA accession number SRA091062, and study accession number SRP026010, BioProject ID PRJNA208226.
Additional file
Additional file 1:Supporting Information.
Abbreviations
AC:Aguas Calientes; AL: Altamira; AND: Andrew Garden; ANOVA: Analysis of variance; BEA: Bea Hill; CH: Chañaral; ICAP spectrometry: Inductively coupled argon plasma spectrometry; KEV: Kevin Garden; OTU: Operational taxonomic unit; PCoA: Principal coordinate analysis; RH: Relative humidity.
Competing interests
The authors declare that they have no competing interests.
Authors’contributions
JDR, AFD, and CPM conceived of the project. JDR and AFD collected the samples. CKR conducted nucleic acid extractions, PCR amplification, and processed the samples for sequencing. WFF supervised sequence data generation. ACC, JDR, BJ, and CKR carried out the sequence and statistical analyses. TB performed the mineralization experiments. TB and ACC performed geochemistry analyses. ACC and JDR wrote the manuscript. All authors read and approved the final manuscript.
Acknowledgements
The authors thank Dominique Seow, Yang Liu, Shabeg Singh, Kim Webb, and Alexandra Gresov for technical assistance, and Octavio Artieda for constructive comments. This work was funded by grant EXOB08-0033 from NASA and grant NSF-0918907 from the National Science foundation to JDR. CPM and AFD acknowledge ASTEP support for fieldwork in the Atacama. Publication of this article was funded in part by the Open Access Promotion Fund of the Johns Hopkins University Libraries.
Author details 1
Biology Department, The Johns Hopkins University, 3400 N. Charles Street, Mudd Hall, Baltimore, MD 21218, USA.2Institute for Genome Sciences,
University of Maryland School of Medicine, Baltimore, MD, USA.3Space Science Division, NASA Ames, Mountain View, CA 94035, USA.4Department
of Applied Mathematics and Statistics, Whiting School of Engineering, The Johns Hopkins University, Baltimore, MD, USA.
Received: 23 August 2013 Accepted: 13 November 2013 Published: 20 November 2013
References
1. Rothschild LJ, Mancinelli RL:Life in extreme environments.Nature2001, 409:1092–1101.
2. McKay CP, Friedmann EI, Gomez-Silva B, Caceres-Villanueva L, Andersen DT, Landheim R:Temperature and moisture conditions for life in the extreme arid region of the Atacama desert: four years of observations including the El Niño of 1997-1998.Astrobiology2003,3:393–406.
3. Hartley AJ, Chong G, Houston J, Mather AE:150 million years of climatic stability: evidence from the Atacama Desert, northern Chile.J Geol Soc 2005,162:421–424.
4. Dunai TJ, Gonzalez Lopez GA, Juez-Larre J:Oligocene-Miocene age of arid-ity in the Atacama Desert revealed by exposure dating of erosion-sensitive landforms.Geology2005,33:321–324.
5. Clarke JDA:Antiquity of aridity in the Chilean Atacama Desert. Geomorphology2006,73:101–114.
6. Houston J, Hartley A:The central Andean west-slope rainshadow and its potential contribution to the origin of hyperaridity in the Atacama Desert.Int J Climatol2003,23:1453–1464.
7. Miller A:The climate of Chile.InClimates of Central and South America, Volume 12.Edited by Schwerdtfeger R. Amsterdam: Elsevier Scientific Publishing Company; 1976.
8. Navarro-Gonzalez R, Rainey FA, Molina P, Bagaley DR, Hollen BJ, de la Rosa J, Small AM, Quinn RC, Grunthaner FJ, Caceres L, Gomez-Silva B, McKay CP: Mars-like soils in the Atacama Desert, Chile, and the dry limit of micro-bial life.Science2003,302:1018–1021.
9. Connon SA, Lester ED, Shafaat HS, Obenhuber DC, Ponce A:Bacterial diversity in hyperarid Atacama Desert soils.J Geophys Res2007,112:G04S17. 10. Ewing SA, Sutter B, Owen J, Nishiizumi K, Sharp W, Cliff SS, Perry K, Dietrich
W, McKay CP, Amundson R:A threshold in soil formation at Earth’s arid– hyperarid transition.Geochim Cosmochim Acta2006,70:5293–5322. 11. Drees KP, Neilson JW, Betancourt JL, Quade J, Henderson DA, Pryor BM,
Maier RM:Bacterial community structure in the hyperarid core of the Atacama Desert, Chile.Appl Environ Microbiol2006,72:7902–7908. 12. Maier RM, Drees KP, Neilson JW, Henderson DA, Quade J, Betancourt JL:
Microbial life in the Atacama Desert.Science2003,302:1018–1021. 13. Lester ED, Satomi M, Ponce A:Microflora of extreme arid Atacama Desert
Soils.Soil Biol Biochem2007,39:704–708.
14. Glavin DP, Cleaves HJ, Schubert M, Aubrey A, Bada JL:New method for estimating bacterial cell abundances in natural samples by use of sublimation.Appl Environ Microbiol2004,70:5923–5928.
15. Okoro CK, Brown R, Jones AL, Andrews BA, Asenjo JA, Goodfellow M, Bull AT:Diversity of culturable actinomycetes in hyper-arid soils of the Atacama Desert, Chile.Antonie Van Leeuwenhoek2009,95:121–133. 16. Neilson JW, Quade J, Ortiz M, Nelson WM, Legatzki A, Tian F, LaComb M,
Betancourt JL, Wing RA, Soderlund CA, Maier RM:Life at the hyperarid margin: novel bacterial diversity in arid soils of the Atacama Desert, Chile.Extremophiles2012,16:553–566.
17. Conley CA, Ishkhanova G, McKay CP, Cullings K:A preliminary survey of non-lichenized fungi cultured from the hyperarid Atacama Desert of Chile.Astrobiology2006,6:521–526.
18. Wierzchos J, Ascaso C, McKay CP:Endolithic cyanobacteria in halite rocks from the hyperarid core of the Atacama Desert.Astrobiology2006,6:415–422. 19. Wierzchos J, Davila AF, Artieda O, Cámara-Gallego B, De Los Ríos A, Nealson
KH, Valea S, García-González MT, Ascaso C:Ignimbrite as a substrate for endolithic life in the hyper-arid Atacama Desert: implications for the search for life on Mars.Icarus2013,224:334–346.
20. Wierzchos J, Camara B, de Los Rios A, Davila AF, Sanchez Almazo IM, Artieda O, Wierzchos K, Gomez-Silva B, McKay C, Ascaso C:Microbial colonization of Ca-sulfate crusts in the hyperarid core of the Atacama Desert: implications for the search for life on Mars.Geobiology2011,9:44–60.
21. Dong H, Rech JA, Jiang H, Sun H, Buck BJ:Endolithic cyanobacteria in soil gypsum: occurrences in Atacama (Chile), Mojave (USA), and Al-Jafr Basin (Jordan) Deserts.J Geophys Res2007,112, G02030.
22. Azúa-Bustos A, González-Silva C, Mancilla RA, Salas L, Gómez-Silva B, McKay CP, Vicuña R:Hypolithic cyanobacteria supported mainly by fog in the coastal range of the Atacama Desert.Microb Ecol2011,61:568–581. 23. Warren-Rhodes KA, Rhodes KL, Pointing SB, Ewing SA, Lacap DC,
Gomez-Silva B, Amundson R, Friedmann EI, McKay CP:Hypolithic cyanobac-teria, dry limit of photosynthesis, and microbial ecology in the hyperarid Atacama Desert.Microb Ecol2006,52:389–398.
24. Wierzchos J, De Los Ríos A, Ascaso C:Microorganisms in desert rocks: the edge of life on Earth.Inter Microbiol2012,15:173–183.
26. DiCastri F, Hajek E:Bioclimatología de Chile.Santiago: Universidad Católica de Chile; 1976:128.
27. Christensen H, Hansen M, Sorensen J:Counting and size classification of active soil bacteria by fluorescence in situ hybridization with an rRNA oligonucleotide probe.App Environ Microbiol1999,65:1753–1761. 28. Caporaso JG, Kuczynski J, Stombaugh J, Bittinger K, Bushman FD, Costello
EK, Fierer N, Pena AG, Goodrich JK, Gordon JI, Huttley GA, Kelley ST, Knights D, Koenig JE, Ley RE, Lozupone CA, McDonald D, Muegge BD, Pirrung M, Reeder J, Sevinsky JR, Turnbaugh PJ, Walters WA, Widmann J, Yatsunenko T, Zaneveld J, Knight R:QIIME allows analysis of high-throughput commu-nity sequencing data.Nat Methods2010,7:335–336.
29. Edgar RC:Search and clustering orders of magnitude faster than BLAST. Bioinformatics2010,26:2460–2461.
30. Edgar RC, Haas BJ, Clemente JC, Quince C, Knight R:UCHIME improves sensitivity and speed of chimera detection.Bioinformatics2011,27:2194–2200. 31. Wang Q, Garrity GM, Tiedje JM, Cole JR:Naïve Bayesian classifier for rapid
assignment of rRNA sequences into the new bacterial taxonomy. App Environ Microbiol2007,73:5261–5267.
32. McDonald D, Price MN, Goodrich JK, Nawrocki EP, DeSantis TZ, Probst A, Andersen GL, Knight R, Hugenholtz P:An improved Greengenes taxonomy with explicit ranks for ecological and evolutionary analyses of bacteria and archaea.ISME J2012,6:610–618.
33. Caporaso JG, Bittinger K, Bushman FD, DeSantis TZ, Andersen GL, Knight R: PyNAST: a flexible tool for aligning sequences to a template alignment. Bioinformatics2010,26:266–267.
34. DeSantis TZ, Hugenholtz P, Larsen N, Rojas M, Brodie EL, Keller K, Huber T, Dalevi D, Hu P, Andersen GL:Greengenes, a chimera-checked 16S rRNA gene database and workbench compatible with ARB.Appl Environ Microbiol2006,72:5069–5072.
35. Price MN, Dehal PS, Arkin AP:FastTree 2-approximately maximum-likelihood trees for large alignments.PLoS One2010,5:e9490. 36. Hamady M, Lozupone C, Knight R:Fast UniFrac: facilitating
high-throughput phylogenetic analyses of microbial communities including analysis of pyrosequencing and PhyloChip data.Isme J2010,4:17–27. 37. Lozupone C, Hamady M, Knight R:UniFrac-an online tool for comparing
microbial community diversity in a phylogenetic context. BMC Bioinformatics2006,7:371.
38. R: A language and environment for statistical computing. [http://www.R-project.org]
39. Kruskal WH, Wallis WA:Use of ranks in one-criterion variance analysis. J Am Stat Assoc1952,46:583–621.
40. Steven B, Niederberger TD, Bottos EM, Dyen MR, Whyte LG:Development of a sensitive radiorespiration method for detecting microbial activity at subzero temperatures.J Microbiol Methods2007,71:275–280.
41. Lane DJ:16S/23S rRNA sequencing.InNucleic acid techniques in bacterial systematics.Edited by Stackebrandt E, Goodfellow M. New York: John Wiley and Sons; 1991:115.
42. White JR, Nagarajan N, Pop M:Statistical methods for detecting differentially abundant features in clinical metagenomic samples. PLoS Comput Biol2009,5:e1000352.
43. Suzuki KI, Whitman WB:Class Thermoleophilia.InClass Thermoleophilia, Class Thermoleophilia.Edited by Goodfellow M, Kämpfer P, Busse HJ, Trujillo ME, Suzuki K, Ludwig W, Whitman WB. New York: Springer; 2012:2010. 44. Rech JA, Quade J, Hart WS:Isotopic evidence for the source of Ca and S
in soil gypsum, anhydrite and calcite in the Atacama.Geochim Cosmochim Acta2003,67:575–586.
45. Campbell IB, Claridge GGC:Salts in Antarctic Soils, Antarctica: Soils, weathering processes and environment development in soil science, Volume 16. New York: Elsevier; 1987:239.
46. Lee CK, Barbier BA, Bottos EM, McDonald IR, Cary SC:The inter-valley soil comparative survey: the ecology of Dry Valley edaphic microbial com-munities.ISME J2012,6:1046–1057.
47. Lamsal K, Paudyal G:Model for assessing impact of salinity on soil water availability and crop yield.Agric Water Manage1999,41:57–70. 48. Dixon JC, McLaren SJ:Duricrust.InGeomorphology of desert environments.
2nd edition. Edited by Parsons AJ, Abrahams AD. Berlin: Springer; 2009. 49. Ewing SA, Yang W, DePaolo DJ, Michalski G, Kendall C, Stewart BW,
Thiemens M, Amundson R:Non-biological fractionation of stable Ca isotopes in soils of the Atacama Desert, Chile.Geochim Cosmochim Acta 2008,72:1096–1110.
50. Fierer N, Strickland MS, Liptzin D, Bradford MA, Cleveland CC:Global patterns in belowground communities.Ecol Lett2009,12:1238–1249. 51. Reddy GS, Garcia-Pichel F:Description of Patulibacter americanus sp. nov.,
isolated from biological soil crusts, emended description of the genus Patu-libacter Takahashi et al. 2006 and proposal of Solirubrobacterales ord. nov. and Thermoleophilales ord. nov.Int J Syst Evol Microbiol2009,59:87–94. 52. Lacap DC, Warren-Rhodes KA, McKay CP, Pointing SB:Cyanobacteria and
chloroflexi-dominated hypolithic colonization of quartz at the hyper-arid core of the Atacama Desert, Chile.Extremophiles2011,15:31–38. 53. Costello EK, Halloy SR, Reed SC, Sowell P, Schmidt SK:Fumarole-supported
islands of biodiversity within a hyperarid, high-elevation landscape on Socompa Volcano, Puna de Atacama, Andes.Appl Environ Microbiol2009, 75:735–747.
54. Lynch RC, King AJ, Farías ME, Sowell P, Vitry C, Schmidt SK:The potential for microbial life in the highest-elevation (>6000 m.a.s.l.) mineral soils of the Atacama region.J Geophys Res2012,117, G02028.
55. Pointing SB, Chan Y, Lacap DC, Lau MC, Jurgens JA, Farrell RL:Highly specialized microbial diversity in hyper-arid polar desert.Proc Natl Acad Sci USA2009,106:19964–19969.
56. Karl DM, Bird DF, Bjorkman K, Houlihan T, Shackelford R, Tupas L: Microorganisms in the accreted ice of Lake Vostok, Antarctica. Science1999,286:2144–2147.
57. Quinn RC, Ehrenfreund P, Grunthaner FJ, Taylor CL, Zent AP:
Decomposition of aqueous organic compounds in the Atacama Desert and in Martian soils.J Geophys Res2007,112:G04S18.
58. Sugden DE, Marchant DR, Potter N, Souchez RA, Denton GH, Swisher CC, Tison JL:Preservation of Miocene glacier in East Antarctica.Let Nature 1995,376:412–414.
59. Rivkina EM, Friedmann EI, McKay CP, Gilichinsky DA:Metabolic activity of permafrost bacteria below the freezing point.Appl Environ Microbiol2000, 66:3230–3233.
60. Steven B, Pollard WH, Greer CW, Whyte LG:Microbial diversity and activity through a permafrost/ground ice core profile from the Canadian high Arctic.Environ Microbiol2008,10:3388–33403.
61. Wilhelm RC, Radtke K, Mykytczuk NC, Greer CW, Whyte LG:Life at the wedge: the activity and diversity of arctic ice wedge microbial communities.Astrobiology2012,12:347–360.
62. Valdivia-Silva JE, Navarro-González R, Fletcher L, Perez-Montaño S, Condori-Apaza R, McKay CP:Soil carbon distribution and site characteristics in hyper-arid soils of the Atacama Desert: a site with Mars-like soils. Adv Space Res2012,50:108–122.
63. Davila AF, Gomez-Silva B, De Los Rios A, Ascaso C, Olivares H, McKay CP, Wierzchos J:Facilitation of endolithic microbial survival in the hyperarid core of the Atacama Desert by mineral deliquescence.J Geophys Res 2008,113:G01028.
64. Wierzchos J, Davila AD, Sánchez-Almazo IM, Hajnos M, Swieboda R, Ascaso C:Novel water source for endolithic life in the hyperarid core of the Atacama Desert.Biogeosciences2012,9:3071–3098.
65. Parro V, de Diego-Castilla G, Moreno-Paz M, Blanco Y, Cruz-Gil P, Rodriguez-Manfredi JA, Fernandez-Remolar D, Gomez F, Gomez MJ, Rivas LA, Demergasso C, Echeverria A, Urtuvia VN, Ruiz-Bermejo M, Garcia-Villadangos M, Postigo M, Sanchez-Roman M, Chong-Diaz G, Gomez-Elvira J:A microbial oasis in the hy-persaline Atacama subsurface discovered by a life detector chip: implica-tions for the search for life on Mars.Astrobiology2011,11:969–996. 66. Davis WL, de Pater I, McKay CP:Rain infiltration and crust formation in the
extreme arid zone of the Atacama Desert, Chile.Planet Space Sci2010, 58:616–622.
67. Skelley AM, Aubrey AD, Willis PA, Amashukeli X, Ehrenfreund P, Bada JL, Grunthaner FJ, Mathies RA:Organic amine biomarker detection in the Yungay region of the Atacama Desert with the Urey instrument. J Geophys Res2007,112:G04S11.
68. Davila AF, Hawes I, Ascaso C, Wierzchos J:Salt deliquescence drives photosynthesis in the hyperarid Atacama Desert.Environ Microbial2013, 5:583–587.
69. Davila AF, Duport LG, Melchiorri R, Jänchen J, Alea S, De Los Rios A, Fairén AG, Möhlmann D, McKay CP, Ascaso C, Wierzchos J:Hygroscopic minerals and the potential for life on Mars.Astrobiology2010,10:617–628.
doi:10.1186/2049-2618-1-28