application in the context of GRADE
Abstract
The objective of this paper is to explain how to apply, interpret, and present the results of a new
instrument to assess the risk of bias (RoB) in non-randomized studies (NRS) dealing with effects
of environmental exposures on health outcomes. This instrument is modelled on the Risk Of Bias
In Non-randomised Studies of Interventions (ROBINS-I) instrument. The RoB instrument for
NRS of exposures assesses RoB along a standardized comparison to a randomized target
experiment, instead of the study-design directed RoB approach. We provide specific guidance
for the integral steps of developing a research question and target experiment, distinguishing
issues of indirectness from RoB, making individual-study judgments, and performing and
interpreting sensitivity analyses for RoB judgments across a body of evidence. Also, we present
an approach for integrating the RoB assessments within the Grading of Recommendations
Assessment, Development, and Evaluation (GRADE) framework to assess the certainty of the
evidence in the systematic review. Finally, we guide the reader through an overall assessment to
support the rating of all domains that determine the certainty of a body of evidence using the
1 Title: A Risk of Bias instrument for Non-randomized Studies of Exposures: a users’ guide to its
application in the context of GRADE
Author list
Rebecca L. Morgan a; Kristina A. Thayer b; Nancy Santesso a; Alison C. Holloway c; Robyn Blain d;
Sorina E. Eftim d;Alexandra E. Goldstone d; Pam Ross d; Mohammed Ansari e; Elie Akl a, f; Tommaso
Filippini g; Anna Hansell h, i, j; Joerg J. Meerpohl k; Reem A. Mustafa a, l; Jos Verbeek m; Marco Vinceti g,
n; Paul Whaley o; Holger J. Schünemann a, p, GRADE Working Group
a Department of Health Research Methods, Evidence, and Impact, McMaster University, Health
Sciences Centre, Room 2C14, 1280 Main Street West, Hamilton, ON L8S 4K1 Canada
[email protected], [email protected], [email protected], [email protected]
b Integrated Risk Information System (IRIS) Division, National Center for Environmental Assessment
(NCEA), Office of Research and Development, US Environmental Protection Agency, Building B
(Room 211i), Research Triangle Park, NC USA 27711. [email protected]
c Department of Obstetrics and Gynecology, McMaster University, Health Sciences Centre, Room
3N52A, 1280 Main Street West, Hamilton, ON L8S 4K1 Canada. [email protected]
d ICF International Inc., 9300 Lee Highway, Fairfax, VA, USA. [email protected],
2 e School of Epidemiology and Public Health, Faculty of Medicine, University of Ottawa, ON K1H 8M5
Canada. [email protected]
f Department of Internal Medicine, Faculty of Health Sciences, American University of Beirut, P.O.
Box: 11-0236, Riad-El-Solh Beirut 1107 2020 Lebanon. [email protected]
g Department of Biomedical, Metabolic and Neural Sciences, University of Modena and Reggio Emilia,
Italy. [email protected], [email protected]
h MRC-PHE Centre for Environment and Health, Imperial College London, St Mary’s Campus, Praed
St, Paddington London W2 1PG, UK. [email protected]
i Public Health Directorate, Imperial College Healthcare NHS Trust, St Mary’s Hospital, Paddington,
London W2 1PG, UK. [email protected]
j Centre for Environmental Health and Sustainability, University of Leicester, George Davies Building,
University Road, Leicester, LE1 7RH, UK. [email protected]
k Institute for Evidence in Medicine (for Cochrane Germany Foundation), Medical Center - University of
Freiburg, Breisacher Strasse 153, 79110 Freiburg, Germany. [email protected]
l Division of Nephrology and Hypertension, Department of Medicine, University of Kansas Medical
Center, 3901 Rainbow Boulevard, Kansas City, KS 66160, USA. [email protected]
m Finnish Institute of Occupational Health, Cochrane Work, Neulaniementie 4, 70701 Kuopio, Finland.
3 n Department of Epidemiology, Boston University School of Public Health, Boston, Massachusetts,
USA. [email protected]
o Lancaster Environment Centre, Lancaster University, Lancaster LA1 4YQ, UK.
p Department of Medicine, McMaster University, Health Sciences Centre, Room 2C14, 1280 Main
Street West, Hamilton, ON L8S 4K1 Canada; [email protected]
Corresponding author: Holger J. Schünemann. Department of Health Research Methods, Evidence
and Impact, Health Sciences Centre, Room 2C14, 1280 Main Street West, Hamilton, ON L8S 4K1
Canada; [email protected]
Conflict of interest
The authors declare they have no competing financial interests with respect to this manuscript, or its
content, or subject matter.
The views expressed are those of the authors and do not necessarily represent the views or policies of
the U.S. Environmental Protection Agency.
4
Abstract
The objective of this paper is to explain how to apply, interpret, and present the results of a new
instrument to assess the risk of bias (RoB) in non-randomized studies (NRS) dealing with effects of
environmental exposures on health outcomes. This instrument is modelled on the Risk Of Bias In
Non-randomised Studies of Interventions (ROBINS-I) instrument. The RoB instrument for NRS of exposures
assesses RoB along a standardized comparison to a randomized target experiment, instead of the
study-design directed RoB approach. We provide specific guidance for the integral steps of developing a
research question and target experiment, distinguishing issues of indirectness from RoB, making
individual-study judgments, and performing and interpreting sensitivity analyses for RoB judgments
across a body of evidence. Also, we present an approach for integrating the RoB assessments within the
Grading of Recommendations Assessment, Development, and Evaluation (GRADE) framework to
assess the certainty of the evidence in the systematic review. Finally, we guide the reader through an
overall assessment to support the rating of all domains that determine the certainty of a body of evidence
using the GRADE approach.
Keywords (6): Risk of bias; environmental health; GRADE; non-randomized studies; study limitations; ROBINS
5
1. Introduction
The evidence on the impact of environmental or occupational exposures on human health outcomes
typically comes from non-randomized studies (NRS). Objective and transparent evaluation of evidence
of exposures requires the use of systematic reviews [1]. A highly credible systematic review should
include a standardized, rigorous, and transparent assessment of the risk of bias (RoB) in each included
study and across the body of evidence [2, 3]. This is applicable when referring to studies evaluating the
impact of an environmental, occupational or other type of exposure.
A recent study evaluated five RoB methods used in environmental health hazard assessments [4]. While
all five methods considered similar issues (or domains) in RoB assessment, their relative emphasis on
these issues varied. The study suggested a need for the harmonization and improvement of these
methods. We developed the RoB instrument for NRS of exposures based on the feedback from
developers of existing instruments and methods to address limitations such as outlining the ideal study,
labelling of study designs, and the use of signaling questions [4, 5]. The objective of this paper is to
explain how to apply, interpret, and present the results of a new instrument to assess the RoB in NRS
dealing with effects of environmental exposures on health outcomes.
2. Overview of the instrument
The RoB instrument for NRS of exposures is modeled after the Risk Of Bias In Non-randomised Studies
of interventions (ROBINS-I) instrument [6]. In 1965, Cochran proposed evaluating NRS using the
criteria for RCTs [7]. Hernan et al. recently suggested that causal inference from NRS represents an
attempt to emulate the ideal randomized trial (the target trial) that would answer the question of interest
[8]. In fact, ROBINS-I uses a hypothetical ideal target trial that would be free of bias as a reference
6 point. By using the target trial as the reference point, ROBINS-I moves away from a study-design
directed approach. That is, the specific design of the NRS, e.g. a case-control design, does not a priori
determine absence or presence of RoB [9]. RoB instrument for NRS of exposures emulates these
features of ROBINS-I.
In brief, the application of the RoB instrument for NRS of exposures consists of three steps:
1. Step I: presents the review question, potential confounders, co-interventions, and exposure and
outcome measurement accuracy information;
2. Step II: describes each eligible study as a hypothetical target experiment, including specific
confounders and co-interventions from that study that will require consideration; and
3. Step III: assesses RoB across seven items about the strengths and limitations of studies of
environmental exposure.
The seven RoB items are: 1) Bias due to confounding, 2) Bias in selection of participants into the study,
3) Bias in classification of exposures, 4) Bias due to departures from intended exposures, 5) Bias due to
missing data, 6) Bias in measurement of outcomes, and 7) Bias in selection of reported results.
Judgments for each RoB item can be: ‘Low RoB’, ‘Moderate RoB’, ‘Serious RoB’, or ‘Critical RoB’.
Similarly, an overall judgment about the bias at the study level is either ‘Low RoB’, ‘Moderate RoB’,
‘Serious RoB’, or ‘Critical RoB’. In order to reach a judgment for each RoB item, the rater first answers
one or more signalling questions with ‘Yes’, ‘Probably yes’, ‘Probably no’, ‘or No’. The answer should
be based on the information available in the publications/reports of the individual study and be justified
in an accompanying free-text field.
7 Previously published guidance for the ROBINS-I instrument proposes that the study-level RoB should
be the most concerning level among the RoB items for that study, unless raters determine the study-level
RoB to be more severe because of compounded risks of more than one individual RoB item [6].
Identifying RoB per item and across items per study allows systematic-review authors to explore the
possible influence of studies at less compared to more severe RoB on the pooled estimates of effect [10].
As in the Grading of Recommendations Assessment, Development and Evaluation (GRADE) approach
for the body of evidence, risk of bias is assessed by outcome in a study and study RoB could vary by
outcome (e.g. subjective outcomes may have different levels of bias than objective outcomes) or group
of outcomes, if pragmatic rationale supports the grouping of outcomes.
Systematic-review authors can then use the RoB instrument as part of the assessment of the certainty of
the body of evidence using the GRADE framework. Within the GRADE framework, RoB is one domain
for assessing the certainty of evidence (CoE), the others being inconsistency, indirectness, imprecision,
publication bias, magnitude of effect, dose-response gradient, and plausible opposing residual
confounding [2]. As per the current GRADE guidance, evidence from NRS, appraised using existing
design-specific RoB instruments, starts with a default initial certainty of “Low” due to concerns of
confounding and selection bias when randomization is lacking. Raters then downgrade or upgrade the
body of evidence according to specific GRADE domain assessments, including a more detailed
evaluation for RoB other than confounding. However, since the RoB instrument for NRS of exposures
takes into account lack of randomization, evidence will not be automatically rated down because
judgments of risk of bias would have been made with reference to a hypothetical target experiment
(ideal target trial). Bodies of evidence of any study design will undergo the same RoB evaluation
without specific reference to the study design. In the context of using ROBINS-like instruments, all
8 studies within the bodies of evidence will start at the same ‘High’ initial certainty within GRADE
regardless of study design. However, in general, NRS, due to potential for confounding and selection
bias when compared with RCTs will receive a rating of low or very low depending on the degree of
RoB. Raters must justify not rating down only in the presence of specific study design and execution or
result features [9].
When conducting a systematic review, results from the study-level RoB instrument for NRS of health
effects of exposures inform judgments about overall RoB for the body of evidence across studies. So far,
no guidance on the use of the RoB instrument for NRS of effects of exposures for this purpose exists.
This article provides guidance for the application of the RoB instrument for NRS of exposures at the
study level and as part of a RoB judgment within the GRADE framework to determine the certainty
across a body of evidence [5]. Although the RoB instrument for NRS of exposures is still being refined
in consultation with a diverse group of subject matter experts, we highlight a number of important
procedural questions. Thus, describing our experience in implementing the RoB instrument for NRS of
effects of exposures will facilitate future testing and clarification of the use of the instrument by
systematic review authors and guideline developers.
3. Approach when conducting systematic reviews for studies of exposure
We previously described the development of the RoB instrument for NRS of exposures [5]. In addition
to this effort, we have solicited broader input on this instrument at workshops held at GRADE Working
Group meetings in March 2015, October 2015, and April 2016; during a meeting to develop ROBINS of
Exposures (ROBINS-E; an instrument based on the RoB instrument for NRS of exposures and
ROBINS-I) in January 2017; and at the Global Evidence Summit in September 2017. Findings from
9 these workshops, through this iterative process, have led to further refinement and pilot-testing of the
RoB instrument for NRS of exposures.
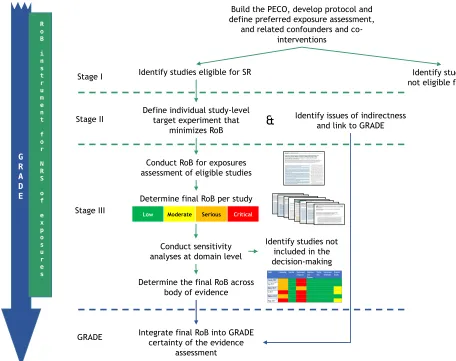
Figure 1 presents a schematic of how the RoB instrument for NRS of exposures fits into the systematic
review process. It illustrates steps for evaluating the RoB of individual studies in a systematic review
and integrating the results across a body of evidence into the GRADE evidence-assessment framework.
For each outcome in the review, authors of systematic reviews would go through Steps II and III, and
GRADE.
3.1. Complete Step I of the RoB instrument for NRS of exposures
3.1.1. Define the research question
This process begins with the definition of the research question. For questions about exposures (i.e.
unintentional interventions), namely the environmental and occupational type, the research question is
formatted as a PECO (population, exposure, comparator(s), and outcomes) question [5, 11]. For
example, we may ask the following research question “In production workers exposed to steady state
noise for ten years (population), what is the effect of exposure to a noise level of 80 dB(A) measured as
LAeq,8h or greater (exposure) compared to less than 80 dB(A) also measured as LAeq,8h (comparison)
in the same population on hearing level?” To understand the relation between noise and hearing loss, we
may also ask the following PECO: “In production workers exposed to steady state noise louder than 80
dB(A) during ten years measured as L Aeq,8h, what is the effect of an increase of 5 dB(A) on hearing
level compared to the level from where the increase started, over the whole range of exposure, assuming
an exponential relationship between exposure and hearing level?”
10 Since the RoB instrument for NRS of exposures is set up as a comparison between groups that can be
exposed or not, or exposed to different levels, it is necessary to clearly identify what is the exposure
level of interest and what is the comparison. In some situations, little or nothing may be known about the
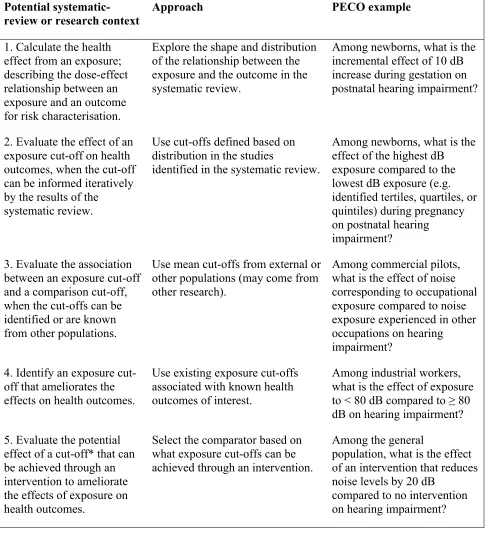
relationship between an exposure and outcome to inform the PECO. There are at least five approaches to
facilitate formulating and defining the levels of exposure within the PECO (Table 1) [12]. Researchers
should be transparent about which of these approaches they are using for definition of their PECO and
ensure that the exposure and comparator(s) are explicitly defined.
3.1.2. Identify confounders, co-interventions, and measures of exposures and outcomes
In Step I, systematic-review authors list confounders and co-interventions that are associated with both
the exposure and outcome. In addition, review authors assess the accuracy of the exposure and outcome
measurements. These sections must be populated by knowledgeable members of the review team. While
working through these sections, raters respond to signaling questions in the confounding, participant
selection, and exposure measurement RoB items. Consideration of these issues may lead to the
identification of different sources of indirectness [5]. For example, the review team may identify obesity
as one of their important outcomes; however, studies may measure waist circumference (and measure it
accurately within the study) to inform the outcome of obesity. The review team may label waist
circumference as an indirect measure of obesity.
We present the text used in the review-level protocol for an example on bisphenol A (BPA), comparing
the highest exposure stratum and lowest exposure stratum of BPA in each eligible study (Appendix A).
The PECO being: “What is the effect of highest levels compared with lowest levels of BPA exposure on
body weight?” We reviewed published literature, as well as consulted with topic-specific experts, to
11 determine the final set of responses to the Step I fields. For some exposures, a public database of
confounders for measures of environmental exposures and health outcomes (i.e., PhenX Toolkit;
https://www.phenxtoolkit.org/) may provide additional information.
3.2. Complete Step II of the RoB instrument for NRS of exposures for eligible studies
3.2.1. Construct the target experiment
At this point, the studies that meet the eligibility criteria of the review should have been identified. The
reviewers should complete separate forms for each relevant outcome (group) within each study. At the
start of Step II, reviewers construct a study-specific target experiment informed by the PECO question,
the exposure and comparator exposure thresholds, outcome specific confounders, and health outcome
measurements. As explained in previous GRADE guidance for the use of ROBINS-I, the target
experiment provides a structured comparison with a reference experiment that is considered to be at low
RoB [9]. The target experiment need not be realistic, as it should reflect a study design that reduces
known and unknown imbalance in prognostic factors and confounding [5]. It then allows RoB
assessment of individual studies and across studies at a later stage against the lowest possible bias that
research could yield for the question at hand. Also, in Step II, the reviewer records how the individual
studies measured the exposure and health outcome. The information recorded in Step II informs the RoB
judgments made in Step III.
For example, let’s consider our review on BPA and weight. The PECO of the review is comparing the
highest to the lowest level of BPA exposure. In Step II, we determine the target experiment for the
included study (Appendix B). Based on the quantities identified in the study by Carwile & Michels [13],
the target hypothetical experiment would be framed as an experiment in which the general adult
population is randomly allocated to a high level of BPA exposure ( ≥ 4.7 ng/mL) or a low level of BPA
12 exposure (≤ 1.1 ng/mL) and body weight measured. In this situation, we compared two exposure
cut-offs to determine the effect on obesity.
Confounders must be explored in each eligible study, as studies and outcomes may be affected by
different confounders. For example, the review question may be about the general population, but the
study includes only industrial workers, which may introduce additional confounders, such as exposure to
other chemicals. Note that it may have impact on judging indirectness or selection bias, too. Also, in
Step II, the reviewer makes a judgment of the potential magnitude and direction of the impact of the
confounding factor on the effect estimate. For example, when examining the effect of BPA on body
weight, consumption of processed foods is considered a confounder as it both increases the participants’
exposure to BPA through food packaging and increases overall caloric intake [14]. We present the
completed Step II sections for two studies from our BPA and obesity example: Carwile & Michels, 2011
and Harley et al., 2013 (Appendices B & C) [13, 15].
3.2.2. Identifying sources of indirectness to integrate within GRADE and their relation to risk of bias
While establishing the target experiment in Step II, individuals may identify studies that present
evidence different from the PECO question (i.e., a restricted version of any concept such as only part of
the population of interest or a section of the range of interest for high exposure) [16]. For example,
consider again the review of hearing loss due to noise exposure. Studies with only shift workers may be
considered indirect evidence for effects in the general population. Studies reporting on waist
circumference may be considered indirect evidence for the measure of the outcome of obesity. Sources
of indirectness may also come from studies that do not have a direct comparison (and therefore results
would be compared to results from an external control or comparator group) or when using surrogate
13 measures. While the review team may decide to include this study in the review, when evaluating the
evidence within GRADE, differentiation between the domain of risk of bias and indirectness may be
rather nuanced. Consider the following: the target experiment serves as the anchor point. If the study at
hand tries to emulate the exposure specified in the target experiment but does not achieve what it sets
out to do, it is subject to bias. If it acknowledges difficulty in mimicking and defines a proxy
experiment, which the study appropriately implements, then it could be considered indirectness in
relation to the question of interest.
Subsequent considerations for RoB when using indirect evidence in a review require critical evaluation
to identify potential for misclassification of the exposure. While it is important to recognize the potential
for more serious bias in classification of exposures when using an indirect comparison, there are
situations in which they may present less risk because of clearly delineated exposure and comparison
groups (e.g. there is little to no concern that the exposure groups are overlapping)..
Similarly, studies identified for the review may use exposure measures that are indirect to those
identified in the PECO, i.e., proxy or intermediate markers of measures. Within the BPA example, , the
measurement of exposure level based on a participant’s job title (e.g. cashier) would be indirect [17].
Extrapolating BPA exposure levels based on a participant’s job title may also introduce a risk to bias
based on specific prognostic factors or the ability to differentiate between the levels of exposure.
3.3. Complete Step III of the RoB instrument for NRS of exposures assessment for eligible studies
Raters evaluate eligible studies and determine RoB by responding to signaling questions for each of the
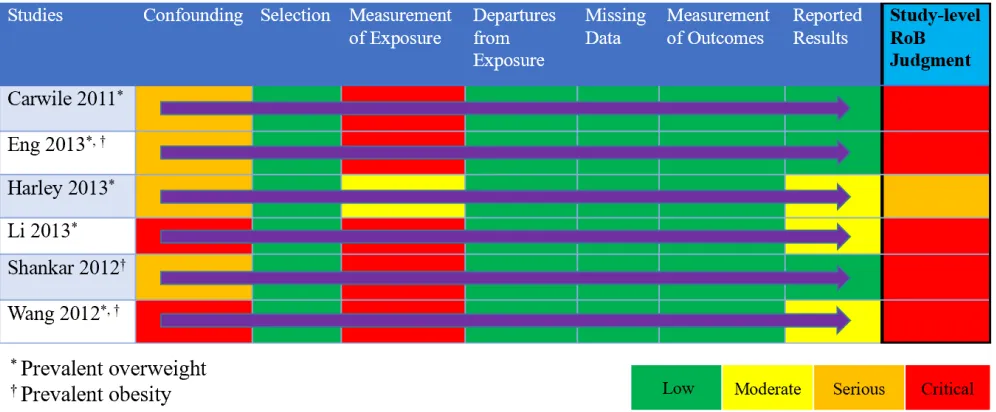
seven RoB items listed previously. Appendices D & E present summaries from two studies addressing
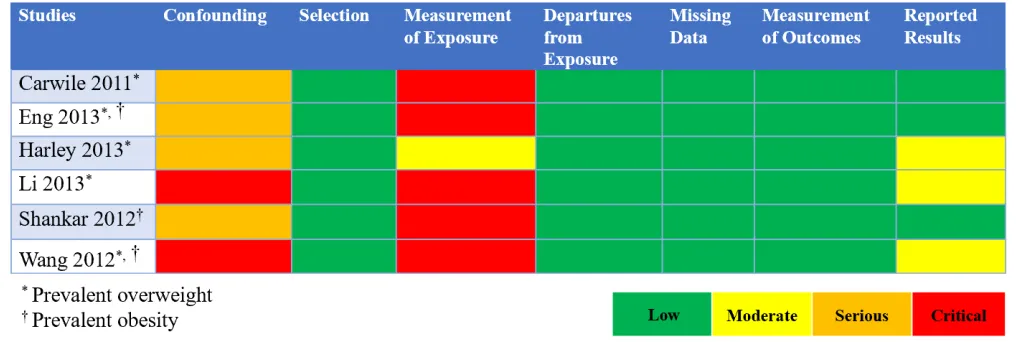
BPA and body weight (as measured by prevalent overweight and prevalent obesity). We present
14 judgments across assessments of the RoB instrument items for NRS of exposures in a RoB matrix for all
eligible studies in Table 2.
Due to the lack of randomization and allocation concealment, studies will typically be judged as
‘Serious’ RoB within the item of bias due to confounding and, also, may be judged as ‘Serious’ due to
selection of participants. While RoB items 4-to-7 are similar to those used to evaluate RCTs [6, 18], bias
due to confounding, selection of participants, and classification of the exposure present considerations
unique to studies of exposures [5]. Below, we highlight some of these nuances and how raters can
address them in their item- and study-level RoB judgments.
Bias due to Confounding
Three situations require particular attention when evaluating bias due to confounding for exposures: 1)
the evaluation of cross-sectional studies; 2) considerations of large effects; and 3) opposing residual
plausible confounding.
Cross-sectional studies can impact the judgment on the item-level RoB due to confounding (e.g.
time-varying confounding). This is because we might be unable to evaluate time-time-varying confounding and it
makes the measurement of the effect of known confounders more challenging. We present two examples
from the BPA and body weight review. While Carwile & Michels adjusted for all critical confounders,
the measurement of exposure and outcome at one time point lowers our certainty that temporal
confounders (e.g. dietary preference for canned food) are not responsible for any observed long-term
association (Appendix D) [13]. In this specific study, the data collection point is part of the National
Health and Nutrition Examination Survey (NHANES), a nationally-representative dataset with years of
prior data collection, therefore providing supplemental information about the adjustment of confounders.
15 In contrast, within that review, neither Li nor Wang provide that same level of information about the
data collection, therefore presenting “Critical” bias due to confounding (Table 1) [19, 20].
Studies judged as biased due to confounding with evidence of a large effect or opposing residual
confounding (i.e. when residual confounders would result in the underestimating of an apparent
exposure effect) may not require severe RoB item-level judgment [21]. This is due to the magnitude of
the effect outweighing the size of the bias that might exist in the study or that all plausible biases go in a
direction that would have reduced the observed effect or increased the observed lack of effect. These
latter two domains contribute to increasing the CoE in a body of evidence of NRS in GRADE; however,
within the RoB instrument for NRS of exposures they may also influence the study-level judgments
[21]. To demonstrate this situation, we present an example on smoking and lung cancer-related mortality
[22, 23]. A prospective cohort study compared lung cancer-related mortality rates among smokers and
non-smokers [23]. Although there are some concerns due to residual and unmeasured confounders, such
as occupational or air pollution exposures, the large magnitude of effect (30 times greater mortality rate
due to lung cancer among persons smoking 25 or more cigarettes vs. non-smokers) warrants a less
severe RoB item-level judgment of ‘Low’ or ‘Moderate’, instead of ‘Serious’ for the RoB item of
confounding [23]. In this example, the large magnitude of effect reduces our concern that bias alone
creates a spurious effect [24].
In addition, exploratory research conducted has suggested there is no relation between the 10 most
common occupational exposures (i.e., sulfur dioxide, welding fumes, engine emissions, gasoline,
lubricating oil, solvents, paints/varnishes, adhesives, excavation dust, and wood dust) and smoking
history [25]. This exploration into the relationship between exposures and the outcome of interest
16 reduces our concern for potential residual plausible confounding due to other occupational or air
pollution exposures even more.
Bias due to Misclassification of Exposure
In NRS of exposure, there is a particular concern with distinguishing between the exposed and reference
groups, as measuring exposure is difficult and the reference groups are often assumed to be
non-exposed. Bias relating to exposure assessment is a major source of systematic error in studies of
environmental exposures [26]. This is dealt with explicitly in a separate paper [27]. It is crucial to
identify the source and type of exposure misclassification. If non-differential, the exposure
misclassification will usually bias associations to the null, although the final impact on the observed
relative risk is also dependent on other factors [28].
Systematic reviewers may be faced with different approaches to exposure assessment. In the example of
noise exposure, this may be assessed by (in order of most severe to least severe exposure
misclassification bias) [29]:
Self-report questionnaire: Do you have to raise your voice to carry out a normal conversation
with a colleague when approximately two metres apart for at least part of the working day (may
indicate noise levels >80dB);
Modelling: in the occupational setting, a job-exposure matrix would be an example, whereby an
occupational hygienist classifies likely exposure ranges based on job title;
Environmental monitoring: using a noise monitor to measure noise in the workplace
environment will give a continuous measurement but sensor measurement error likely to be
optimised for certain exposure ranges;
17 Personal monitoring: using a personal noise monitor to measure exposure but sensor
measurement error likely to be optimised for certain exposure ranges;
Individual dose: personal monitoring, additionally taking account of use of ear defenders,
hearing acuity, etc.
In our example of BPA and body weight, the review team and topic-specific experts note the accuracy of
the measurement of exposure requires multiple measurements (cited here from five-to-13 repeated
measurements) at different time points, due to the non-persistent nature of BPA in the body [30]. If an
individual study uses fewer than the recommended number of samples, or since diagnostic accuracy of
BPA with the collection of between five and 13 samples only yields ≥ 0.80 sensitivity and specificity
depending on level of exposure (small, moderate, high), there are concerns for non-differential
misclassification (i.e. random error) potentially conflating participants in the exposure and comparator
groups, likely leading to little difference in the outcomes (i.e. bias toward the null). When the exposure
is non-persistent, we have more confidence when studies use multiple timepoints to measure the
exposure level. The number of collected samples increases our certainty in the correct classification of
the higher exposed and lower exposed groups. In this situation we may consider the exposure domain
for Harley to be of less potential risk of bias for misclassification of the exposure. Although repeated
measures in urine is acceptable, there is still some scientific uncertainty about the most direct measure of
BPA exposure (i.e. urine vs blood)[31, 32]. In Carwile & Michels, participants provided only one
sample; therefore we may have critical concerns about bias due to misclassification of the exposure
(Appendix D) [13].
18 The single sampling method used in Carwile & Michels decreases our certainty that the higher exposed
and lower exposed participants can be accurately distinguished. Returning to Figure 1, in their protocol,
review authors could have specified to exclude such studies a priori or identified this risk of bias item as
a reason to conduct a sensitivity analysis (see below).
3.4. RoB judgments for an individual study for an outcome
According to ROBINS-I guidance, raters should assign the study-level RoB according to the most
severe of the RoB item-level judgments unless they determine the study to have more severe RoB based
on a combination of RoB judgments across items [6]. We demonstrate this in our example of BPA and
weight in Table 3. This approach relies on individuals critically evaluating the rationale and direction of
the bias. For example, if more than one RoB item within a study were rated as serious RoB but no RoB
items were of critical RoB, then the study-level RoB could either be serious or could be critical if the
consideration of all serious ratings leads to greater concern than would be expressed by a rating of
serious on the study level.
3.5. Sensitivity analyses and overall RoB across studies
Sensitivity analyses allow for exploration across a body of evidence to determine whether the pooled
results are robust with including, versus excluding, studies with certain RoB [33]. The variability in RoB
judgments across individual studies may inform whether a selection of studies, rather than the whole
body of evidence, best informs the research question. The approach to conducting sensitivity analyses
(not to be confused with the sensitivity of a study) should be specified at the protocol step of the
systematic review; however, may be identified after the preliminary analysis. For example, studies may
be deemed critical in the domain of bias due to confounding resulting from unadjusted analyses of
19 covariates. If a body of evidence includes studies with adjusted and unadjusted analyses, a sensitivity
analysis could compare the estimates of effect for the adjusted (removing those studies not adjusting for
covariates) and the total pooled estimate. If the effect estimates are not robust and differ between
analyses (i.e. confounding may have an influence on the results), then review authors might consider
whether to exclude the studies with unadjusted analyses; however, if the effect estimates do not differ
(e.g. confounding apparently has no influence on the results), then the review authors may keep the
unadjusted studies in the analysis because the suspicion of confounding apparently does not have a big
impact. In these instances when the effect estimate is similar across studies then authors could consider
updating the individual study level ratings to indicate a less severe RoB for the item and include the
rationale that the sensitivity analysis showed no effect of RoB on the results.
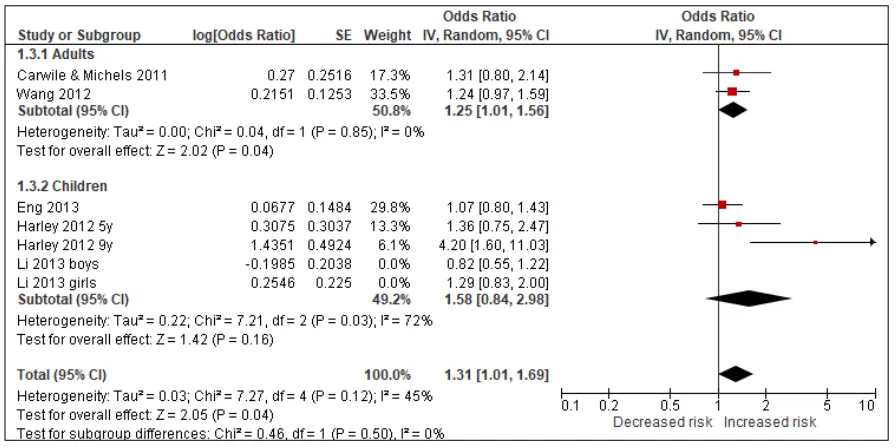
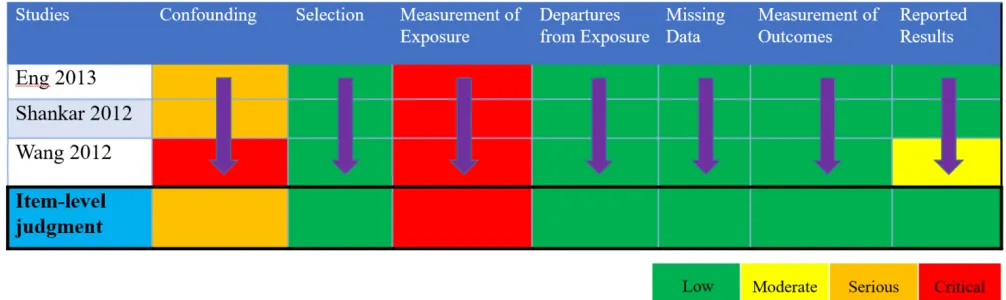
Using BPA as an example, we compared studies for the body weight outcomes of prevalent overweight
and prevalent obesity at higher and lower RoB in sensitivity analyses specifically across the domain of
confounding (Tables 4 & 5; Appendices F & G). We conducted these sensitivity analyses to explore the
potential for bias introduced by studies that did not adjust for all critical confounders. The sensitivity
analysis for the outcome of prevalent overweight resulted in a difference between the effect estimates,
demonstrating that bias due to confounding impacted the pooled estimate; therefore, the judgment would
be reflective of the more severe RoB (Table 4). An additional option would be to only show results from
Harley, Eng, and Carwile in the GRADE evidence assessment. In contrast, the sensitivity analysis of
studies reporting on prevalent obesity demonstrated similar effect estimates (Appendix G). In this
situation, all studies reflect the less serious RoB judgment (Table 5).
3.6. Integration of RoB judgments across a body of evidence into GRADE assessment
20 The overall rating of RoB across the body of evidence for an outcome is integrated into the GRADE
assessment similar to what has been previously described in the literature for the result of RCTs and
observational studies [10]. It is also during this process where indirectness, if identified during Steps I or
II within the RoB instrument for NRS of exposures, would be integrated in the overall assessment of the
evidence. When evaluating RoB using ROBINS-I and the RoB instrument for NRS of exposures, the
body of evidence starts at ‘High’ initial CoE within GRADE. For the example of BPA and its effect on
body weight, we present the outcomes of prevalent overweight (i.e., BMI ≥ 85th percentile for age/sex
in children; 25 ≤ BMI < 30 kg/m2 in adults) and prevalent obesity (BMI ≥ 95th percentile for age/sex in
children; BMI ≥ 30 kg/m2 in adults) in a GRADE evidence profile (Table 6). It is across this body of
evidence that we look for evidence of the three factors (magnitude of effect, dose-response gradient, and
opposing residual confounding) considered in the past as mechanisms to upgrade the quality of the
evidence for NRS within GRADE [21]. The BPA example does not demonstrate any situation, based on
these three factors, which may lead to a less severe RoB judgment. Across the body of evidence for
prevalent overweight, our RoB based on the RoB instrument for NRS of exposures and sensitivity
analysis of the item of confounding is ‘Critical’, resulting in a rating down of three levels for RoB. In
addition, we rate down for imprecision because the effect estimate crosses the null. Our final CoE would
be ‘Very low’. Across the body of evidence for prevalent obesity, our RoB is ‘Serious’; therefore, we
rate down two levels for RoB. There are no other GRADE domains that we would rate down for. Our
final CoE would be ‘Low’.
4. Discussion
The RoB instrument for NRS of exposures presents a novel instrument for conducting the RoB
assessment of individual studies included in a systematic review of the health effects of exposure. In this
21 users’ guide, we suggest that the RoB instrument for NRS of exposures provides a standardized
instrument for the transparent evaluation of RoB for NRS of exposures. We present an overview of the
process, using examples to demonstrate specific issues encountered when formulating the PECO for the
review, outlining a target experiment for an individual study, evaluating bias in individual studies, and
summarizing judgments across the body of evidence. We highlight the need for critical consideration of
the RoB judgments, including situations within individual studies and across a body of evidence when
the judgments may be less severe. In addition, we present sources of indirectness identified in eligible
studies that would inform the GRADE evidence assessment. We also present the steps for integrating the
RoB across a body of evidence into a GRADE evidence profile.
3.1. Advantages and disadvantages of using the RoB instrument for NRS of exposures approach
Some challenges remain, specifically when defining the target experiment and making judgments at the
study and review level. The major challenge when identifying a hypothetical target randomized
experiment is that much of the research on environmental health exposures focuses on a potential link
with a human health hazard. Defining a specific comparison to an exposure presents a challenge, as
there may be a paucity of evidence to support the distinct exposure and comparator; however, in this
paper we present five scenarios to facilitate the identification of an exposure and comparator [12]. In
addition, the best available studies to inform a review may only present data on one exposure category.
In this situation, we recommend other sources of comparative exposure data, such as historical controls
(i.e. source of data presents levels of exposure before and after introduction to a known source of
exposure).
22 Inter-rater reliability of the RoB instrument for NRS of exposures has not yet been measured; however,
the purpose of the RoB instrument for NRS of exposures is not necessarily to have different experts
reach the same judgment per study and across studies, but instead to justify the judgements and make the
judgements transparent. We present several examples when using the RoB instrument for NRS of
exposures. More examples are needed to highlight nuances of this instrument when applied on an
individual-study and across-study basis.
Based on concerns from systematic-review authors and guideline developers in the environmental health
field, the RoB instrument for NRS of exposures evaluates bias using a standardized comparison to a
hypothetical target experiment. This allows the body of evidence to start at ‘High’ initial CoE within the
GRADE framework, potentially improving acceptability of this instrument and the use of GRADE for
environmental decision-making assessments. Of note is that randomized controlled exposure trials in
animals would be evaluated with the framework for randomized trials and not the herein described
instrument.
4.2. Relation to other studies
This is the first article describing examples from systematic reviews using the RoB instrument for NRS
of exposures to evaluate the RoB across a body of evidence for a specific outcome. We present one
option of a RoB matrix displaying the RoB study- and item-level judgments. In addition, we present
examples of when an individual and a body of evidence RoB judgment may be improved (determined to
be a less severe RoB) based on further exploration of residual and unmeasured confounding. We
highlight the value added by performing sensitivity analyses with the body of evidence to explore
sources of bias.
23 The application of ROBINS-I for RoB assessment across a body of evidence is undergoing further
development, as are the procedures for interpreting RoB within the GRADE approach when NRS are
compared to RCTs as in the RoB instrument for NRS of exposures or ROBINS-I [9]. Collaboration
between the developers of the RoB instrument for NRS of exposures and these projects allows for an
iterative approach to methods advancements. We expect that this approach would be applicable to
broader research of exposures conducted in the fields of public health and nutrition, not limited to
environmental exposures.
4.3. Implications for stakeholders using the RoB instrument for NRS of exposures
Evaluating the RoB across the body of evidence for an outcome informs one domain within the GRADE
framework’s evidence assessment contributing to the understanding about the overall CoE. Using this
instrument should not result in a final certainty distinct from the prior approach of starting NRS at ‘Low’
initial CoE within GRADE because the conceptual underpinnings are the same. However, the approach
is fairer and more transparent. Indeed, users may prefer investigating the relationship between rating
down for imbalances due to confounders, selection bias, or misclassification of the exposure instead of
starting at ‘Low’ initial CoE as a general judgment about these items. The process and examples
outlined in this manuscript provide guidance for researchers and guideline developers using evidence
about exposures to inform their systematic reviews and decision making.
4.4. Unanswered questions and future research
This research provides many opportunities for further application and assessment of the RoB instrument
for NRS of exposures and integration into GRADE. Specific areas of interest based on our research may
include 1) how to apply the RoB instrument for NRS of exposures to primary studies that use different
24 exposure measurement strategies; 2) the process for making a judgment about the body of evidence
when using different techniques to synthesize evidence of the effects; and 3) the role of dose-response
within RoB and GRADE assessments.
We present several measurement strategies that may be used when direct measures of the exposure are
unfeasible or not available, such as modelling, or environmental or personal monitoring. Each method
may be associated with greater or lesser specificity and/or potential for exposure misclassification.
Application of the RoB instrument for NRS of exposures to topics using these measures is needed.
In addition, we present the process for when the RoB across a body of evidence can be further explored
and assessed by using meta-analytic approaches; however, systematic reviews of exposures may use
other approaches to summarize evidence, such as a qualitative analysis or narrative summary. Further
exploration of how these methods may translate to different summary approaches is needed.
Lastly, while we present situations of where magnitude of effect and opposing residual confounding
may decrease our concerns about bias within both individual assessments and across the body of
evidence, more exploration of the role of dose-response is needed. Future research should provide
examples of how to incorporate dose response into an assessment using the RoB instrument for NRS of
exposures.
5. Conclusions
The RoB instrument for NRS of exposures provides a novel approach for evaluating RoB of exposures.
Determining the RoB across a body of evidence is critical to inform decision making about health
25 exposures. We present guidance and examples for systematic-review authors and guideline developers
to follow when using this instrument.
26
Acknowledgments
We are grateful to all systematic review and GRADE members who have collaborated with their
feedback and suggestions for this work. We thank Jani Ruotsalainen, Finnish Institute of Occupational
Health, Cochrane Work Review Group, for his help in formulating the PECO questions on noise
exposure.
27
Funding Sources
This research was supported by the Intramural Research Program of the National Institute of
Environmental Health Sciences and the MacGRADE Centre at the McMaster University.
28
Authors’ Contributions
RLM, KAT, and HJS designed and conceived of the study. RB, SEE, AEG, and PR conducted the risk
of bias evaluations and provided feedback on its use. RLM and HJS developed the schematic. RLM,
KAT, NS, ACH, and HJS reviewed suggestions for operationalization and integration of the instrument.
RLM drafted the manuscript. KAT, NS, ACH, MA, EA, TF, AH, JM, RAM, JV, MV, PW and HJS
reviewed the manuscript and provided major revisions. All authors read and approved the final
manuscript.
29
References
1. Woodruff TJ, Sutton P: The Navigation Guide systematic review methodology: a rigorous and transparent method for translating environmental health science into better health outcomes. Environ Health Perspect 2014, 122(10):1007-1014.
2. Balshem H, Helfand M, Schunemann HJ, Oxman AD, Kunz R, Brozek J, Vist GE, Falck-Ytter Y, Meerpohl J, Norris S et al: GRADE guidelines: 3. Rating the quality of evidence. J Clin Epidemiol 2011, 64(4):401-406.
3. Liberati A, Altman DG, Tetzlaff J, Mulrow C, Gøtzsche PC, Ioannidis JP, Clarke M, Devereaux PJ, Kleijnen J, Moher D: The PRISMA statement for reporting systematic reviews and meta-analyses of studies that evaluate health care interventions: explanation and elaboration. PLoS medicine 2009, 6(7):e1000100.
4. Rooney AA, Cooper GS, Jahnke GD, Lam J, Morgan RL, Boyles AL, Ratcliffe JM, Kraft AD, Schünemann HJ, Schwingl P: How credible are the study results? Evaluating and applying internal validity tools to literature-based assessments of environmental health hazards.
Environment international 2016, 92:617-629.
5. Morgan RL, Thayer KA, Santesso N, Holloway AC, Blain R, Eftim SE, Goldstone AE, Ross P, Guyatt G, Schünemann HJ: Evaluation of the risk of bias in non-randomized studies of interventions (ROBINS-I) and the ‘target experiment’concept in studies of exposures: Rationale and preliminary instrument development. Environment international 2018, 120:382-387.
6. Sterne JA, Hernan MA, Reeves BC, Savovic J, Berkman ND, Viswanathan M, Henry D, Altman DG, Ansari MT, Boutron I et al: ROBINS-I: a tool for assessing risk of bias in
non-randomised studies of interventions. BMJ 2016, 355:i4919.
7. Cochran WG, Chambers SP: The planning of observational studies of human populations.
Journal of the Royal Statistical Society Series A (General) 1965, 128(2):234-266.
8. Hernán MA, Robins JM: Using big data to emulate a target trial when a randomized trial is not available. American journal of epidemiology 2016, 183(8):758-764.
9. Schünemann HJ, Cuello C, Akl EA, Mustafa RA, Meerpohl JJ, Thayer K, Morgan RL,
Gartlehner G, Kunz R, Katikireddi SV: GRADE Guidelines: 18. How ROBINS-I and other tools to assess risk of bias in non-randomized studies should be used to rate the certainty of a body of evidence. Journal of clinical epidemiology 2018.
10. Guyatt GH, Oxman AD, Vist G, Kunz R, Brozek J, Alonso-Coello P, Montori V, Akl EA, Djulbegovic B, Falck-Ytter Y et al: GRADE guidelines: 4. Rating the quality of evidence--study limitations (risk of bias). J Clin Epidemiol 2011, 64(4):407-415.
30 11. Morgan RL, Thayer KA, Bero L, Bruce N, Falck-Ytter Y, Ghersi D, Guyatt G, Hooijmans C,
Langendam M, Mandrioli D et al: GRADE: Assessing the quality of evidence in environmental and occupational health. Environ Int 2016, 92-93:611-616.
12. Morgan RL, Whaley P, Thayer KA, Schunemann HJ: Identifying the PECO: A framework for formulating good questions to explore the association of environmental and other
exposures with health outcomes. Environ Int 2018.
13. Carwile JL, Michels KB: Urinary bisphenol A and obesity: NHANES 2003-2006. Environ Res
2011, 111(6):825-830.
14. Ranciere F, Lyons JG, Loh VH, Botton J, Galloway T, Wang T, Shaw JE, Magliano DJ: Bisphenol A and the risk of cardiometabolic disorders: a systematic review with meta-analysis of the epidemiological evidence. Environ Health 2015, 14(1):46.
15. Harley KG, Schall RA, Chevrier J, Tyler K, Aguirre H, Bradman A, Holland NT, Lustig RH, Calafat AM, Eskenazi B: Prenatal and postnatal bisphenol A exposure and body mass index in childhood in the CHAMACOS cohort. Environmental health perspectives 2013,
121(4):514.
16. Guyatt GH, Oxman AD, Kunz R, Woodcock J, Brozek J, Helfand M, Alonso-Coello P, Falck-Ytter Y, Jaeschke R, Vist G et al: GRADE guidelines: 8. Rating the quality of evidence--indirectness. Journal of clinical epidemiology 2011, 64(12):1303-1310.
17. Thayer K, Rooney A, Boyles A, Holmgren S, Walker V, Kissling G, U.S. Department of Health and Human Services: Draft protocol for systematic review to evaluate the evidence for an association between bisphenol A (BPA) exposure and obesity. National Toxicology Program
2013.
18. Higgins J, Sterne J, Savovic J, Page M, Hrobjartsson A, Boutron I, Reeves B, Eldridge S: A revised tool for assessing risk of bias in randomized trials In: Cochrane Methods. Edited by Chandler J, McKenzie J, Boutron I, Welch V.
http://www.cochranelibrary.com/dotAsset/ecafc5c7-0b9b-4cd1-a4c1-8b0013aea046.pdf; 2016.
19. Li D-K, Miao M, Zhou Z, Wu C, Shi H, Liu X, Wang S, Yuan W: Urine bisphenol-A level in relation to obesity and overweight in school-age children. PloS one 2013, 8(6):e65399. 20. Wang H-x, Zhou Y, Tang C-x, Wu J-g, Chen Y, Jiang Q-w: Association between bisphenol A
exposure and body mass index in Chinese school children: a cross-sectional study.
Environmental Health 2012, 11(1):79.
21. Guyatt GH, Oxman AD, Sultan S, Glasziou P, Akl EA, Alonso-Coello P, Atkins D, Kunz R, Brozek J, Montori V et al: GRADE guidelines: 9. Rating up the quality of evidence. J Clin Epidemiol 2011, 64(12):1311-1316.
31 22. Doll R, Hill AB: Smoking and carcinoma of the lung. British medical journal 1950,
2(4682):739.
23. Doll R, Hill AB: Mortality in relation to smoking: ten years' observations of British doctors.
British medical journal 1964, 1(5395):1399.
24. Bross ID: Spurious effects from an extraneous variable. Journal of chronic diseases 1966, 19(6):637-647.
25. Blair A, Stewart P, Lubin JH, Forastiere F: Methodological issues regarding confounding and exposure misclassification in epidemiological studies of occupational exposures. American journal of industrial medicine 2007, 50(3):199-207.
26. Steenland K, Savitz DA: Topics in environmental epidemiology: Oxford University Press, USA; 1997.
27. Kogevinas M: Epidemiological approaches in the investigation of environmental causes of cancer: the case of dioxins and water disinfection by-products. In: Environmental Health: 2011: BioMed Central; 2011: S3.
28. Jurek AM, Greenland S, Maldonado G, Church TR: Proper interpretation of non-differential misclassification effects: expectations vs observations. International journal of epidemiology
2005, 34(3):680-687.
29. Nieuwenhuijsen MJ: Exposure assessment in environmental epidemiology: Oxford University Press, USA; 2015.
30. Cox KJ, Porucznik CA, Anderson DJ, Brozek EM, Szczotka KM, Bailey NM, Wilkins DG, Stanford JB: Exposure classification and temporal variability in urinary bisphenol A
concentrations among couples in Utah—the HOPE study. Environmental health perspectives
2016, 124(4):498.
31. Vandenberg LN, Hunt PA, Myers JP, vom Saal FS: Human exposures to bisphenol A:
mismatches between data and assumptions. Reviews on environmental health 2013, 28(1):37-58.
32. Thayer KA, Doerge DR, Hunt D, Schurman SH, Twaddle NC, Churchwell MI, Garantziotis S, Kissling GE, Easterling MR, Bucher JR: Pharmacokinetics of bisphenol A in humans following a single oral administration. Environment international 2015, 83:107-115.
33. Higgins J, Green S: Cochrane Handbook for Systematic Reviews of Interventions. Version 5.1.0 (updated March 2011). http://handbook.cochrane.org/ [accessed 3 February 2013]. 2011.
32
Appendices
Appendix A. Step I of the RoB instrument for NRS of exposures for the PECO: “What is the effect of highest levels vs. lowest levels of BPA exposure on weight?”
Step I Items Response
Confounding for BPA and obesity
Body composition (age, ethnicity, gender, height, race);
Weight (age, gender);
Waist circumference (age, gender);
Body mass index (age, ethnicity, gender, race);
In addition, consumption of canned or packaged food and drink (“processed” food) that is also energy dense and low-nutrient (e.g., soda) is a significant confounder because food packaging is a main source of exposure to BPA.
Co-exposures: There may be some concern for co-exposure to certain phthalates used in food packaging that have also been linked to obesity. However, phthalates are used in different types of food packaging than BPA (plastic wraps versus canned lining and
polycarbonate materials). No other a priori co-exposures of particular concern are identified for general population studies. There may be some co-exposures that need to be considered in occupational studies and these should be assessed on a case by case basis if discovered.
Co-interventions None identified
Accuracy of the measurement of exposure to BPA (CAS# 80-05-7)
BPA is a non-persistent compound (near 100% elimination within 24 hours after oral exposure, possible longer elimination time from non-oral exposure but on order of days), so blood and urine measures only assess recent exposure. This means current exposure levels may NOT be indicative of past exposures. This is problematic for assessment of BPA as a risk factor for health outcomes that are not acute and take time to develop like obesity.
BPA measures are variable over time in the same person (even during the same day) so methods that utilize repeated measures of exposure are preferred. Some experts on BPA exposure assessment express less concern for lack of repeated measures for NHANES data because it is a large sample survey of the general population.
Standard analytical measures: Measurement of urine or blood by quantitative techniques such as liquid chromatography-triple quadrupole mass spectrometry (LC-MS/MS) and high-pressure liquid chromatography with tandem mass spectrometry (HPLC/MS) are preferred. Measurements made at CDC are considered high-quality.
Measures to minimize sample contamination with BPA should be taken (e.g., glass pipettes, polypropylene plastic lab ware and sample collection materials, water blanks).
Measures of unconjugated BPA in blood need to be very carefully considered based on extent to which investigators controlled for background exposures.
Questionnaire or self-reported measures of BPA exposure are more problematic due to the ubiquity of exposure and lack of
33 knowledge on all possible routes of exposure, e.g., thermal paper, certain pharmaceuticals. However, there is some support for an association between higher urine/blood levels of BPA and higher reported use of BPA-containing food packaging (e.g., canned food consumption) or handling of BPA-containing thermal paper (cashiers) so questionnaire data that assess these types of exposure sources may have some utility in assessing longer-term time trends in exposure.
Accuracy of the measurement of outcome of obesity
Body Composition: Dual-energy X-Ray absorptiometry, triceps skinfold thickness, subscapular skinfold thickness, suprailiac skinfold thickness
Measured waist circumference
Body mass index
Measured weight
*Obesity typically develops relatively slowly over time so preferred follow-up times after start of exposure would be on the order of several months to years.
34
Appendix B. Step II of the RoB instrument for NRS of exposures for Carwile & Michels, 2011
Specify a target randomized trial specific to the study
Design Individual randomized controlled trial
Participants Adults of all ages, predominantly 18-35 years (8.2% <18 years and 7.9% > 35 years). Civilian,
non-institutionalized, United States population. Analyses restricted to participants 18–74 years of age, who were included in the random subsample of participants, who supplied a spot urine sample analyzed for BPA. Experimental intervention BPA highest levels (quartile 4: ≥ 4.7 ng/mL)
Comparator BPA lowest levels (quartile 1: ≤ 1.1 ng/mL)
Specify the outcome
Specify which outcome is being assessed for risk of bias (typically from among those earmarked for the Summary of Findings table). Specify whether this is a proposed benefit or harm of intervention.
Prevalent overweight (Overweight: 25 ≤ BMI < 30 kg/m2 [reference: BMI <25 kg/m2])
Specify the numerical result being assessed
In case of multiple alternative analyses being presented, specify the numeric result (e.g. RR = 1.52 (95% CI 0.83 to 2.77) and/or a reference (e.g., to a table, figure or paragraph) that uniquely defines the result being assessed.
Participants in the upper BPA quartile 4 vs. participants in the lowest BPA quartile 1: OR: 1.76, 95% CI: 1.06–2.94)
35
(i) Confounding domains listed in Step I
Confounding domain Measured variable(s) Is there evidence that
controlling for this variable was unnecessary?
Is the confounding domain measured validly and reliably by this variable (or these variables)?
OPTIONAL: Is failure to adjust for this variable (alone) expected to favor the experimental intervention or the comparator?
Yes / No / No information Favor experimental / Favor comparator / No information
Age, gender Weight No Yes Favor experimental
Consumption of canned or packaged food and drink (“processed” food) that is also energy dense and low-nutrient (e.g., soda)
Daily caloric intake No No Favor experimental because obese
individuals (potentially caused by higher consumption of canned foods and drinks) have higher urinary BPA levels relative to those with normal weight.
(ii) Additional confounding domains relevant to the setting of this particular study, or which the study authors identified as important
Confounding domain Measured variable(s) Is there evidence that
controlling for this variable was unnecessary?
Is the confounding domain measured validly and reliably by this variable (or these variables)?
OPTIONAL: Is failure to adjust for this variable (alone) expected to favor the experimental intervention or the comparator? Yes / No / No information Favor experimental / Favor
comparator / No information Alcohol drinking, fish intake, protein,
fat, carbohydrate, and energy intake
none no no
Carwile JL, Michels KB: Urinary bisphenol A and obesity: NHANES 2003–2006. Environmental research 2011, 111(6):825-830.
36
Appendix C. Step II of the RoB instrument for NRS of exposures for Harley et al., 2013
Specify a target randomized trial specific to the study
Design Individual randomized controlled trial
Participants Children at 5 and 9 years of age born to eligible pregnant women were at least 18 years of age, spoke English or Spanish, qualified for low-income health insurance, were at < 20 weeks gestation, and were planning to deliver at the county hospital. Must have had a singleton, live birth.
Experimental intervention BPA highest levels (tertile 3: 4.6–349.8 μg/g) Comparator BPA lowest levels (tertile 1: <LOD-2.4 μg/g)
Specify the outcome
Specify which outcome is being assessed for risk of bias (typically from among those earmarked for the Summary of Findings table). Specify whether this is a proposed benefit or harm of intervention.
Prevalent overweight (Overweight: BMI ≥ 85th percentile at 5 and 9 years of age)
Specify the numerical result being assessed
In case of multiple alternative analyses being presented, specify the numeric result (e.g. RR = 1.52 (95% CI 0.83 to 2.77) and/or a reference (e.g. to a table, figure or paragraph) that uniquely defines the result being assessed.
Participants in the upper BPA tertile 3 vs. participants in the lowest BPA tertile 1: OR = 1.36 (0.75–2.47)
37
(i) Confounding domains listed in Step I
Confounding domain Measured variable(s) Is there evidence that
controlling for this variable was unnecessary?
Is the confounding domain measured validly and reliably by this variable (or these variables)?
OPTIONAL: Is failure to adjust for this variable (alone) expected to favor the experimental intervention or the comparator?
Yes / No / No information Favor experimental / Favor comparator / No information
Age, gender Weight No Yes Favor experimental
Consumption of canned or packaged food and drink (“processed” food) that is also energy dense and low-nutrient (e.g., soda)
Child consumption of soda, fast food, and sweets
No Yes Favor experimental because obese
individuals (potentially caused by higher consumption of canned foods and drinks) have higher urinary BPA levels relative to those with normal weight.
(ii) Additional confounding domains relevant to the setting of this particular study, or which the study authors identified as important
Confounding domain Measured variable(s) Is there evidence that
controlling for this variable was unnecessary?
Is the confounding domain measured validly and reliably by this variable (or these variables)?
OPTIONAL: Is failure to adjust for this variable (alone) expected to favor the experimental intervention or the comparator? Yes / No / No information Favor experimental / Favor
comparator / No information
Television watching Average daily TV
time
No Yes Favor experimental
Environmental tobacco smoke exposure Self-reported mother’s smoking status
No Yes No information
Time spent playing outdoors Unknown No No information No information
Harley KG, Schall RA, Chevrier J, Tyler K, Aguirre H, Bradman A, Holland NT, Lustig RH, Calafat AM, Eskenazi B: Prenatal and postnatal bisphenol A exposure and body mass index in childhood in the CHAMACOS cohort. Environmental health
perspectives 2013, 121(4):514.
38
Appendix D. Summary of Step III of the RoB instrument for NRS of exposures and the direction of bias and reaching the overall bias judgement for Carwile & Michels, 2013
Bias items Risk of
bias Direction of bias Rationale
Bias due to
confounding Serious Unknown NHANES data were used. Specific details were not provided in the study report, but NHANES co-variate data were obtained from either a standardized questionnaire or laboratory methods (e.g., creatinine). The reliability/validity of the questionnaire was not reported, but it is not expected to appreciably bias the results. Most of the critical confounders were considered statistically, but there is possibility of residual unmeasured (and unidentified) confounding. For the most part, although certain post-exposure variables are relevant to evaluating obesity (e.g., caloric intake), there is little information on the association of these variables to BPA exposure.
No indication that time-varying confounding is a major concern given the cross-sectional nature of the study.
Critical confounders (age, gender, and ethnicity) were accounted for in the analysis. Model 1 was adjusted for age, sex, and urinary creatinine. Model 2 was adjusted for race, education, and smoking in addition to Model 1 covariates.
Bias in selection of participants into the study
Low N/A Study is cross-sectional. Subjects were randomly selected from NHANES subjects with urinary BPA data available using the same criteria. Selection of subjects was unrelated to either exposure or outcome.
While there is no information on start of exposure, everyone is exposed to BPA
throughout their life, but the levels will change over time. Although BPA is ubiquitous, start of exposure and how exposure changes over time are not known. Timing of recruitment was similar (2003-2006) but given that the age ranged from 18 to 74 years, exposure could range by more than a decade.
39 Bias in
classification of exposures
Critical Concerns of bias toward the null due to non-differential misclassification of the exposure.
Urinary BPA concentration was measured in 1 spot sample from each participant. The lower limit of detection (LLOD) was 0.36ng/ml in 2003/04 and 0.4ng/ml in2005/06. For BPA concentrations below the LLOD (2003/04: n=110/1373 [8%]; 2005/06:
n=114/1374 [8%]) NHANES assigned a value of the LLOD divided by the square root of two. BPA is a non-persistent compound and exposure measures were not repeated. Therefore, there is no confidence that the current exposure reflects exposure over the subject's life time or even over any duration of time. Because this population is obtained from NHANES some experts consider the lack of repeated measures to be less of a concern because it is a large survey of the general population (this cross-sectional study had a population of 2747 adults).
Exposure was measured at same time as outcome, but participants were likely exposed throughout life due to BPA being a ubiquitous exposure. Therefore, it is unlikely that entry into the cohort started with the exposure.
Cross-sectional analyses with both BPA exposure and weight, height, and waist circumference used to define obesity assessed simultaneously.
Urine samples were obtained at the time that obesity measurements were obtained and analyzed later in a laboratory separate from where the data were collected. In addition, NHANES collected data on a variety of compounds and health effects without
knowledge of the intent for this current study indicating that exposure status is not likely to be biased by knowledge of the outcome.
The range/variability in exposure was likely sufficient with a 25th to 75th percentile range of 1.18 to 3.33 ng/mL urinary BPA ng/mL and quartiles ranging from <1.1 ng/mL to >4.7 ng/mL. However, we are not confident that the subjects were exposed to this concentration for a long period of time. Lacking information on the duration that
subjects were exposed to these levels, the single BPA measurement obtained at the same time as outcome is not of sufficient to detect an effect of exposure.
Urinary BPA samples were collected at the same time that height, weight, and waist