Published Online April 2013 in SciRes (http://www.scirp.org/journal/ce) DOI:10.4236/ce.2013.44A005
Using the GLOBE Program to Educate Students on the
Interdependence of Our Planet and People
Sherry S. Herron
1, Jennifer L. Robertson
21Department of Biological Sciences, University of Southern Mississippi, Hattiesburg, USA 2
Department of English, University of Southern Mississippi, Hattiesburg, USA Email: [email protected], [email protected]
Received January 31st, 2013; revised February 28th, 2013; accepted March 14th, 2013
Copyright © 2013 Sherry S. Herron, Jennifer L. Robertson. This is an open access article distributed under the Creative Commons Attribution License, which permits unrestricted use, distribution, and reproduction in any medium, provided the original work is properly cited.
We present how we have used GLOBE protocols and programs in a college undergraduate English course for science and non-science majors, “Writing in the Sciences”, and in a graduate-level field course for in-service teachers. Collecting land cover data and determining biomass in conjunction with a series of writing assignments allowed the English students to connect their work to research done in ecosystems throughout the world, and to specific environmental concerns such as carbon sequestration, biodiversity, and the impact of controlled burning on ecosystems. Teachers demonstrated increased knowledge of ecology, natural histories of various organisms, and awareness of environmental resources. A study con-ducted the following summer revealed that teachers valued the course and felt that their experiences helped them be more effective teachers. Six of the eight teachers had conducted field activities with their students, but also reported significant challenges associated with the effort.
Keywords: GLOBE Program; Teacher Education; Biomass; Non-Science Majors; Environmental Education
Introduction
The GLOBE Program (Global Learning and Observations to Benefit the Environment) promotes the acquisition of the proc-ess concepts and skills strproc-essed in the National Science Educa-tion Standards: identifying a problem, designing an experiment, identifying variables, posing questions, making accurate obser-vations and measurements, using equipment properly, detecting measurement errors, using math to solve problems, explaining data and its measurement relationships, presenting data, com-municating results, and presenting findings in multiple formats (NRC, 1996). Students can measure, conduct data analysis, and submit actual field data (i.e. pH, dissolved oxygen, turbidity, invertebrate counts, land cover, etc.) collected during their in-vestigations to the GLOBE Student Data Server. This data is available to students and scientists for analysis.
GLOBE is an interagency program funded by NSF, NASA, NOAA, and supported by the US Department of State. In addi-tion, over 100 countries manage and support this program in elementary and/or secondary education. The GLOBE Program has enabled us to incorporate authentic scientific investigations and field experiences into a variety of undergraduate students and graduate courses for science teachers (www.GLOBE.gov). In addition, the program allows us to promote environmental stewardship and is a vehicle for service-learning.
The GLOBE Program includes multiple protocols divided into four areas: atmosphere, Earth as a system, hydrology, land cover/biology, and soil. As the first author is a biology educator and a GLOBE partner, we focus on land cover/biology and hydrology protocols and its new program, “Investigating the
Carbon Cycle in Terrestrial Ecosystems”
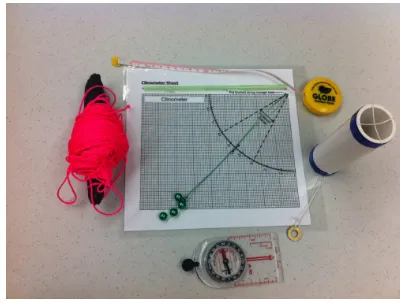
(http://GLOBE carboncycle.unh.edu/). The Modified UNESCO Classification or “MUC” is used for reporting the type of land cover in a study site (typically a 30 square meter area). MUC codes range from natural to developed; wetland to grassland; rivers to oceans; and everything in between. Recently, a cell phone app has been developed for ease in determining the MUC code of a study site. Land cover/biology data is collected from a study site and includes photographs taken in the center of the site from the four cardinal directions, the tree height and circumference of sample trees, and the type and percentages of ground and canopy cover. The Carbon Cycle program adds tree identification and requires obtaining the height and circumfer-ence of every tree over 5 meters tall in the study site. A camera, compasses, tape measures, string, and flags are needed to mark off the site. Tree height is calculated using a tape measure and a simple hand-made clinometer based on a printed copy of a pro-tractor template. (Tangents for angles are provided on the re-verse side of the template.) Tree circumference is measured with a tape measure at a standard height from the ground. Can-opy and ground cover is measured on the diagonal transects of the study site. Data is collected every two paces using a hand- made densiometer and visual observations. Figure 1 is a pho- tograph of the equipment used to collect land cover/carbon cycle data. Table 1 provides a simplified procedure for collect-ing land cover data.
Figure 1.
[image:2.595.70.270.84.238.2]The home-made and inexpensive equipment used for data col- lection: string, clinometer, measuring tape, densiometer, and compass.
Table 1.
Simplified procedures for collecting land cover data and carbon cycle data.
Step Procedure
1 Measure off and mark a study site (i.e. 30 m × 30 m) using a compass and measuring tape.
2 Mark 2 diagonal transects (from each corner to the other).
3
Take measurements every 2 paces along these transects using a densiometer to determine canopy cover and simple observation to determine ground cover.
4
For each tree at least 5 m in height in the study site, record its common name, determine the circumference at breast height using a measuring tape, and height using a clinometer and measuring tape.
across time. For this purpose, biomass is a measure of the amount of carbon stored in the trees, and is determined by measuring tree circumference and using species-specific coeffi-cients as reported by Jenkins et al. (2003). The program pro-vides a spreadsheet that automatically calculates biomass. Stu-dents must enter the dimensions of the study site and the tree type and circumference of each tree in the site. The carbon cycle is an essential piece of ecological processes such as plant growth and accumulation, and the death and decay of plant material. At the global scale, the carbon cycle influences Earth’s climate by regulating the amount of carbon dioxide, a major greenhouse gas, in the atmosphere. Because land-based ecosystems store as much carbon as the atmosphere, plants and soils play an important role in regulating climate.
We have used GLOBE protocols and programs in a college undergraduate English class for non-science majors “Writing in the Sciences”; a biology methods class for pre-service teachers, a graduate-level field course in Florida for in-service teachers; and grant-funded outreach for K-12 students and professional development for their teachers. In this article, we present two of the ways we have incorporated the program and the results we have obtained.
Undergraduate Course in Advanced
Composition: Writing in the Sciences
Methodology
For the writing students, the GLOBE program helped
pro-vide the perfect opportunity to investigate the intersection be-tween writing and science, as well as the intersection bebe-tween science and socio-political issues. Students were required to compose a research portfolio which included a proposal, anno-tated bibliography, primary research article, and poster paper presentation. The research portfolio enabled students to present data collected using the GLOBE biometry protocols which measured biomass, tree circumference, tree height, ground cover, and canopy cover.
The first part of their portfolio was a proposal based on the research and grant proposals that researchers are often asked to write in the course of their projects. These proposals are often read, analyzed and approved by a diverse range of audiences including non-technical audiences in granting agencies, scien-tists in other fields, and scienscien-tists within their own field. The students needed to be able to accommodate those various audi-ences by framing their research to the needs and interests of that audience. One of the learning outcomes for the class re-quired that students develop rhetorical awareness: to be able to meet the needs and expectations of various audiences. The research portfolio fulfilled this outcome because it allowed them the opportunity to research and write for a variety of au-diences.
The second step in the project was an annotated bibliography which asked students to demonstrate their ability to research within their field. Students were required to locate primary, peer-reviewed research articles that related to their experiment in order to understand the niche that their own data collection filled. The audience for this annotated bibliography is scientists interested in their research, but not necessarily in their field.
Students were then asked to produce a primary research arti-cle that incorporated their research from the annotated bibliog-raphy and presented the data collected from the GLOBE proto-cols. Students were asked to write for an audience of scientists within their field, and to adopt the conventions of scientific communication. For the final stage of their project, students presented their findings during a poster paper session at the end of the semester.
Results
In their proposals, students recognized how people in the city and surrounding areas might be impacted by research on bio-mass. Many students focused on the benefits that could be ex-perienced by the immediate community, while others focused on the impact on local industry. For example, one student pro-posed to study biomass in order to create economic incentives for farmers:
“Tree farms in Mississippi aid in increased carbon seques-tration. The introduction of an economic incentive package for Mississippi farmers could intensify the produce of carbon se-questration by prolonging tree life until carbon sese-questration has met maximum capacity.”
“An intense survey of Forrest and Lamar counties for the purpose of collecting animal population, species and commu- nity biomass data would be invaluable to understanding the condition of our locale and provide guidance to governing parties in forming environmental regulations specially de- signed to address the needs of the Pine Belt.”
As we can see in the previous examples, the proposal as- signment enabled the students to focus on local community needs and concerns that necessitated scientific research. The next step was to conduct the field research.
Our university is fortunate to have a stand of long-leaf pines,
Pinus palustris, in close proximity to the campus. These once dominant trees have largely been replaced by loblolly and slash pines across the southeastern portion of the United States. Stu-dents collected data in a controlled burn area in the Long Leaf Preserve during one semester and a mixed hardwoods bottom-land forest during another. After marking off a 15 square meter (m2) study site, students determined ground cover and canopy cover, but tree circumference is the only measurement used to calculate biomass. Table 2 shows the tree circumference of the eleven long-leaf pines ranging from approximately 71 centime-ters at breast height (CBH) to 172 CBH measured by the first group. Table 3 shows the results of biomass calculations. Val-ues of the total aboveground biomass, each above ground component (i.e. foliage, stem, branches), and roots are pre-sented. The total biomass was determined to be 8714 grams per square meter (g/m2). Of that, 4357 g/m2 can be attributed to carbon. Not surprisingly, students can see from the data that stems (i.e. tree trunks) account for most of the biomass (6798 g/m2), but surprisingly, roots account for the second most (1855 g/m2); followed by branches (1415 g/m2), and lastly, foliage (i.e. the pine needles) (501 g/m2). A GLOBE protocol that we did not conduct would have reminded students of the contribution that dead pine needles on the ground would make on biomass.
The second group of students selected a different site; one that had previously been identified as a mixed hardwood low-land forest. Table 4 summarizes the process of determining that
Table 2.
Tree circumference data collected in the long-leaf pine controlled burn study site.
Species name Tree circumference
(CBH in cm) Species name
Tree circumference (CBH in cm)
Pinus palustris 132.91 Pinus palustris 127.80
Pinus palustris 138.92 Pinus palustris 86.98
Pinus palustris 148.84 Pinus palustris 70.97
Pinus palustris 159.83 Pinus palustris 113.04
Pinus palustris 76.93 Pinus palustris 171.76
[image:3.595.308.539.118.362.2]Pinus palustris 159.83
Table 3.
Calculations of biomass based on data collected in the long-leaf pine controlled burn study site.
Total above ground Foliage Stem Branch Roots
Plot biomass
(kg/plot) 7843 451 6118 1274 1670
Biomass g/m2 8714 501 6798 1415 1855
Carbon g/ m2 4357 250 3399 708 928
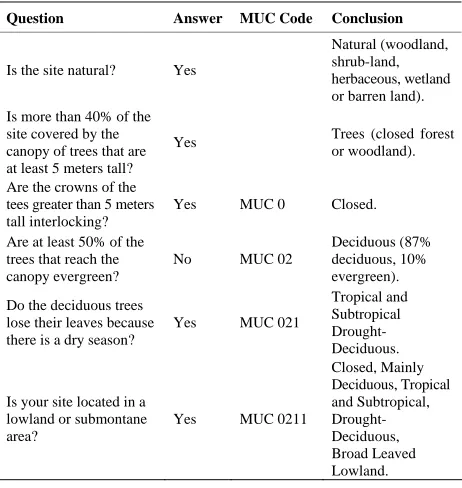
Table 4.
Summary of the questions used to determine the MUC code of the second study site.
Question Answer MUC Code Conclusion
Is the site natural? Yes
Natural (woodland, shrub-land, herbaceous, wetland or barren land). Is more than 40% of the
site covered by the canopy of trees that are at least 5 meters tall?
Yes Trees (closed forest or woodland).
Are the crowns of the tees greater than 5 meters tall interlocking?
Yes MUC 0 Closed.
Are at least 50% of the trees that reach the canopy evergreen?
No MUC 02
Deciduous (87% deciduous, 10% evergreen).
Do the deciduous trees lose their leaves because there is a dry season?
Yes MUC 021
Tropical and Subtropical Drought- Deciduous.
Is your site located in a lowland or submontane area?
Yes MUC 0211
Closed, Mainly Deciduous, Tropical and Subtropical, Drought- Deciduous, Broad Leaved Lowland.
the MUC code of this site is 0211, meaning that the site was a closed, broad leaf/mixed hardwood lowland forest.
[image:3.595.58.289.518.627.2]Table 5 lists the common names of the trees identified in the 15 m2 study site and the circumference of each one. Students identified 4 sweet gums with CBH ranging from 12 cm to 112 cm; 7 hackberries with CBH ranging from 16 cm to 57; 1 sassa- fras at 31 cm; 7 magnolias with CBH ranging from 14.5 cm to 124.5 cm; and 5 oaks with CBH ranging from 8 cm to 125 cm.
Table 6 summarizes the calculations of biomass based on this data. Total biomass was determined to be 16,963 g/m2 with 8481 g/m2 attributed to carbon. Again, stems account for most of the biomass (12,882 g/m2), roots second most (3469 g/m2); followed by branches (3310 g/m2), and lastly, foliage (770 g/m2).
As students moved into later portions of the research portfo- lio, they were able to make specific connections between this data and studies performed by scientists in ecosystems around the world, and global environmental concerns. Instead of gen- eral claims of the effects of local biomass on the concern of global warming, students connected their own experiment to controlled burns in other ecosystems. For example, students connected the prescribed burning of the long leaf pine in Mis- sissippi to the prescribed burning of long leaf pines in Montana (Peters, 2008). One student submitted “An Annotated Bibliog-raphy of Scientific Literature on Carbon Sequestration in For-ests and Possible Implications of ForFor-ests in Reducing CO2” which studied the potential of Mississippi pine forests as carbon sinks, and noted that the potential of these forests in reducing atmospheric carbon is overlooked in part due to Mississippi’s struggling economy. The student noted that “by raising aware- ness and value of these carbon reduction potentials, it is possi- ble to further reduce CO2concentrations as well as provide the
[image:3.595.56.286.672.735.2]Table 5.
Common name and tree circumference data (CBH in cm) collected in the mixed hardwood lowland forest study site.
Common name/tree circumference (CBH in cm)
Common name/tree circumference (CBH in cm)
Sweet gum 89.9 Magnolia 22.0
Sweet gum 12.0 Magnolia 40.3
Sweet gum 112.1 Magnolia 27.0
Sweet gum 33.0 Magnolia 124.5
Sassafras 31.0 Magnolia 29.0
Hackberry 24.5 Magnolia 23.0
Hackberry 43.4 Magnolia 14.5
Hackberry 53.5 Oak 41.5
Hackberry 56.0 Oak 8.0
Hackberry 57.0 Oak 69.0
Hackberry 17.0 Oak 120.0
[image:4.595.56.288.355.419.2]Hackberry 16.0 Oak 125.2
Table 6.
Calculations of biomass based on data collected in the mixed hardwood lowland forest study site.
Total above ground Foli-age Stem Branch Roots
Plot biomass
(kg/plot) 3817 173 2899 745 781
Biomass g/m2 16,963 770 12,882 3310 3469
Carbon g/m2 8481 385 6441 1655 1735
research to related studies performed in Europe and Australia (Keith, 2009).
Other students were able to link their research on biomass and prescribed burning to its effects on other plants and animal life in the area. One student focused her efforts on the effect of prescribed burning on biodiversity, connecting prescribed burning efforts to restore sage-grouse habitats in Wyoming (Beck, 2009), efforts to restore vegetation and study bird re-sponse to burning efforts in the Ozark Glades (Comer, 2011), and the impact of prescribed burning on vegetation and birds in tallgrass prairies (Van Dyke, 2004).
Instead of focusing on local economic development, in the final portions of the research portfolio students were able to position themselves within a global community working toward understanding environmental problems. Using the GLOBE protocols in conjunction with a series of writing assignments allowed students to connect their work to research done in eco-systems throughout the world, and to specific environmental concerns such as carbon sequestration, biodiversity, and the impact of controlled burning on ecosystems.
Graduate Field Course for In-service Science
Teachers
Methodology
A two-week long summer field biology course for secondary and post-secondary science and mathematics teachers was conducted at sites throughout Florida. Sixteen teachers and the first author spent several days at three sites: Manatee Springs,
Everglades National Park, and Long Key State Park. In addition to time devoted to their individual investigations, the class col- lected land cover, soil, and hydrology data at each site. Table 7
provides the list of equipment and materials used.
The class divided into three teams to collect the data, but team members rotated so that each person had the opportunity to conduct each type of protocol.
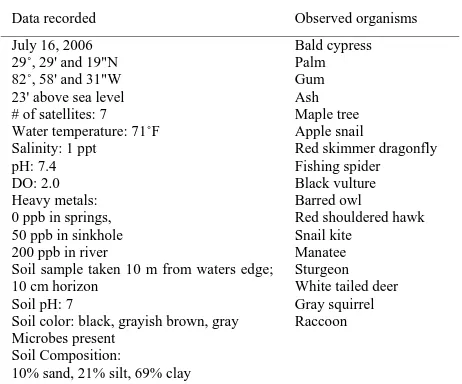
Located in northwest Florida, Manatee Springs flows into the Suwannee River which, in turn, flows into the Gulf of Mexico. The spring produces 81,000 gallons of freshwater every minute. The Manatee Springs area is surrounded by dry, sandy soil covered by a wooded canopy. Spanish moss hangs from red maple and sweet gum trees—wetland hardwoods that grow along river and stream beds. Air plants and resurrection ferns are found on the bald cypress trees. Upland hardwoods include oaks and southern magnolia, a broad-leafed evergreen tree. Two 15 m2 study sites within the campground were surveyed. By definition, a campground is a disturbed area, and indeed, a heavy herbaceous layer showed evidence of high human impact. Therefore, the group rated the ecosystem as fair. The flood plain area, however, revealed very little human disturbance. The low herbaceous layer indicated an old growth forest and a healthy habitat. Table 8 provides the data collected at this site.
The second camp site was in the Everglades National Park. Established in 1947, the park is composed of almost three mil-lion acres and spans the southern tip of the Florida peninsula. Elevation varies from a few feet below sea level to 8 feet above. The park has been designated a World Heritage Site, an Inter-national Biosphere Reserve, and a Wetland of InterInter-national Importance. The only North American park considered a sub-tropical preserve, it is inhabited by both temperate and sub-tropical plant communities including pine savannahs, hardwood ham-mocks, coastal prairie, and mangrove swamps. Hamham-mocks, dome-shaped tree “islands” that grow on natural rises of only a few inches, are surrounded by marsh. These hammocks contain mangrove, cypress, pine, live oak, red maple, hackberry, ma-hogany, cocoplum, and gumbo limbo trees (one of the most wind-tolerant trees in South Florida and recommended as a hurricane-resistant species). The trunks of some trees were almost completely covered by the strangler fig and another epiphyte observed was the butterfly orchid. Table 9 provides the data collected at this site.
[image:4.595.307.539.581.736.2]At Long Key State Park, we surveyed a mangrove swamp. Numerous mud fiddler crabs were observed. These crabs dig
Table 7.
Materials used by the land, soil, and water quality teams.
Team Materials
Land cover
50 meter tape Slap ruler Densiometer GPS unit Field guides
Soil
Auger
Graduated cylinder Sodium hexmetaphosphate Munsell soil color chart LaMotte soil pH kit LaMotte surface lead test kit Soil organisms study kit
Hydrology
LaMotte water quality test kits: pH, DO, salinity
Table 8.
Data collected by teachers at Manatee Springs State Park.
Data recorded Observed organisms
July 16, 2006 29˚, 29' and 19"N 82˚, 58' and 31"W 23' above sea level # of satellites: 7 Water temperature: 71˚F Salinity: 1 ppt pH: 7.4 DO: 2.0 Heavy metals: 0 ppb in springs, 50 ppb in sinkhole 200 ppb in river
Soil sample taken 10 m from waters edge; 10 cm horizon
Soil pH: 7
Soil color: black, grayish brown, gray Microbes present
Soil Composition:
10% sand, 21% silt, 69% clay
Bald cypress Palm Gum Ash Maple tree Apple snail
Red skimmer dragonfly Fishing spider Black vulture Barred owl Red shouldered hawk Snail kite
[image:5.595.306.539.110.279.2]Manatee Sturgeon White tailed deer Gray squirrel Raccoon
Table 9.
Data collected by teachers at the Everglades National Park.
Data recorded Observed organisms
July 17, 2006 25˚48'43"N 80˚49'21"W
3.9' above sea level at campsite Natural max elevation 8' Satellites: 7
Water temperature: 80˚F Salinity: 0 ppt pH: 8.1 DO: 2.75
Heavy metals: 150 ppb
Soil sample taken 1 m from camp site; 10 cm horizon
Soil color: olive brown No microbes present Soil pH: 7
Shallow soil layer over limestone Soil composition:
22% sand, 11% silt, 60% clay
Star grass Foliose lichen Butterfly orchid Mosquito Swallow tailed kite Snowy Egret Anhinga Ibis American alligator Lubber grasshopper Fishing spider Land hermit crab Florida tree snail Florida softshell turtle Oppossum
burrows in mangrove stands and mudflats that can be up to three feet deep, and usually end in a “room” which they occupy during high tide. Fiddler crabs serve as a food source for blue crab, birds, and raccoons, but also play important roles in marsh processes. Their burrowing and feeding affect the aeration, and hence the growth of marsh grasses. They stimulate the turnover and mineralization of important nutrients. They are also a good environmental indicator and sensitive to contaminants, espe- cially insecticides. Their population densities are an example of the high productivity of wetlands and the health of this ecosys- tem in particular. In addition, the absence of an herbaceous layer indicated a healthy ecosystem at this site. Table 10 pro- vides the data collected at this site.
Results
A follow-up study was conducted to seek evidence for class- room transfer. Was teacher efficacy in conducting field studies increased sufficiently for their students to experience field studies during the school year? Data was collected via a nine-item
Table 10.
Data collected by teachers at Long Key State Park.
Data recorded Observed organisms
July 20, 2006 24˚, 48' and 43"N 80˚, 49' and 21"W 3' above sea level Water temperature: 80˚F Salinity: 36 ppt pH: 8.2 DO: 5.6
Heavy metals: 300 ppb
Soil sample taken 20 meters from waters’ edge; 10 cm horizon Soil color: light gray, pinkish white with crushed coral
No microbes present Soil pH: 8
Soil Composition: 28% sand, 6% silt, 66% clay
Spider lily Red mangrove Black mangrove White mangrove Blue heron Great egret Cormorant Brown pelican Sea urchin Mosquito Sand fiddler crab
anonymous survey sent after the subsequent school year. Eight teachers responded (a 50% response rate). The first three questions collected discreet data:
About how many field-based lessons or activities did you use in your classroom that you experienced during the field course?
About how many times did you take students outside during the school day in order for them to conduct authentic re-search?
About how many times did you organize a field trip beyond the school day for them to make observations in nature or collect data?
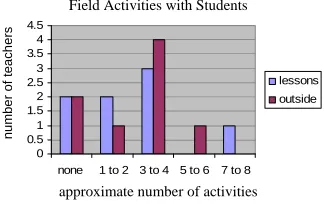
All but two teachers reported using field-based lessons or ac-tivities experienced during the field course in their classes the following year. One reported using 7 - 8 lessons or activities, but the mode (3 teachers) was 3 - 4. Six teachers reported tak-ing their students outside durtak-ing the school day in order for them to conduct authentic research. One reported taking stu-dents outside 5 - 6 times, but the mode (4 teachers) was 3 - 4. Only one teacher organized a field trip that extended beyond the school day in order for his or her students to make observa- tions in nature or collect data. Figure 2 shows the data in graphical form. A list of the lessons reported as being used by teachers the following year is provided in Table 11.
The survey included four open-response items. These in-cluded:
1) What were the impediments you faced in implementing any of these activities?
2) How did your understanding about science or appreciation of science change as a result of participating in the field course?
3) What experience(s) in the field course did you find most (4. least) valuable? Why?
In response to question number 1, almost all teachers re-ported the typical and expected impediments: time constraints; class periods too short for outside activities; uncooperative colleagues; and unwilling superintendents either due to testing or liability issues. Sadly, one teacher tried very hard, but even-tually was prevented from taking students on a field trip:
[image:5.595.56.287.336.519.2]Field Activities with Students
0 0.5 1 1.5 2 2.5 3 3.5 4 4.5
none 1 to 2 3 to 4 5 to 6 7 to 8
n
u
m
b
er
o
f t
e
ach
e
r
lessons outside
nu
mbe
r of
tea
ch
e
rs
[image:6.595.93.255.87.189.2]approximate number of activities
Figure 2.
[image:6.595.59.286.263.340.2]Field lessons conducted with students the follow-ing year as reported by teachers.
Table 11.
Field lessons or activities used during the following school year as reported by teachers.
Biosphere in a bottle Insect ecology
Using dichotomous keys Campus ecology
Water-testing techniques Chromatography with local plants
Collecting microorganisms Leaf collection and identification
Developing observation skills Identifying organisms
in my 7th grade science classes. The trip was cancelled by the School Board due to safety concerns.
Only one teacher stated that keeping students on task was a major impediment to conducting field activities. In response to question number 2, one teacher stated that the field course sim-ply affirmed his or her understanding or appreciation of science. Most responses, however, fell into two categories. One teacher gave responses that included both categories. Representing one category, five teachers thought that being able to transmit first-hand knowledge of the ecosystems in Florida to their stu-dents helped them be more effective teachers. A response of this nature included:
The individual research topics led to a greater understand-ing of data collection and record keepunderstand-ing that I now share with my students. As a result, my students are more able to develop their own research area and communicate their findings with greater ease.
Representative of the second category, four teachers spoke of a better understanding of ecology as a science because of the field course. Two such responses follow:
(I have) more understanding about the interrelationships of animals in a habitat, especially in the Everglades. I now see the alligator as not only a predator but as behaviorally the reason the Everglades work as they do as a habitat and migration sanctuary for such a diversity of animals.
The main change that I had was concerning the amazing work being done in Florida on conservation efforts for all of the sites that we visited. Often we only hear of the problems without much mention of the scientific creativity involved in solving them.
Each teacher gave detailed responses to question number 3. One noted that snorkeling in the Dry Tortugas was the most valuable experience in the field course. Two teachers reported that the opportunity to work both independently and coopera-tively was the most valuable experience. Another referred to this indirectly when providing this response:
The most valuable to me was watching our instructor keep us
focused, while allowing us to organize and carry out our field study work. I have often failed at getting the point across to high school students when collecting and analyzing data from field work.
The remaining four stated that the opportunity to actually experience nature and conduct field studies was the most valu-able experience. One such response follows:
I feel the hands-on experiments we conducted as well as the
“up close and personal” experiences with the wildlife and plant life enabled me to bring those experiences—along with a re-newed enthusiasm to my classroom […] these experiences will help me to be more comfortable conducting similar activities with my students.
In response to the final question, seven of the eight respon-dents stated that there were no invaluable experiences. How-ever, one teacher talked about the group report as the least valuable experience:
I don’t recall any wasted moments except a tiny bit of frus-tration when making a group report on our findings. But hey,
this was still very valuable in learning to cope!
Conclusion
Both students and teachers demonstrated enthusiasm and en-hanced understandings of the nature of science during their field trips. For the Writing in the Sciences class, students ac-commodated their research for a variety of audiences, showing how local environmental concerns impact the immediate com-munity, but also connecting their research to environmental problems around the globe. In all classes, GLOBE participants demonstrated increased knowledge of ecology, natural histories of various organisms, and awareness of environmental re-sources. For the teacher in-service class, a study conducted the following summer revealed that teachers valued the course and felt that their experiences helped them be more effective teach-ers. Six of the eight teachers conducted field activities with their students the following year, but also reported significant challenges associated with the effort. In the current environ-ment of high-stakes testing, the time and effort required to conduct field studies is often used to justify the absence of au-thentic field-based learning. At the same time, critical environ-mental issues are finally being recognized across the nation. The GLOBE program is a resource that enables students to investigate their local environmental, while situating their ex-perience within a global network of research.
REFERENCES
Beck, J. L., Connelly, J. W., & Reese, K. P. (2009). Recovery of greater sage-grouse habitat features in Wyoming big sagebrush following prescribed fire. Restorations Ecology,1, 393-403.
doi:10.1111/j.1526-100X.2008.00380.x
Comer, C. E., Bell, A. L., Oswald, B. P., & Conway, W. C. (2011). Vegetation and avian response to prescribed fire on glade habitats in the Missouri Ozarks. American Midland Naturalist, 165, 91-104. doi:10.1674/0003-0031-165.1.91
Florida Parks Services (2007). Manatee springs state park. http://www.abfla.com/parks/manateeSprings/manateesprings.html Jenkins, J. C. et al. (2003). National scale biomass estimators for
United States tree species. Forest Science, 49, 12-35.
National Park Services (2007). Everglades National Park. http://www.nps.gov/ever.html
National Research Council (1996). National science education stan- dards. Washington DC: National Academy Press.
National Science Foundation (2007). Revolutionizing science and en- gineering through cyberinfrastructure: Report of the national science foundation blue ribbon advisory panel on cyberinfrastructure. http://www.nsf.gov/od/oci/reports/toc.jsp
Peters, G., & Sala, A. (2008). Reproductive output of ponderosa pine in
response to thinning and prescribed burning in western Montana. Canadian Journal of Forest Research, 38, 844-850.
doi:10.1139/X07-203
The GLOBE Program (2007). http://www.GLOBE.gov/