warwick.ac.uk/lib-publications
Original citation:Wang, Zhongnan, Chetwynd, D. G. and Mao, Ken. (2017) Friction characteristics of polymers applicable to small-scale devices. Tribology International .
Permanent WRAP URL:
http://wrap.warwick.ac.uk/96860
Copyright and reuse:
The Warwick Research Archive Portal (WRAP) makes this work by researchers of the University of Warwick available open access under the following conditions. Copyright © and all moral rights to the version of the paper presented here belong to the individual author(s) and/or other copyright owners. To the extent reasonable and practicable the material made available in WRAP has been checked for eligibility before being made available.
Copies of full items can be used for personal research or study, educational, or not-for-profit purposes without prior permission or charge. Provided that the authors, title and full
bibliographic details are credited, a hyperlink and/or URL is given for the original metadata page and the content is not changed in any way.
Publisher’s statement:
© 2017. This manuscript version is made available under the CC-BY-NC-ND 4.0 license
http://creativecommons.org/licenses/by-nc-nd/4.0/
A note on versions:
The version presented here may differ from the published version or, version of record, if you wish to cite this item you are advised to consult the publisher’s version. Please see the ‘permanent WRAP URL’ above for details on accessing the published version and note that access may require a subscription.
Accepted Manuscript
Friction characteristics of polymers applicable to small-scale devices
Zhongnan Wang, Derek G. Chetwynd, Ken Mao
PII: S0301-679X(17)30550-9
DOI: 10.1016/j.triboint.2017.11.036
Reference: JTRI 4976
To appear in: Tribology International
Received Date: 9 August 2017 Revised Date: 21 November 2017 Accepted Date: 21 November 2017
Please cite this article as: Wang Z, Chetwynd DG, Mao K, Friction characteristics of polymers applicable to small-scale devices, Tribology International (2018), doi: 10.1016/j.triboint.2017.11.036.
M
AN
US
CR
IP
T
AC
CE
PT
ED
ACCEPTED MANUSCRIPT
1
Friction Characteristics of Polymers Applicable to Small-scale Devices
Zhongnan Wang
*, Derek G Chetwynd, Ken Mao
School of Engineering, University of Warwick, Coventry, CV4 7AL, UK
ABSTRACT:
A review of the critical features of a published micro-tribometer design, which was intended to improve on the dynamic response of typical commercial instruments, leads to its use with a modified technique. Data post-processing is introduced to partially compensate for some potential systematic errors. This approach is demonstrated by a preliminary study of the coefficient of friction (CoF) in sub-mm length reciprocating sliding motion for samples of polytetrafluoroethylene (PTFE) and an R11 acrylic formulation made by micro-stereo-lithography, with an SiO2-coated silicon wafer used as a control sample. Testing covered normal loads in the region of 10 mN to 60 mN, at scan frequencies up to 9 Hz, corresponding to sliding speeds in the broad region of 1 mm s-1. While the control samples closely adhered to Amonton’s laws over all the test parameter ranges, the CoFs of the two polymers showed contrasting patterns of dependence on sliding speed and repetition rate. Such results have implications for how polymers might be used effectively in future designs for small mechanical systems. They indicate a clear need for further development of the testing methods and large-scale studies of tribological behaviour and its underlying mechanisms under the specified micro-scale conditions.
Keywords: Polymer, Reciprocating, Micro-scale friction, Small-scale devices
1. Introduction
There are continuing drives towards greater miniaturization, covering small macroscopic devices as well as true micro-electromechanical systems (MEMS), across many engineering disciplines, ranging from aerospace to medical implants. This, in turn, increases concerns over tribological behaviour when the contact area and normal load (or applied force) become very small in production devices that involve sliding motion1,2,3; it is, for example, widely reported that Amonton’s laws tend to describe observed behaviour less well in the sub-N load regime4,5. Designers presumably wish to exploit new 3D microfabrication techniques (to meet increasing requirements to create high-aspect-ratio microstructures) and high-precision types of additive manufacture (AM, also called direct digital manufacturing, DDM), most notably
*corresponding author.
E-mail address: [email protected]
micro-stereolithography (MSL). These techniques bring the prospects, or even consequent necessity, of using new materials, but a lack of good data on properties known to be representative in the intended operational regime has caused wide concerns and inhibited progress.
MSL almost always uses the additive
M
AN
US
CR
IP
T
AC
CE
PT
ED
ACCEPTED MANUSCRIPT
2
polymers commonly used in MSL. General concerns about close adherence to Amonton’s laws might be assumed greater for polymers than for other classes of materials because of their specific surface chemistry (including, but not only, adsorbed films) and their thermal behaviour. On the latter, it is known from conventional tribology (e.g., for gears) that the thermal modelling of polymer systems is a crucial aspect of
successful designs7. Reasons include the low
conductivity, low thermal diffusivity and relatively low softening temperature that mean the typical tribology of the practical situations can differ importantly from that measured in static or low-speed test conditions, where
near-equilibrium with ambient conditions is
maintained. Furthermore, polymer properties might be significantly different in small mechanisms to those reported under the thermal conditions of conventional tribo-testing. In the case of MSL materials, tests need to be carried out at nominal contact areas and forces not too dissimilar from those of the intended applications, implying the use of micro- or nano-tribometers. However, commercial micro-tribometers tend to have limited dynamic bandwidths. Consequent slow testing might allow the surface at the point of contact always to be close to equilibrium with ambient conditions, whereas oscillatory behaviour in real life could regularly involve returning to specific positions before equilibrium is reached. For such reasons Alsoufi8 developed and demonstrated practically a prototype custom-design of micro-tribometer that is more robust and has improved dynamic response compared to commercial ones, at the cost of a more restricted operational range. It has the same concepts for operating principles and layout, but exploits a cantilever spring system considerably stiffer than usual
for friction force detection, together with
continually-controlled force actuators, to provide higher resonant frequencies. The new design can be applied
flexibly in ball-on-flat and crossed-cylinders
configurations for micro-friction measurement with control of critical friction-related test conditions such as sliding velocity, scan length and applied forces in the vertical and lateral directions.
Several tribological test methods and specialized micro-tribometers have been proposed and adopted for the analysis of the friction mechanisms of polymeric
materials intended for micro-systems applications, hoping thereby to establish some design rules for their application. There is, though, urgent need for investigations at higher surface sliding speeds and oscillatory rates over short scans and, more generally, to provide usable data relating to commonly-used MSL base resins, such as R11 acrylic. This paper presents preliminary experimental work as a step towards addressing these practical concerns.
2. Background to a new approach
In practice, the majority of tribological data has to be obtained or inferred from fairly general-purpose instruments that may not readily simulate the operating conditions of a specific application. Currently, most commercial and self-developed micro-tribometers are self-contained to offer a variety of sample motion mechanisms and mechanical configurations aimed at different functions, but they cannot approach the conditions found in many small-scale mechanical applications or typical MEMS. A major reason for this is that the imposition of small normal loads and, even more so, the measurement of small friction forces almost inevitably depend on the use of elastic elements in combination with displacement sensors. To obtain sufficient resolution of the forces using the practically accessible levels of reliable displacement resolution implies low stiffness in the reference and support springs. Consequently, the instruments have low
primary resonant frequencies. High-resolution
commercial instruments based on low stiffness sensing elements can only deliver measurements at low speed and with poor dynamic response, be they standard micro/nano-tribometer designs or based on AFM9. This restriction might not matter all that much for hard, high melting temperature materials that have tended to be used in MEMS. However, the prospects for using softer polymeric materials, such as PTFE or acrylic-based R11 resins often used with MSL, also raise questions about new needs to study their tribology under conditions that at least approach rather more closely the dynamic ones likely in small-scale applications.
M
AN
US
CR
IP
T
AC
CE
PT
ED
ACCEPTED MANUSCRIPT
3
dominated by configurations of pin-on-disc (contact with the disc periphery) or ball-on-flat (contact on the face of the disc) with a continuous rotary main motion. The resulting constant speed, uni-directional sliding is often advantageous. However, small mechanical devices are much more likely to involve short-range reciprocating sliding with a very small nominal contact area. The later can be reasonably simulated for small loads by using adequately small radii in ball-on-flat configuration, which is the default condition on most micro-tribometers. It is, though, plausible that a sliding cross-roller set-up may sometimes be better for conformity and, e.g., the ease of assessing coatings: see, for example, references [10, 11] for illustrative examples. Most micro-tribometry is based on reciprocating sample modes, but largely because of compromises when seeking stable metrology loops rather than to simulate specific functions. For similar reasons it is normally the sample that is scanned, although it is plausible to apply a reciprocating
counter-body (pin)12. Note, in passing, that
reciprocating cross-roller schemes are rarely used in conventional practice, except for special cases such as studying fretting wear in wire ropes and tyre reinforcements13 or in large transportation systems14. There have been bespoke attempts to match measurements to reciprocating applications; for example, Kosinskiy15 in 2012 demonstrated a set-up intended closely to simulate the operation of the
nano-positioning stage of a vacuum-based
nano-measuring machine. However, the instrument resonances still imposed major constraints on the frequency of reciprocating scans.
Drawing on similar arguments, Alsoufi proposed and undertook preliminary evaluation of a bespoke tribometer intended to provide better dynamic measurements by means of its higher than typical resonant frequencies8,16. Its main novelty was in using a single relatively stiff sense-beam that acted in both the normal load and friction force axes. However, this introduced new challenges; for example, in the micro regime, the CoF is often sensitive to load and thus the variation in the set force is highly undesirable during
the friction and wear measurements17. Any
displacements in the load axis during scanning caused by residual sample misalignment, shape deviations and
so on introduce greater variations from the nominal load as the stiffness of the sensing beam is increased. The new design therefore included electromechanical systems to provide some active, real-time compensation for the forces. Further relevant details are given in Section 3.
This paper revisits Alsoufi’s approach, with a few modifications to the method, and presents results of comparisons of friction force measurements under very similar conditions between a typical R11 acrylic resin on an MSL-generated surface, PTFE and, as a control, a SiO2-coated silicon wafer. The regime of study covered short-range oscillatory motions with variation of the applied normal force (10-60 mN), track length (66-130 µm) and scanning frequency (3-9 Hz). The higher
instrument resonance increases confidence in
measurement quality, although the work reported here runs only to around 10 Hz, a few times faster than most alternatives. It provides further information about the method, supplies some preliminary data about poorly documented cases of polymeric materials performance in miniature systems and gives indications of where further refinement and study might be focused.
3. Test-rig design and characterization
The experimental studies in this paper were performed using a rebuilt version of Alsoufi’s original custom-design tribotester8. The system is designed to work equally well with small ball-on-flat or sliding cross-roller configurations. Its modular design allows use with many types of scan in various physical orientations, with short-range reciprocating scan mode considered the primary one. This paper concerns the use of reciprocating ball-on-flat sliding and so summarizes only the critical features of the micro-tribometer for this type of operation.
M
AN
US
CR
IP
T
AC
CE
PT
ED
ACCEPTED MANUSCRIPT
4
deflects the spring will have significant influence on the nominal normal force applied. Two sets of solenoid
coils and hard permanent magnets provide
high-compliance force actuation (effectively
moving-magnet ‘voice-coil’ drives) in both the normal force and counter-body lateral force (or position) axes during the friction measurement. Two unshielded non-contact eddy-current sensors are placed about 0.3 mm from target flats on the sample holder to measure the vertical (i.e., along the normal force axis) and lateral deflections of the sensing beam from its rest position. The lateral sensor can be used passively to determine friction force simply by knowing the beam deflection and stiffness, but the combinations of the sensors and force actuators allows several closed-loop active control strategies to be implemented to improve accuracy and compensate for the undesirable dynamic effects of the sensing-beam stiffness. Eddy-current sensors were chosen, rather than, say, capacitive ones, because they are relatively inexpensive, offer fairly good resolution, and are easy to incorporate and interface. Also, it is the best choice when the application involves a dirty or hostile environment, as the magnetic fields are not affected by nonconductive contaminants such as dust, water, and oil. Thus, its output is not affected if such contaminants enter the area between the sensor and the target. A rigid block at the free end of the sensing beam carries the magnets for the lateral and transverse force actuators, provides flat target surfaces for the two eddy-current sensors, and accepts interchangeable small holders for sample counter-faces. The latter will typically be (mm-scale) balls but could also be short lengths of (mm-diameter) cylinders.
The second major subsystem is a sub-micrometre precision translation device to provide (nominally horizontal and sinusoidal) small-displacement sample motion for the reciprocating scan mode at scan repetition rates of up to some tens of hertz. It is based around a single degree of freedom notch-hinge flexure mechanism, machined monolithically from aluminium alloy. The mechanism platform can accept standard scanning electron microscope specimen ‘stubs’ for easy and rapid interchangeability of small flat or cylindrical samples and so provide ball-on-flat or crossed-cylinders configurations in combination with appropriate sample
counter-faces. A magnet-coil force actuator, similar to but considerably larger than those in the measuring head, provides a well-controlled stroke profile by imposing forces much larger than those expected from sample friction to drive against the notch-hinge stiffness in both forwards and backwards directions. An
AR200-6 M non-contact laser-triangulation
displacement sensor monitors track length and positional data along the scanning direction of the flexure platform and specimen.
Fig. 1. Schematic of the force sensing and control principles for the new
instrument (see Figure 2 for the overall layout). B – force sensing cantilever beam, stainless steel approximately 50 mm by 2 mm diameter; E – end block; C – interchangeable counterface holder; D – sensors for normal and lateral displacements; M – permanent magnets for normal and lateral force actuators; S – oscillatory scan and lateral force direction. The solenoid coils for the force actuators and outer reference frame are not shown.
Fig. 2. Photograph of the test set-up with the flexure-hinge scanning stage in the
foreground. The sensing head is mounted onto an x-y-z fine adjuster and a long-range vertical slide (in the background). The counterface and end-block are in the centre of the picture, surrounded by two eddy-current sensors and two actuator coils, while the sense beam is hidden beneath the outer structure.
Attempting to work at higher scanning rates than commercial systems so that individual points on the
sample experience frictional dissipation more
frequently means, in practice, using considerably higher (lowest) natural frequencies in the sensing system, which, in turn, implies a stiffer spring for the force sensing. New challenges are thereby introduced, such
D
D
C E
M
S
B
M
AN
US
CR
IP
T
AC
CE
PT
ED
ACCEPTED MANUSCRIPT
5
as the need for higher resolution displacement measurements to achieve the same resolution of force measurement and the possibility of inducing dynamic ‘error’ force components that might not be negligible compared to the desired normal load. Extra complexity of the beam sensors and actuators is a consequence. Models for both the linear flexure mechanism (scanner) and the sense beam can be realistically reduced to simple spring-mass-damper systems. The scanner was driven directly by a sinusoidal input from a power oscillator. In the planned experiments, the anticipated friction forces (no more than a few tens of mN) will have little effect on the position of the relatively stiff flexure stage and no significant effect on the scan consistency. The sample scan may be considered adequately as a sinusoid at the set frequency. The sense beam will be driven laterally by the induced friction force at the same fundamental frequency as the scan but will not be sinusoidal. In the ideal (Amonton’s law) case it would approach a rectangular waveform always opposing motion and so phased-shifted π/2 from the scan and introducing harmonics that increase the need for high instrument resonances in order to get reliable measurements. Moreover, the beam may be driven vertically by parasitic motion from imperfect alignment of the scanner/sample that will be sinusoidal at the scan frequency for first-order (tilt) misalignments; other effects, such as sample waviness, can produce higher harmonics. The stiff sense beam ensures sufficiently high natural frequencies and also a deflection under friction that is small compared to the (quite short) scan distance. The effects of parasitic motion can be reduced by a simple control strategy (implemented in software) that modulates the force in the vertical actuator according to any change of displacement at the vertical sensor during scanning.
The new test-rig has incorporated many of the components originally used by Alsoufi8,16, for which the major operational parameters had been shown suitable for the present micro-friction measurements. Table 1 summarises the most important calibration factors, including displacement sensor sensitivity, sensing beam stiffness, and the useful ranges (in the current configuration) for the force actuator and applied normal load, and main scan stage. The system was installed in a controlled environment at nominally 22 ± 1˚C and 40
± 5% relative humidity. The displacement sensors were calibrated against a Renishaw laser interferometer, which is excessive in terms of required sensitivity but convenient for non-contact measurement of small targets. Then, the stiffnesses were established by
dead-weight loading and using the internal
displacement sensors after orienting the systems such that the required axis was vertical. The force actuators were calibrated from measured displacements of the free-hanging sense beam and the relevant stiffness. The lowest important resonances are associated with the bending of the sense-beam and are not given explicitly because they will depend on the overall mass of the end-block plus the particular counter-face being used. Typically, they are somewhat above 100 Hz in both vertical and lateral directions.
Table 1
Major calibration factors for the test-rig
Displacement sensitivity
Sense beam stiffness
Force actuator and applied normal load
Notch-hinge mechanisms
Lateral:
48.6 µm/V
Vertical:
42.2 µm/V
kx:
2760 N/m
kz:
2690 N/m
Driving Voltage:
0 - 2.5 V
Load FN:
0 - 60 mN
Frequency f:
1.5 - 15 Hz
Displacement L:
7 - 420 µm
4. Specific experimental procedures
Materials: For the current set of micro-friction
experiments, the counterbody was consistently a 1 mm diameter ball made from stainless steel AISI 440C (grade 10). The main-body materials were nominally 10 mm square and flat samples of SiO2-coated silicon wafer, PTFE coated onto an aluminium base and an R11 resin that might be found in micro-mechanical systems. The silicon wafer was a typical commercial product (type: N<100>P), 525 µm thick with silicon dioxide coating deposited on it to a thickness of approximately 320 nm. Because optical microscopy was used initially to assess surface topographic quality, the PTFE sample had been coated with a gold layer of 30 nm thickness due to its low reflectivity. The acrylic-based R11 specimens used a custom-functional resin formulation from Envisiontec and were fabricated
by an Envisiontec Perfactory SXGA+
M
AN
US
CR
IP
T
AC
CE
PT
ED
ACCEPTED MANUSCRIPT
6
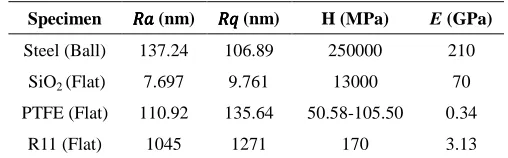
MSL system commonly used for fabricating robust and durable parts such as micro-actuators18,19, medical parts, and small parts in automobile applications20. The resin and its processing are claimed to offer superior fatigue strength properties and excellent tolerance to a broad temperature and humidity environment during and after build, excellent chemical resistance and a good balance of properties between rigidity and functionality20. While the experiments reported here are considered mainly as preliminary scoping studies to assess methods and correlate frictional behaviour across the sample materials, the measurements on R11 acrylic resin also contribute new design-relevant data; micromechanical data on these materials is relative scarce and quite variable. Table 2 summarizes the initially hardness, roughness and elastic modulus of the steel ball and main-body materials (SiO2, PTFE, R11).
Table 2
Condition data of steel ball and main-body materials
Specimen (nm) (nm) H (MPa) E (GPa)
Steel (Ball) 137.24 106.89 250000 210
SiO2 (Flat) 7.697 9.761 13000 70
PTFE (Flat) 110.92 135.64 50.58-105.50 0.34
R11 (Flat) 1045 1271 170 3.13
Methods: In every test, the whole of the
measuring head was lowered until the counter-body first came to gently touch the surface of the specimen by observing the onset of vertical deflection of the sensing-beam. The spring force associated with this small beam deflection was backed off by applying a small signal to the transverse force actuator according to the residual deflection and beam spring constant, leading to a starting situation that could be considered a ‘zero-force’ contact. Set (nominal) normal loads were applied incrementally through the transverse force actuator. Then, the specimen reciprocating traverse was started by applying a specified voltage to the flexure stage driver, reading its steady-state condition for oscillation stroke length and time after allowing a very brief period of stabilization. A specified number of cycles of the sensor signals was recorded by means of a USB data acquisition card and a custom-written LabVIEW program. Finally, the mechanism stage was stopped, and the counter-body lifted to complete the
test cycle. Prior to each measurement, samples and tips were cleaned gently with isopropanol on a cotton-bud and then blow-dried with clean air, to ensure that any influence on the results from naturally adsorbed contaminant films would remain small and consistent. After the cleaning procedures, all the tests were carried out in a controlled environment at nominally 22 ± 1˚C and 40 ± 5% relative humidity.
Ball-on-flat configurations were used to
investigate the variations of friction force and CoF for the polymeric and control materials against specified variations in normal force, track length and scan frequency under reciprocating dry sliding conditions where there are no applied lubricants. Sliding speed was a secondary parameter, derived straightforwardly from track length and scan rate. Friction force at each nominal set load was measured as half the peak-to-peak lateral deflection (after smoothing high-frequency noise) of the sense beam scaled by its stiffness; this effectively differences the deflections under forwards
and backwards motions to largely eliminate
zero-position uncertainty that might arise from the initial contact. Normal load was taken as the primary independent variable in each test, with length and frequency changed between sets of tests. The whole sequence for every test was repeated three times at different “new” locations on the sample surface, as parallel tracks approximately 200 µm from the previous one. This provided some additional data reliability through averaging (while keeping the overall time of
each test short enough to avoid significant
environmental drift) and avoided the risk of outlier measurements from the influence of debris or other local wear effects.
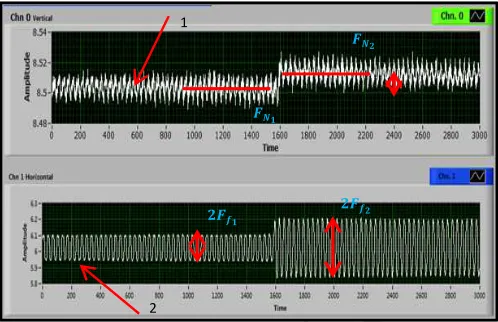
Real-time recorded signal: Figure 3 shows a
[image:8.595.33.287.354.433.2]M
AN
US
CR
IP
T
AC
CE
PT
ED
ACCEPTED MANUSCRIPT
7
occurs since it would probably change the material and properties of surface layers relevant at this scale. More generally, there was no directly visible surface damage in these tests; although simple Hertzian contact models suggest maximum pressures of the order of the materials’ strengths, the very localized surface behaviour supports these loads, as is also seen with stylus probes for topography measurement.
The example in Figure 3 is for a reciprocating scan at 3 Hz with a track length of 66 µm and a maximum sliding speed of 600 µm/s. The approximately 0.015 V step in the mean level for the second half of Curve 1 corresponds to a vertical position change of about 0.65 µm. As the sense beam moved, about 1.7 mN of the nominal applied force was shunted into deflecting the beam against its stiffness because the actual contact point varied little. Thus, the actual normal load steps up to only 46.17 mN. The corresponding friction forces are 4.72 mN and 18.05 mN; further detail on their calculation is given below.
Fig. 3. Si/SiO2 sample of signal measured by the reciprocating micro-tribometer for the friction vs. load experiments: 1. normal load signal and 2. friction signal
The signals for normal load and friction force are almost periodic, with the latter approaching a rectangular waveform and a much smaller amplitude noisy near-sinusoid dominating the vertical deflection. The output signal shows some evidence of dynamic
linking between channels: residual specimen
misalignment driving the sensing beam accounts for most of it, with perhaps a small element of sensor cross-talk. For such sources, the use of the mean value is acceptable. Other noise was more readily distinguished when the sensing beam was hanging free, with random features and more sinusoidal variations of
period close to 20 ms and perhaps some small harmonic components, as well as provides the possibility of using its arithmetic mean value as a datum for the calculation of the normal loads, before the tip is in touch with the specimen surface. The fundamental resonance of the sensing beam is considerably higher than 50 Hz, so this signal is attributed directly to interference deriving from the main electrical supply. This noise represents a lower limit on real parameter changes that can be detected in the present environment. The rms amplitude in Curve 1 is around 0.07 V, but less than 0.05 V is conservatively attributable to noise, corresponding to resolutions of about 0.25 µm and 0.7 mN. The averaging and smoothing used in practice improves the resolution statistically; the degree of improvement will vary from situation to situation, but a worst case is conservatively estimated at 0.3 mN.
Data point analysis of friction force: Friction force is calculated using Matlab software from the height difference between the relatively level top and bottom regions of the curves of the lateral deflections of the sensing beam ∆x collected from Labview software.
The first 2-5 cycles at the start of the trace are ignored to avoid uncertainty from sources such as contaminated specimen surfaces or scanning-stage transients. Then, in order to check for any instrument inconsistencies or data trends from friction heating, unexpectedly wear and so on, sub-sections of the signal were evaluated independently.
The individual nominally flat top and bottom sections of the signal will inevitably contain some measurement noise and, in practice, exhibit a transient overshoot when the signal changes sense. The former can be legitimately averaged, but including transient regions would introduce potential bias. There might also be some slow drift. In a preliminary trial, three calculation methods were explored for measurements taken at loads and speeds high in the working range. In the first, all points (other than those clearly on transition edges) across the whole signal (sequence) were included. Secondly, only points from the middle part of each top and bottom were used, so avoiding data from potential overshoot regions, with evaluation over the whole sequence. Then, the method used in the second trial was applied over sets of just 10 successive
[image:9.595.43.292.375.536.2]M
AN
US
CR
IP
T
AC
CE
PT
ED
ACCEPTED MANUSCRIPT
8cycles selected from the near the start and the end of the whole trace.
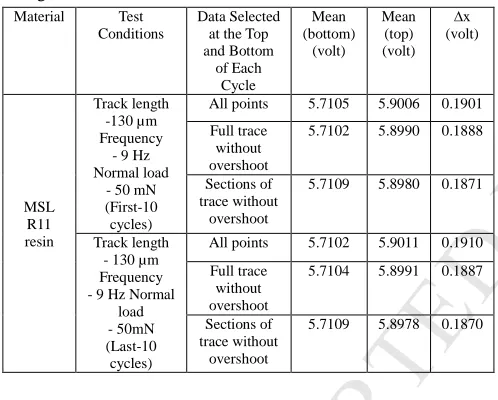
Table 3 shows a comparison of the calculated average voltage of the lateral deflection for R11 resin at the largest loads, longest length and highest sliding frequency for these different analyses.
The variations in the mean differences calculated by these three methods are small, but there is remarkable consistency in the results where overshoots have been removed but the full trace used. Consequently, this approach is used in all the analyses, expecting it likely to give the best precision by providing the greatest degree of averaging as protection against any occurrence of larger noise spikes.
Table 3
Comparison of the data point analysis of the calculated average
voltage of the lateral deflection for R11 resin.
Material Test Conditions
Data Selected at the Top and Bottom of Each Cycle Mean (bottom) (volt) Mean (top) (volt) ∆x (volt) MSL R11 resin Track length -130 µm Frequency
- 9 Hz Normal load
- 50 mN (First-10 cycles)
All points 5.7105 5.9006 0.1901
Full trace without overshoot
5.7102 5.8990 0.1888
Sections of trace without
overshoot
5.7109 5.8980 0.1871
Track length - 130 µm Frequency - 9 Hz Normal
load - 50mN (Last-10 cycles)
All points 5.7102 5.9011 0.1910
Full trace without overshoot
5.7104 5.8991 0.1887
Sections of trace without
overshoot
5.7109 5.8978 0.1870
Post-processing: Microtribology methods tend to
face challenges in establishing initial ‘contact’ between the sample and counterbody in a satisfactory, reliable way. The assumed zero force at initial contact can be vulnerable to unintended displacements (arising, e.g., from sensor resolution or drift) that then cause slight offsets in the actual normal forces applied during tests compared to those nominally applied. The load offset arises as such displacement errors act against an effective spring constant of the counterbody suspension (or load beam). Given its stiffer design, the present instrument and technique might be rather more vulnerable to load offsets that are many others. These effects should be small when using the instruments in their proper range of operation, but residual systematic effects can lead to non-linear errors when studying such
things as variations of friction coefficient at very small normal loads. Careful setting up to reduce the offset is the only fully effective solution, because interactions can be complex and difficult to predict when the friction coefficient is itself varying with normal force. Nevertheless, controlling to the required level is difficult and so a method of partial compensation by post-processing the measurement data is proposed and used here.
In essence, the proposed method exploits a linear co-ordinate transformation of the data. It depends upon, and so is only valid if, a plot of friction force against normal load can be represented reasonably well by its best-fit straight line. This will often be the case over limited ranges even for conditions where the CoF is not fully independent of load and its validity can be tested in terms of a high value for the correlation coefficient of the least-squares line as an effective measure of the goodness of fit. Generally, we anticipate that the actually applied load will be slightly offset from the nominally applied load by an amount that will not change significantly over the course of one set of measurements. Simply computing point values for the
CoF as = / introduces an error having a larger
[image:10.595.42.292.317.521.2] [image:10.595.42.291.320.520.2]M
AN
US
CR
IP
T
AC
CE
PT
ED
ACCEPTED MANUSCRIPT
9
adjusting the friction force values against the intercept in their axis, but this alternative is not valid in practice. The friction force values arise from a differencing process and so do not have the same vulnerability to a static offset. The post-processing is demonstrated in Section 5.
5. Results and discussion
5.1 Variations of friction with normal load at a constant scan rate
The experimental method described was used to examine how friction force and CoF varied with normal loads in the region of 10 mN to 60 mN when tests were run at the same scan rate of 9 Hz over track lengths of 66 µm, 90 µm and 130 µm. Assuming the scans remain sinusoidal, the average sliding speeds were about 1.2 mm s-1, 1.6 mm s-1 and 2.3 mm s-1, respectively; the corresponding maximum speeds were about 1.9 mm s-1, 2.5 mm s-1 and 3.7 mm s-1.
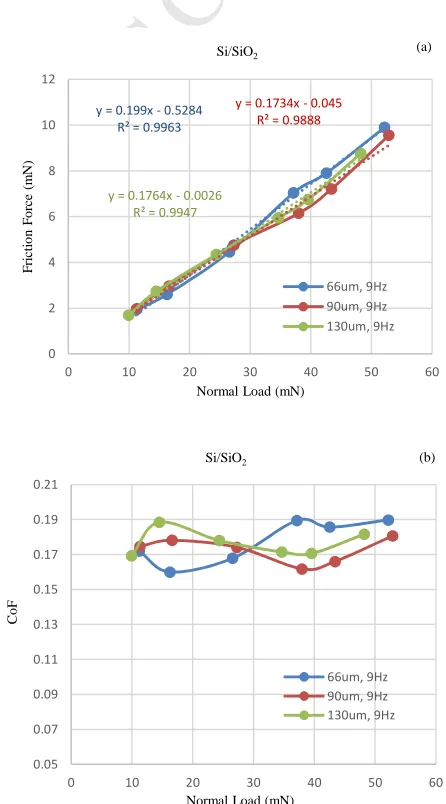
Figure 4(a) shows the variations of friction force with nominally applied normal load for an Si/SiO2 sample, which is used as a control to confirm the process, being a material highly relevant to MEMS applications but harder and less thermally sensitive than the polymers. Error bars are not given on the experimental graphs, to avoid confusion, but across all the cases reported here 95% confidence intervals on forces are estimated (see previous discussion) at 0.3 mN, with consequent values for CoF of 0.01. There is no visible, experimentally significant deviation from the straight-line relationship predicted by Amonton’s laws21, with the least squares best fit lines always showing the goodness of fit parameter at close to or above 0.99. Figure 4(b) plots against nominal load (i.e., ) the point-values for the CoF (i.e., ), computed from the nominal load. Simply comparing the graphs to the experimental fluctuations seen in them indicates that there is no evidence here that the CoF varies with load or with track length in the current test ranges. However, nearly all the individual points plotted lie at CoF values a little smaller than the average values obtained from the least squares fits, which suggests an experimental error. As all the indicative conditions were favourable, the data was then post-processed using the procedure described in Section 4. Figure 5 shows the modified results, plotted
against the ‘compensated’ values for normal loads ( ) with point-values of CoF now computed using compensated loads (i.e., ). Comparing to Figure 4, there are small but visible differences in the details of these plots. The values for CoF are a little higher and are now distributed in a plausible manner about the relevant averages. The conclusion remains, though, that there is no evidence for systematic variation in the CoF, which at around 0.2 is consistent with general
expectations. Having demonstrated that the
compensation scheme operates sensibly and
[image:11.595.316.539.284.686.2]beneficially, and noting that none of the data sets obtained varied grossly from the patterns seen in Figure 4, only plots of CoF against compensated normal load will be discussed explicitly in the rest of this paper.
Fig. 4. Variations of friction force (a) and CoF (b) with nominal normal load for
an Si/SiO2 specimen when scanning at 9 Hz over track lengths of 66 µm, 90 µm and 130 µm
y = 0.199x - 0.5284 R² = 0.9963
y = 0.1734x - 0.045 R² = 0.9888
y = 0.1764x - 0.0026 R² = 0.9947
0 2 4 6 8 10 12
0 10 20 30 40 50 60
F
ri
ct
io
n
F
or
ce
(
m
N
)
Normal Load (mN) Si/SiO2
66um, 9Hz 90um, 9Hz 130um, 9Hz
(a)
0.05 0.07 0.09 0.11 0.13 0.15 0.17 0.19 0.21
0 10 20 30 40 50 60
C
oF
Normal Load (mN) Si/SiO2
66um, 9Hz 90um, 9Hz 130um, 9Hz
M
AN
US
CR
IP
T
AC
CE
PT
ED
ACCEPTED MANUSCRIPT
10Fig. 5. Variations of friction force (a) and CoF (b) with ‘corrected’ normal load
for an Si/SiO2 specimen when scanning at 9 Hz over track lengths of 66 µm, 90 µm and 130 µm.
The graphs of CoF against normal load for a PTFE specimen shown in Figure 6 follow very similar trends to those for Si/SiO2. The friction force (not shown) rose almost linearly with normal load from roughly 1 mN to 8 mN, with the best-fit lines again showing R2 at above 0.99 and a similar small offset term when plotted against nominal load. The CoF is seen to fluctuate within the range 0.12 to 0.15, with each trace varying around an average derived for the best-fit slope to the relevant graph. These values are a little higher than commonly quoted for macroscopic systems, but not inconsistent with the literature relevant to mN range loads on small contacts. There is so evidence for trends compared to these fluctuations and so the CoF for these PTFE samples appears to be independent of normal load and track length under these test conditions. This is a little surprising because most literature reports an
asymptotically decreasing trend of CoF with
sub-newton loads9,22,23,24. On the other hand, these measurements cover only a limited range of loads and the measured CoFs are a little above the typical for conventional tests, so the results are not necessarily inconsistent with expectations.
Fig. 6. Variations of CoF with (corrected) normal load for a PTFE specimen
when scanning at 9 Hz over track lengths of 66 µm, 90 µm and 130 µm.
Fig. 7. Variations of friction force with ‘corrected’ normal load for an R11
[image:12.595.322.528.144.300.2]specimen when scanning at 9 Hz over track lengths of 66 µm, 90 µm and 130 µm.
Fig. 8. Variations of CoF with (corrected) normal load for an R11 specimen when
scanning at 9 Hz over track lengths of 66 µm, 90 µm and 130 µm.
The behaviour of R11 under the same conditions is y = 0.1999x - 0.7778
R² = 0.9964
y = 0.1735x - 0.2226 R² = 0.9888
y = 0.1764x - 0.1793 R² = 0.9947
0 2 4 6 8 10 12
0 10 20 30 40 50 60
F ri ct io n F or ce ( m N )
Normal Load (mN) Si/SiO2 66um, 9Hz 90um, 9Hz 130um, 9Hz (a) 0 0.02 0.04 0.06 0.08 0.1 0.12 0.14 0.16 0.18 0.2 0.22 0.24
0 10 20 30 40 50 60
C
oF
Normal Load (mN) Si/SiO2 66um, 9Hz 90um, 9Hz 130um, 9Hz (b) 0 0.02 0.04 0.06 0.08 0.1 0.12 0.14 0.16
0 20 40 60
C
oF
Normal Load (mN) PTFE
66um, 9Hz 90um, 9Hz 130um, 9Hz
y = 0.2149x - 0.0001 R² = 0.9953
y = 0.191x + 1E-05 R² = 0.9988
y = 0.1775x + 9E-06 R² = 0.9985
0 2 4 6 8 10 12
0 10 20 30 40 50 60
F ri ct io n F or ce ( m N )
Normal Load (mN) MSL R11 Resin
66um, 9Hz 90um, 9Hz 130um, 9Hz 0 0.05 0.1 0.15 0.2 0.25
0 10 20 30 40 50 60
C
oF
Normal Load (mN) R11
[image:12.595.324.525.565.705.2]M
AN
US
CR
IP
T
AC
CE
PT
ED
ACCEPTED MANUSCRIPT
11
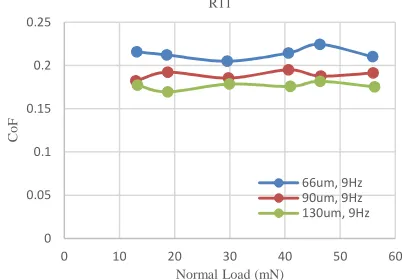
a little different, as shown in Figure 7. The variation of friction force (again in the range of about 2 mN to 10 mN) with normal load is still well represented by a straight line, with R2 > 0.99 and a slight offset is again seen, but the slopes of the best-fit lines for the three track lengths were visibly different. This is emphasised in Figure 8, where there is a clear vertical separation of the graphs for CoF of the same order as the point-to-point fluctuations within them. The separations at any one value of normal load might have limited significance relative to the measurement uncertainties, but the consistency of the order across all normal load values provides reasonable confidence that this is a real phenomenon. There is no evidence for CoF being dependent on normal load in this test regime. It is not at all obvious why track length should directly affect the CoF, so the driver for this variation is likely to be the changing sliding speed. Using the slopes of the linear fits to the graphs of friction force against normal load as estimates of an average value, the CoF of R11 reduces from 0.215 at an average sliding speed of 1.2 mm s-1 to 0.178 at 2.3 mm s-1.
5.2 Variations of friction with normal load at a constant track length
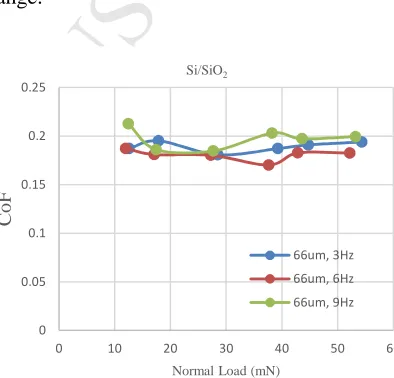
Figures 9 to 11 plot experimental results for the CoFs of same set of materials against normal loads (after post-process compensation) in the region of 10 mN to 60 mN when tested under reciprocating motion over the same track length of 66 µm at scan rates of 3 Hz, 6 Hz and 9 Hz. The corresponding average sliding speeds were about 0.4 mm s-1, 0.8 mm s-1 and 1.2 mm s-1, respectively; the maximum speeds were about 0.6 mm s-1, 1.2 mm s-1 and 1.9 mm s-1. Many of the general features in these measurements are similar to those for Figures 5, 6, 7 and 8, discussed in more detail above. In all cases the relationship between friction force and load was well represented by a least-squares straight line (at R2>0.99), indicating reasonably close adherence to Amonton’s laws across this range of normal loads.
The Si/SiO2 sample (Figure 9) shows behaviour virtually indistinguishable from that in the constant scan rate tests, with CoF fluctuating for individual measurements in the region 0.17 to 0.22 and showing no trends considered to be significant compared to
these fluctuations. There is here no evidence that the CoF depends functionally on any of the parameters investigated over the ranges considered. In contrast, Figure 10 shows that the behaviour of the PTFE is a somewhat different under these test conditions. The slopes of the friction force graphs were readily distinguished visually and there is a very clear separation between the graphs of CoF. The separations at individual loads are typically larger (within the same order) than the fluctuations within the traces and so their consistent separation over all measurements is likely to be experimentally significant. The trace at 9 Hz in Figure 10 corresponds to that at 66 µm in Figure 6, with the CoF at slower scan rates being lower, varying in the region of 0.11 at 6 Hz and 0.09 at 3 Hz. There was no evidence of CoF varying normal load in this range.
Fig. 9. Variations of CoF with (corrected) normal load for an Si/SiO2 specimen when scanning at 3 Hz, 6 Hz and 9 Hz along a track length of 66 µm
Fig. 10. Variations of CoF with (corrected) normal load for a PTFE specimen
when scanning at 3 Hz, 6 Hz and 9 Hz along a track length of 66 µm
There were also visually distinguishable slopes in
0 0.05 0.1 0.15 0.2 0.25
0 10 20 30 40 50 60
C
o
F
Normal Load (mN) Si/SiO2
66um, 3Hz 66um, 6Hz 66um, 9Hz
0 0.02 0.04 0.06 0.08 0.1 0.12 0.14 0.16
0 20 40 60
C
oF
Normal Load (mN) PTFE
[image:13.595.330.527.302.491.2] [image:13.595.327.533.540.706.2]M
AN
US
CR
IP
T
AC
CE
PT
ED
ACCEPTED MANUSCRIPT
12
the plots of friction force against normal load for the R11 sample, with corresponding shifts in the overall levels of the CoFs plotted in Figure 11. Based on the same arguments used with Figure 9, the difference in average value are likely to be experimentally significant. The CoF is higher in the constant track length tests, rising to around 0.3 at a scan rate of 3 Hz, which is also the slowest sliding speed used across any of the tests. Again, there is no reliable evidence to suggest a variation of CoF with normal load within this test regime.
Fig. 11. Variations of CoF with (corrected) normal load for an R11 specimen
when scanning at 3 Hz, 6 Hz and 9 Hz along a track length of 66 µm.
5.3 Overall observations
Comparing the data from the two sets of tests, above, strengthens several observations from these first experiments. Firstly, the high level of consistency of results for Si/SiO2 across all test conditions fulfils the role of this sample as a control and adds confidence that changes observed with other samples are not merely artefacts of the measurement technique. This material is harder, does not suffer from low softening temperatures and has better thermal diffusivity than the polymer specimens and so would be expected to be less sensitive to sliding speed and scan rate effects in the test ranges considered here.
Secondly, none of the individual tests provides even weak evidence that CoF depends on normal load when using the present method, despite most of the literature reporting a tendency for it to reduce as normal load increases in the mN range. The reasons are not clear, perhaps especially as Alsoufi [8] noted a quite strong decrease in the CoF of PTFE to values a little
lower than usually seen when using a test-rig similar to the current one. Analysis of more detailed data on that work [16] suggests that the best-fit lines had offsets of the type discussed here. Hence, one speculation might be that subsequent systematic errors in point-value CoFs could distort the graphs against nominal load by introducing decreasing trends that could have amplified any real effect. However, the results here suggest that any such systematic errors would cause only small, even if noticeable, distortions of real trends and are unlikely to be the full explanation. For example, comparing Figures 4(b) and 5(b) there is possibly a hint
of a rising trend that disappears after the
post-processing of the data. It is very unlikely that any artificially induced rising trend caused by the presence or processing of offset effects is masking a real downward one in the present work. The patterns are too consistent over different set-ups and different materials for there to be reasonable chances that two independent effects more or less cancel every time.
Fig. 12. Variation of average CoF over the range of loads examined for an R11
specimen against average sliding speed
The CoF for the R11 resin sample shows a clear, consistent trend across Figures 11 and 8. The underlying controlling factor appears to be sliding speed; the level of consistency across the two sets of tests makes direct dependence on scan rate less likely. Using the slope of the plots of friction force against normal load as a single-value estimate across the range of interest, the CoF is 0.293 at an average sliding speed at 0.4 mm s-1, dropping to 0.215 at 1.2 mm s-1 and 0.178 at 2.3 mm s-1. The trend, plotted in Figure 12, is distinctly non-linear with speed and plausibly appears to be asymptotic at higher speed. The observed 0
0.05 0.1 0.15 0.2 0.25 0.3 0.35
0 10 20 30 40 50 60
C
oF
Normal Load (mN) R11
66um, 3Hz
66um, 6Hz
66um, 9Hz
0.293
0.234 0.215
0.191 0.178
0 0.05 0.1 0.15 0.2 0.25 0.3 0.35
0 0.5 1 1.5 2 2.5
C
oF
Average Sliding Speed (mm/s) R11 Resin
[image:14.595.316.534.360.537.2]M
AN
US
CR
IP
T
AC
CE
PT
ED
ACCEPTED MANUSCRIPT
13
behaviour is exactly opposite to the suggested argument that, for this type of polymer, frictional heating would be greater overall at higher speeds and greater locally at faster scan rates, with any softening caused by local heating then leading to greater adhesion and increasing friction. It is clearly worthy of further investigation. One possible explanation, which could not be checked within the present test method, relates to the presence of adsorbed layers causing behaviour similar to that seen in some load-speed regions of boundary lubrication.
Figures 6 and 10 indicate a different probable source for the sensitivity of the CoF of the PTFE sample. The value appears to rise as the sliding speed increases, opposite in sense to the effect seen with R11. However, while the slight hint of a rise across the results at a constant scan rate of 9 Hz could be interpreted as part of a consistent trend, there is really no experimentally significant variation in CoF across all the results shown in Figure 6. It is therefore more likely that it is the scan rate itself rather than the sliding speed that determines the behaviour. Slower rates lead to lower CoF, with the 3 Hz scan here reporting values typical of those widely quoted for PTFE. More frequent changes of direction could lead to higher average CoF along short tracks, a relationship broadly compatible with the widely-held opinion that PTFE is best used as a bearing material for unidirectional (or longer range) sliding. For example, the possible formation (and later disturbance) of fibrils at the sliding interface might affect CoF locally when direction reverses, leading to higher average values on fast, short scans.
6. Conclusions
A previously proposed design for a
micro-tribometer measuring head, which involves an unusually stiff sensing beam in order to increase dynamic range, has been revisited, slightly modified and used with a revised technique. In particular, a post-process compensation is proposed and shown to be helpful; although based on patterns within measurement data sets that will not be valid in all situations, it might well have wider applicability.
The system was used in a reciprocating ball-on-flat configuration to investigate friction force and CoF under dry sliding conditions for silicon-based
and polymeric materials at normal loads in the region of 10 mN to 60 mN. Tests covered three different scan lengths (66 µm, 90 µm and 130 µm) and three different scan frequencies (3 Hz, 6 Hz and 9 Hz). The experimental results showed that the CoF for the surface of an oxide-coated silicon wafer was independent of all the set parameters. Amonton’s law held well over the ranges studied for this fairly hard material, used here as a control sample for comparing the behaviour of polymeric materials. In contrast, this first study measured CoFs for PTFE and R11 acrylic samples that deviated from Amonton’s laws in different ways. No significant dependence on normal load was detected over the range tested, whereas a decline with increasing load might have been expected from a reading of generic literature. However, the average CoF for PTFE increased as the scan repetition rate increased, while that for R11 decreased as average sliding speed increased. It was expected that thermo-mechanical properties could play a larger role in the behaviour of the polymer, but simple arguments about softening do not seem to explain these patterns. Changes in surface structures might well be a significant factor, but larger-scale tests in more sophisticated configurations are needed to clarify such issues.
This work has highlighted the need for caution in applying micro-tribometry techniques intended to measure at faster speeds than commercially available ones. It also provides evidence of frictional behaviours in short-range reciprocating motion that could be significant for the wider use of polymers in future generations of miniature mechanisms and MEMS. There is clear benefit in undertaking further studies in this regime and extending it to a wider range of forces
and speeds. Further developments in the
instrumentation and research into a wider range of polymer formulations are both essential to this larger programme of future work.
References
[1] Bhushan B. Nanotribology and nanomechanics. Wear 2005; 259:1507-1531.
[2] Kim SH, Asay DB, Dugger MT. Nanotribology and MEMS. Nanotoday 2007; 2: 22-29.
M
AN
US
CR
IP
T
AC
CE
PT
ED
ACCEPTED MANUSCRIPT
14
bio-tribology. Materials Science & Engineering R-Reports 2007; 58: 162-193.
[4] Corwin D and Boer MPD. Effect of adhesion on
dynamic and static friction in surface
micromachining. Applied Physics Letters 2004; 84: 2451-2453.
[5] Tichy JA, Meyer DM. Review of solid mechanics in tribology. International Journal of Solids and Structures 2000; 37: 391-400.
[6] Bertsch A, Jiguets S, Bernhard P, Renaud P. Micro-stereo-lithography: a review. In: Mater Res Soc Symp Proc, 2003. p. 758: LL1.1.1–LL1.1.13. [7] Myshkin NK, Petrokovets MI, Kovalev AV.
Tribology of polymers: Adhesion, friction, wear, and mass-transfer. Tribology International 2005; 38: 910-921.
[8] Chetwynd DG, Alsoufi MS. A novel micro-friction
measuring-head using force-feedback
compensation. In: SPIE; 2010. p. 754417-9. [9] Miller BP, Theodore ND, Brukman MJ, Wahl KJ,
Krim J. A Nano- to Macroscale Tribological Study of PFTS and TCP Lubricants for Si MEMS Applications. Tribol Lett 2010; 38(1): 69-78. [10] Hasegawa T. Tribology Research Trends. 1st ed.
New York: Nova Science Publishers; 2008.
[11] Buyanovskii, A. Tribological test methods and apparatus. Chemistry and Technology of Fuels and Oils 1994; 30: 133-147.
[12] Torbacke M, Rudolphi AK, Kassfeldt E.
Lubricants: Introduction to Properties and
Performance. 1st ed. Chichester: John Wiley & Sons Ltd; 2014.
[13] Cruzadoa A, Hartelt M, Wäsche R, Urchegui MA, Gómez X. Fretting wear of thin steel wires. Part 1: Influence of contact pressure. Wear 2010; 268: 1409-1416.
[14] Wasche R, Hartelt M. Wear testing with crossed cylinders - comparison of methods. In: Bartz WJ Editor. Proceedings of the 16th International Colloquium on Tribology, Ostfildern: Technische
Akademie Esslingen; 2008.
[15] Kosinskiy M, Ahmed SIU, LIU Y, Schaefer JA. A compact reciprocating vacuum microtribometer. Tribology International 2012; 56: 81–88.
[16] Alsoufi, MS. A High Dynamic Response Micro-tribometer Measuring-head [Ph.D. thesis]. University of Warwick, 2011
[17] Czichos H. Design of friction and wear experiments, in Friction, Lubrication, and Wear Technology. In: P.J. Blau editor. ASM Handbook; 1992. p. 18.
[18] King P, Covington JA. A novel monolithic microactuator fabricated by 3D rapid direct manufacture. In: Proceedings of Eurosensors XXIII conference, Procedia chemistry; 2009. p .1: 1163-1166.
[19] Leigh SJ, Purssell CP, Hutchins DA, Covington JA, Billson DR. A miniature flow sensor fabricated
by micro-stereolithography employing a
magnetite/acrylic nanocomposite resin. Sensors and Actuators A: Physical 2011; 168(1): 66-71. [20] Xu D, Chetwynd DG, Covington JA. A method for
tensile testing of delicate polymeric parts. In: Spaan H, et al., editors. Proc. 11th euspen International Conference; 2011. p. 1: 175-178. [21] Dowson D. History of tribology. 2nd ed. London:
Professional Engineering Publishers; 1998.
[22] Smith ST, Harb S, Eastwickfield V, Yao Z, Bartlett PN, Chetwynd DG, Gardner JW. Tribological Properties of Electroactive Polymeric Thin-film Bearings. Wear 1993; 169: 43-57.
[23] Myshkin NK, Petrokovets MI, Kovalev AV. Tribology of polymers: Adhesion, friction, wear, and mass-transfer. Tribology International 2005; 38: 910-921.
[24] Gerbig YB, Ahmed SIU, Chetwynd DG, Haefke H. Topography-related effects on the lubrication of
nanostructured hard surfaces. Tribology