Permanent WRAP URL:
http://wrap.warwick.ac.uk/130102
Copyright and reuse:
This thesis is made available online and is protected by original copyright. Please scroll down to view the document itself.
Please refer to the repository record for this item for information to help you to cite it. Our policy information is available from the repository home page.
For more information, please contact the WRAP Team at: [email protected]
High Resolution NMR Based Approaches for Facilitating Chromatography Method Development
by
Azzedine Abdelah Dabo
Thesis
Submitted to the University of Warwick
For the degree of
Doctor of Philosophy
Supervised by Józef R. Lewandowski and Prof. Melissa Hanna-Brown
Department of Chemistry
CONTENTS
LIST OF TABLES ... VII
LIST OF APPENDICES TABLES ... XI
LIST OF FIGURES ... XVII
LIST OF APPENDICES FIGURES ... XXIII
LIST OF STATISTICAL SCRIPT ... XXVI
ACKNOWLEDGEMENTS ... XXVII
DECLARATION ... XXVIII
ABSTRACT ... XXIX
LIST OF ABBREVIATIONS AND ACRONYMS ... XXX
1 INTRODUCTION ... 1
2 REVERSED PHASE HPLC ... 9
2.1THE ORIGIN OF CHROMATOGRAPHY ... 9
2.2HPLCCHROMATOGRAPHY PROCESS ... 11
2.3RP-HPLCRETENTION ... 14
2.4COLUMN DEAD-TIME (T0) AND RETENTION FACTOR (K) ... 15
2.5RP-HPLC RESOLUTION ... 17
2.5.1 Optimising the retention factor (k) ... 18
2.5.2 Optimising selectivity (a) ... 19
2.5.3 Optimizing the column plate number (N) ... 19
2.6HPLC EXPERIMENTAL PARAMETERS AND EFFECT ON SEPARATION ... 21
2.6.1 Mobile phase ... 21
2.6.2 Organic solvent strength ... 22
2.6.3 Column chemistry ... 23
2.6.4 Particle shape ... 25
2.6.5 Particle size ... 25
2.6.6 Pore size ... 26
2.6.7 Surface area ... 27
2.6.8 Pore volume ... 28
2.6.9 pH range ... 29
2.6.10 Mobile phase pH and buffer concentration ... 29
2.6.11 Endcapping ... 31
ii man & M or ga n 20 14
2.6.13 Surface Coverage (ligand density) ... 32
2.6.14 Temperature effect on retention ... 32
2.6.15 Temperature Limit ... 33
2.7INTERMOLECULAR INTERACTIONS ... 33
2.7.1 Dispersion interactions ... 34
2.7.2 Hydrophobic interactions ... 34
2.7.3 Dipole-dipole interactions ... 35
2.7.4 Hydrogen bonding ... 35
2.7.5 Ionic interactions ... 35
2.7.6 Charge transfer ... 36
2.7.7 Polar interactions ... 36
2.8RP-HPLC METHOD DEVELOPMENT ... 37
2.8.1 Assessment of sample properties and separation goals ... 37
2.8.2 Sample pre-treatment and preparation. ... 37
2.8.3 Selection of chromatography mode ... 38
2.8.4 Detector selection ... 38
2.8.5 Method validation ... 38
3 NUCLEAR MAGNETIC RESONANCE THEORY ... 39
3.1NUCLEI FUNDAMENTAL PROPERTIES ... 39
3.2NUCLEAR SPIN INTERACTIONS ... 42
3.2.1 Chemical Shift and chemical shift anisotropy ... 42
3.2.2 Dipole-Dipole Coupling ... 45
3.2.3 J-Coupling ... 46
3.2.4 Magic Angle Spinning ... 47
3.3NMREXPERIMENT ... 49
3.3.1 The vector model ... 49
3.3.2 Fourier Transform ... 56
3.3.3 Sensitivity in NMR ... 58
3.3.4 Two-Dimensional NMR ... 62
4 NUCLEAR MAGNETIC RESONANCE RELAXATION ... 65
4.1RELAXATION MECHANISMS ... 67
4.1.1 Dipolar coupling ... 68
4.1.2 Chemical shift anisotropy ... 68
4.2.1 Correlation time and correlation function ... 69
4.2.2 The spectral density ... 71
4.2.3 Motional regimes ... 73
4.3POPULATIONS ... 73
4.3.1 Z-magnetisation in terms of populations ... 73
4.3.2 Relaxation in terms of populations ... 75
4.4LONGITUDINAL (T1) RELAXATION ... 77
4.4.1 Measuring (T1) relaxation ... 78
4.5TRANSVERSE (T2) RELAXATION ... 81
4.5.1 Measuring T2 relaxation ... 82
4.6RELAXATION RATES IN THE FAST AND SLOW MOTIONAL REGIME ... 84
4.7LONGITUDINAL DIPOLAR RELAXATION OF TWO SPINS ... 86
4.7.1 Energy levels and transition rates ... 86
4.8CHEMICAL EXCHANGE ... 89
4.8.1 Slow chemical exchange ... 91
4.8.2 Very Slow chemical exchange ... 91
4.8.3 Slow to intermediate exchange: ... 92
4.8.4 Fast Chemical exchange ... 92
4.8.5 Differentiating fast and slow chemical exchange ... 93
5 1H HIGH RESOLUTION MAGIC ANGLE SPINNING RELAXATION METHOD DEVELOPMENT AND OPTIMISATION ... 95
5.1ABSTRACT ... 95
5.2INTRODUCTION ... 96
5.3EXPERIMENTAL ... 97
5.3.1 Materials ... 97
5.3.2 NMR Method ... 98
5.3.3 Inversion recovery ... 98
5.3.4 Saturation recovery ... 99
5.3.5 Transverse Relaxation (T2) Measurements CPMG pulse sequence ... 99
5.4RESULTS ... 99
5.4.1 NMR method compared to HPLC ... 99
5.4.2 Rotor sizes ... 101
5.4.3 Radio frequency (RF) pulse powers ... 101
iv man & M or ga n 20 14
5.4.5 Spinning frequency ... 103
5.4.6 Temperature dependence on relaxation ... 106
5.4.7 Analyte concentration dependence on 1H HR MAS NMR spectra ... 113
5.4.8 Dependence of 1H spectra on mobile phase ratio ... 115
5.4.9 1H relaxation dependence on organic solvent ... 117
5.4.10 Buffer effect on 1H relaxation ... 118
5.4.11 Analysing mixtures ... 119
5.4.12 Dependence of 1H spectra on analyte chemical and physical properties .. 119
5.4.13 DSS ... 121
5.4.14 Statistical analysis ... 122
5.5CONCLUSION ... 125
6 STRUCTURAL CHARACTERISATION OF ALIPHATIC CHAIN AND PHENYL BONDED SILICA RP HPLC STATIONARY PHASES ... 126
6.1ABSTRACT ... 126
6.2INTRODUCTION ... 127
6.3EXPERIMENTAL: ... 129
6.3.1 Samples ... 129
6.3.2 Atomic force microscopy method ... 130
6.3.3 Raman spectroscopy method ... 130
6.3.4 Solid State NMR method ... 131
6.4RESULTS AND DISCUSSION ... 131
6.4.1 Atomic force microscopy ... 131
6.4.2 Raman spectroscopy ... 133
6.4.3 NMR spectroscopy ... 137
6.5CONCLUSION ... 142
7 NMR RELAXATION APPROACHES FOR PROBING RP-HPLC MOLECULAR INTERACTIONS ... 144
7.1ABSTRACT ... 144
7.2INTRODUCTION ... 144
7.3EXPERIMENTAL METHODS ... 149
7.4MATERIALS ... 149
7.5HPLCMETHOD ... 149
7.6NMRMETHOD ... 150
7.8CPMG(T2)MEASUREMENTS ... 151
7.9RESULTS AND DISCUSSION ... 152
7.10CHEMICAL EXCHANGE REGIMES FOR ANALYTES BINDING TRANSIENTLY TO STATIONARY PHASES ... 152
7.11NMR RELAXATION AS A PROBING OF MOLECULAR MOTIONS ... 156
7.12APPLICATION OF 1HT1 RELAXATION TIMES TO PROBE ANALYTE INTERACTIONS 156 7.13APPLICATION OF 1HT2 RELAXATION TIMES TO PROBE ANALYTE INTERACTIONS 159 7.14ESTIMATION OF 1HT2 FROM PEAK WIDTH AT HALF HEIGHT ... 159
7.151HT2 RELAXATION MEASURED USING CPMG ... 162
7.16CHEMICAL EXCHANGE ... 167
7.17COMBINED APPLICATION OF 1HT1 AND T2TO PROBE ANALYTE INTERACTIONS .. 169
7.18CONCLUSION ... 172
8 PROBING THE INTERMOLECULAR INTERACTIONS IN RP-HPLC BY NMR RELAXATION ... 174
8.1ABSTRACT ... 174
8.2INTRODUCTION ... 174
8.3EXPERIMENTAL METHODS ... 176
8.3.1 HPLC Methods ... 179
8.3.2 NMR Methods ... 179
8.4RESULTS AND DISCUSSION ... 180
8.4.1 T1, T2 weighted average against retention time ... 181
8.4.2 Toluene ... 182
8.4.3 Naphthalene ... 184
8.4.4 Acenaphthene ... 185
8.4.5 Benzophenone ... 187
8.4.6 Biphenyl ... 188
8.4.7 Butyl 4-Hydroxybenzoate ... 189
8.4.8 Dipropyl phthalate ... 192
8.4.9 Benzoic acid and 3-hydroxybenzoic acid. ... 193
8.4.10 Meclizine, hydroxyzine, propranolol and amitriptyline ... 194
8.4.11 Aniline and 2-aminophenol ... 195
8.5CONCLUSION ... 195
vi man &
M
or
ga
n
20
14
9.1ABSTRACT ... 197
9.2INTRODUCTION ... 197
9.3EXPERIMENTAL METHODS ... 200
9.3.1 HPLC method ... 200
9.4RESULTS ... 201
9.4.1 Toluene ... 202
9.4.2 Naphthalene ... 203
9.4.3 Acenaphthene ... 204
9.4.4 Benzophenone ... 205
9.4.5 Biphenyl ... 206
9.4.6 Butyl 4-Hydroxybenzoate ... 208
9.4.7 Dipropyl phthalate ... 209
9.4.8 Benzoic acid and 3-hydroxybenzoic acid. ... 210
9.4.9 Aniline and 2-aminophenol. ... 213
9.4.10 Meclizine, hydroxyzine, propranolol and amitriptyline ... 215
9.5CONCLUSION ... 216
10 SUMMARY ... 219
11 REFERENCES ... 226
12 APPENDICES: TABLES ... 252
13 APPENDICES: FIGURES ... 279
List of Tables
Table 1.1. Experimental conditions that affect HPLC separation. ... 3
Table 2.1. Effect of different experimental conditions on the retention (k), selectivity (a) and column efficiency (N)[104]. ... 22
Table 2.2. Commonly used RP-HPLC stationary phases with hydrophobicity properties. ... 24
Table 2.3. Commonly used buffers in RP-HPLC. Adapted from [1] ... 31
Table 2.4. Solvent selectivity characteristics. ... 36
Table 3.1. Nuclear properties of nuclei investigated in this study. ... 59
Table 4.1. The effect of chemical exchange (at different regime) on the characteristics of the NMR spectrum observed. ... 90
Table 5.1. Comparison of NMR and HPLC experimental conditions ... 100
Table 5.2. Statistical summary (T1 and T2 relaxation) of aniline in the presence of BEH-C18 measured on different times of the day. Where mean: average of the relaxation values, SD: the standard deviation, SEM: standard error of the mean and P Value: the paired t-test score. The SD and SEM was calculated from the aromatic protons of aniline ... 123
Table 5.3. Standard errors of aniline (T1 and T2 relaxation) in the presence of BEH-C18 stationary phase. ... 124
Table 6.1. Physical and chemical properties of commercially available RP-HPLC stationary phases. ... 130
Table 6.2. Band assignments of C-C stretching, C-H bending and C-H stretching for saturated hydrocarbons[318-321]. ... 136
Table 6.3. Band assignments of C-C stretching, C-H bending and C-H stretching for mono-substituted hydrocarbons[318-321] ... 136
Table 6.4. 29Si peak identities and area percentage distributions. ... 141
Table 8.1. Chemical and physical properties of 15 analytes investigated in this study. ... 177
Table 8.2. RP-HPLC stationary phase selectivity parameters[370] ... 178
Table 8.3. 1H T1 and T2 relaxation times for toluene in 50:50 % v/v MeCN:D2O (from top to bottom according to HPLC elution order): mobile phase in the absence of stationary phase (solution only) and in the presence of BEH-C18, BEH-phenyl, BEH-RP18, CSH hexyl-phenyl and HSS T3 stationary phases. Data were obtained at 500 MHz spectrometer at 313 K and 5.0 kHz spinning frequency. ... 182
Table 8.4. 1H T1 and T2 relaxation times for toluene in 50:50 % v/v MeOH:D2O (from top to bottom according to HPLC elution order): mobile phase in the absence of stationary phase (solution only) and in the presence of BEH-C18, BEH-phenyl, BEH-RP18, CSH hexyl-phenyl and HSS T3 stationary phases. Data were obtained at 500 MHz spectrometer at 313 K and 5.0 kHz spinning frequency. ... 183
viii man & M or ga n 20 14
the presence of BEH-C18, BEH-phenyl, BEH-RP18, CSH hexyl-phenyl and HSS T3 stationary phases. Data were obtained at 500 MHz spectrometer at 313 K and 5.0 kHz spinning frequency. ... 184 Table 8.7. 1H T1 and T2 relaxation times for naphthalene in 50:50 % v/v MeOH:D2O (from top to bottom according to HPLC elution order): mobile phase in the absence of stationary phase (solution only) and in the presence of BEH-C18, BEH-phenyl, BEH-RP18, CSH hexyl-phenyl and HSS T3 stationary phases. Data were obtained at 500 MHz spectrometer at 313 K and 5.0 kHz spinning frequency. ... 185 Table 8.8. RP-HPLC stationary phase selectivity parameters[370] ... 185 Table 8.9. 1H T1 and T2 relaxation times for acenaphthene in 50:50 % v/v MeCN:D2O (from top to bottom according to HPLC elution order): mobile phase in the absence of stationary phase (solution only) and in the presence of BEH-C18, BEH-phenyl, BEH-RP18, CSH hexyl-phenyl and HSS T3 stationary phases. Data were obtained at 500 MHz spectrometer at 313 K and 5.0 kHz spinning frequency. ... 186 Table 8.10. 1H T1 and T2 relaxation times for benzophenone in 50:50 % v/v MeCN:D2O (from top to bottom according to HPLC elution order): mobile phase in the absence of stationary phase (solution only) and in the presence of BEH-C18, BEH-phenyl, BEH-RP18, CSH hexyl-phenyl and HSS T3 stationary phases. Data were obtained at 500 MHz spectrometer at 313 K and 5.0 kHz spinning frequency. ... 187 Table 8.11. 1H T1 and T2 relaxation times for benzophenone in 50:50 % v/v MeOH:D2O (from top to bottom according to HPLC elution order): mobile phase in the absence of stationary phase (solution only) and in the presence of BEH-C18, BEH-phenyl, BEH-RP18, CSH hexyl-phenyl and HSS T3 stationary phases. Data were obtained at 500 MHz spectrometer at 313 K and 5.0 kHz spinning frequency. ... 188 Table 8.12. 1H T1 and T2 relaxation times for biphenyl in 50:50 % v/v MeCN:D2O (from top to bottom according to HPLC elution order): mobile phase in the absence of stationary phase (solution only) and in the presence of BEH-C18, BEH-phenyl, BEH-RP18, CSH hexyl-phenyl and HSS T3 stationary phases. Data were obtained at 500 MHz spectrometer at 313 K and 5.0 kHz spinning frequency. ... 189 Table 8.13. 1H T1 and T2 relaxation times for biphenyl in 50:50 % v/v MeOH:D2O (from top to bottom according to HPLC elution order): mobile phase in the absence of stationary phase (solution only) and in the presence of BEH-C18, BEH-phenyl, BEH-RP18, CSH hexyl-phenyl and HSS T3 stationary phases. Data were obtained at 500 MHz spectrometer at 313 K and 5.0 kHz spinning frequency. ... 189 Table 8.14. 1H T1 and T2 relaxation times for butyl 4-hydroxybenzoate in 50:50 % v/v MeCN:D2O (from top to bottom according to HPLC elution order): mobile phase in the absence of stationary phase (solution only) and in the presence of BEH-C18, BEH-phenyl, BEH-RP18, CSH hexyl-phenyl and HSS T3 stationary phases. Data were obtained at 500 MHz spectrometer at 313 K and 5.0 kHz spinning frequency. ... 190 Table 8.15. 1H T1 and T2 relaxation times for butyl 4-hydroxybenzoate in 50:50 % v/v MeOH:D2O (from top to bottom according to HPLC elution order): mobile phase in the absence of stationary phase (solution only) and in the presence of BEH-C18, BEH-phenyl, BEH-RP18, CSH hexyl-phenyl and HSS T3 stationary phases. Data were obtained at 500 MHz spectrometer at 313 K and 5.0 kHz spinning
x man & M or ga n 20 14
List of Appendices Tables
xii man & M or ga n 20 14
Table A. 12 1H T1 and T2 relaxation times for biphenyl in 50:50 % v/v MeCN:D2O (from top to bottom according to HPLC elution order): mobile phase in the absence of stationary phase (solution only) and in the presence of BEH-C18, BEH-phenyl, BEH-RP18, CSH hexyl-phenyl and HSS T3 stationary phases. Data were obtained at 500 MHz spectrometer at 313 K and 5.0 kHz spinning frequency. ... 258 Table A. 13 1H T1 and T2 relaxation times for biphenyl in 50:50 % v/v MeOH:D2O (from top to bottom according to HPLC elution order): mobile phase in the absence of stationary phase (solution only) and in the presence of BEH-C18, BEH-phenyl, BEH-RP18, CSH hexyl-phenyl and HSS T3 stationary phases. Data were obtained at 500 MHz spectrometer at 313 K and 5.0 kHz spinning frequency. ... 259 Table A. 14 1H T1 and T2 relaxation times for butyl 4-hydroxybenzoate in 50:50 % v/v MeCN:D2O (from top to bottom according to HPLC elution order): mobile phase in the absence of stationary phase (solution only) and in the presence of BEH-C18, BEH-phenyl, BEH-RP18, CSH hexyl-phenyl and HSS T3 stationary phases. Data were obtained at 500 MHz spectrometer at 313 K and 5.0 kHz spinning
frequency. ... 259 Table A. 15 1H T1 and T2 relaxation times for butyl 4-hydroxybenzoate in 50:50 % v/v MeOH:D2O (from top to bottom according to HPLC elution order): mobile phase in the absence of stationary phase (solution only) and in the presence of BEH-C18, BEH-phenyl, BEH-RP18, CSH hexyl-phenyl and HSS T3 stationary phases. Data were obtained at 500 MHz spectrometer at 313 K and 5.0 kHz spinning
xiv man & M or ga n 20 14
xvi man &
M
or
ga
n
20
14
List of Figures
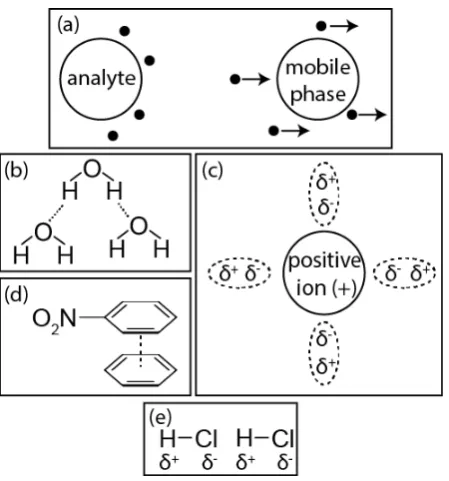
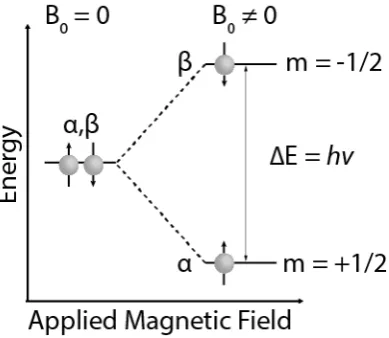
Figure 1.1. Steps followed in HPLC method development ... 1 Figure 2.1. Schematic of HPLC system ... 11 Figure 2.2. HPLC Column packed with porous particles. (a) Column packed with spherical particles, (b) schematic of an individual particle, showing an idealised pore with attached C18 chains, (c) picture of a spherical, porous particle, showing detail (10x expansion). Adapted from [104]. ... 12 Figure 2.3. SEM images of the 3.6 µm core-shell Aeris WP C18 (A) and 1.7 µm stationary phase BEH300 C18. Adapted from [130, 131]. ... 12 Figure 2.4. Modelled separation process in HPLC of a mobile phase (x), toluene ( ), naphthalene ( ) and biphenyl (•) with a corresponding chromatogram. ... 14 Figure 2.5. Illustration of the equilibrium distribution and migration rates of toluene ( ), naphthalene ( ) between a mobile phase and BEH-C18 stationary phase. ... 15 Figure 2.6. Illustration of hydrophobic interactions and hydrogen bonding interactions. ... 23 Figure 2.7. Structure illustration of (a) monomeric C18 and (b) polymeric C18 chromatography models illustrating the different ligand types. Adapted from [167]. ... 24 Figure 2.8. SEMs of (a) PXS PAC column and (b) Brownlee RP-18 column. Adapted from [168]. ... 25 Figure 2.9. Particle size distributions of 2.7 µm particles (very narrow distribution) compared to 3 µm totally porous particle. Adapted from [178, 181]. ... 26 Figure 2.10. Pore size distribution of various HPLC materials. Adapted from [177]. ... 27 Figure 2.11. Nitrogen adsorption isotherm: 1, adsorption branch: 2, desorption branch. Adapted from [177]. ... 28 Figure 2.12. Visualisation of HPLC intermolecular interactions such as (a) dispersion interactions, (b) hydrogen bonding, (c) ionic interactions, (d) charge transfer and (e) dipole-dipole interactions. ... 33 Figure 3.1. Two energy levels of single spin ½ nucleus with and without an applied magnetic field, B0. The spin up (α) and spin down (β) have an energy gap of ΔE = hv. ... 41 Figure 3.2. Visualisation of (a) chemical shift interaction, (b) direct dipole-dipole coupling and (c) indirect dipole-dipole coupling (J-coupling). The electrons are represented by the blue cloud. ... 42 Figure 3.3. Illustration of an NMR spectrum split into two lines. In (a) the magnetic field results in the two lines appearing at 100.0002 and 100.0003 respectively. The separation between the two peaks is 100 Hz. If the applied magnetic field is doubled as shown in (b) the frequency of each peak is doubled and so is the separation between them. ... 43 Figure 3.4. Illustration of chemical shift anisotropy powder pattern due to the random orientation of crystallites with respect to the applied field B0. Where (∆) is the shielding anisotropy, !"", !## and !$$ are the principal components of the chemical shielding tensor. ... 45 Figure 3.5. An illustration of the polar angles θ and ϕ which denotes the orientation of the I-S
xviii man & M or ga n 20 14
Figure 3.6. The magic angle spinning set up. The sample is packed in a cylindrical rotor which is spun rapidly about the spinning axis oriented at an angle θ with respect to the applied magnetic field B0. The magic angle (θ = 54.74°) removes both heteronuclear dipolar coupling and chemical shielding anisotropy interactions. ... 48 Figure 3.7. 1D 1H spectra of single dry seed of western white pine (a) static and (b) under 3 kHz magic angle spinning. Adapted from [230]. ... 49 Figure 3.8. Illustration of how bulk magnetisation reaches equilibrium. Initially with no applied magnetic field, each individual magnetic moment is randomly orientated (as shown on the left). At this point, no net magnetisation is formed. Once the magnetic field is applied (B0), the individual magnetic moments start to align with the field but it requires a certain amount time. When the field is first applied, no net bulk magnetisation is formed. After waiting for an adequate amount of time, more populated magnetic moment align to the applied field as shown on the right. As a result, a bulk magnetisation (M) is formed parallel to the applied field (z-axis). ... 51 Figure 3.9. Illustration of the effective field (Beff) in the rotating frame. Where Beff is sum of the B1 and ∆B and θ is the angle between the ∆B and Beff. ... 53 Figure 3.10. Graphical illustration of how the transverse bulk magnetisation is generated with time. Initially (from left to right) the bulk magnetisation is at equilibrium. A 90° anticlockwise pulse is applied about the x-axis (when a maximum measurable signal is obtained), this starts tilting the bulk
magnetisation away from the longitudinal plane axis (z-axis) and towards the transverse plane (xy-axis). After a while, the bulk magnetisation is fully transferred onto the transverse plane. ... 55 Figure 3.11. Illustration of (a) absorption and (b) dispersion Lorentzian line shapes due to Fourier transform of the decaying FID signal. ... 57 Figure 3.12. A cross polarization pulse sequence scheme. ... 60 Figure 3.13. Illustration of the energy splitting of 1H and 13C nuclei about the B0 and B1 field. Where the Larmor frequencies (energy difference) of both nuclei about the B0 are not equal. However, the Larmor frequencies of both nuclei about the B1 field are equal. Hence, Hartmann-Hann matching is achieved. .. 61 Figure 3.14. Graphical scheme of how 2D NMR data sets are recorded using the pulse sequence shown in Figure 3.16. A graphical scheme of a 2D NMR pulse sequence made up of a preparation, evolution (t1), mixing and detection time (t2). ... 62 Figure 3.15. Initially, t1 is set to zero, the sequence is executed and FID is digitized with regular
xx man & M or ga n 20 14
Figure 5.4. 500 MHz 1H HR-MAS NMR spectra of aniline in the presence of HSS T3 stationary phase at 313 K and (a) 0.0, (b) 2.0, (c) 4.0, (d) 5.0, (e) 8.0 and (f) 10.0 kHz spinning frequency. ... 104 Figure 5.5. 500 MHz 1H HR-MAS NMR spectra (aromatic protons) of aniline in the presence of HSS T3 stationary phase at 313 K and (a) 0.0, (b) 2.0, (c) 4.0, (d) 5.0, (e) 8.0 and (f) 10.0 kHz spinning frequency. Note: no signal is observed in the aromatic region of aniline at 0 kHz. ... 105 Figure 5.6. 500 MHz 1H HR-MAS weighted average T1 and T2 relaxation of aniline in the presence of BEH-C18 against varied spinning frequency (kHz). ... 106 Figure 5.7. 1D 1H HR-MAS NMR spectra of 0.5 M aniline in 50:50 % v/v of MeCN:D2O mobile phase (i) in the absence of stationary phases (solution only) and in the presence of either (ii) C18, or (iii) BEH-phenyl, or (iv) BEH-RP18, or (v) CSH hexyl-phenyl or (vi) HSS T3 stationary phases with varied
temperature of (a) 293, (b) 298, (c) 303, (d) 308 and (e) 313 K. All spectra were obtained at 500 MHz spectrometer with 5.0 kHz spinning frequency. ... 107 Figure 5.8. 1D 1H HR-MAS NMR spectra of 0.5 M aniline (aromatic region) in 50:50 % v/v of MeCN:D2O mobile phase (i) in the absence of stationary phases (solution only) and in the presence of either (ii) BEH-C18, or (iii) BEH-phenyl, or (iv) BEH-RP18, or (v) CSH hexyl-phenyl or (vi) HSS T3 stationary phases with varied temperature of (a) 293, (b) 298, (c) 303, (d) 308 and (e) 313 K. All spectra were obtained at 500 MHz spectrometer with 5.0 kHz spinning frequency. ... 108 Figure 5.9. 1D 1H HR-MAS NMR spectra of 0.5 M aniline (aromatic region) in 50:50 % v/v of MeCN:D2O mobile phase (i) in the absence of stationary phases (solution only) and in the presence of either (ii) BEH-C18, or (iii) BEH-phenyl, or (iv) BEH-RP18, or (v) CSH hexyl-phenyl or (vi) HSS T3 stationary phases. All spectra were obtained at 500 MHz spectrometer at 313 K and 5.0 kHz spinning frequency. ... 110 Figure 5.10. 500 MHz 1H HR-MAS T1 relaxation of aniline in (a) solution only, (b) BEH-C18, (c) BEH-phenyl, (d) BEH-RP18, (e) CSH hexyl-phenyl and (f) HSS T3 against varied temperatures of 293, 298, 303, 308 and 313 K. All spectra were obtained at 500 MHz spectrometer with 5.0 kHz spinning frequency. ... 111 Figure 5.11. 500 MHz 1H HR-MAS T2 relaxation of aniline in (a) solution only, (b) BEH-C18, (c) BEH-phenyl, (d) BEH-RP18, (e) CSH hexyl-phenyl and (f) HSS T3 against varied temperatures of 293, 298, 303, 308 and 313 K. ... 112 Figure 5.12. 1D 1H HR-MAS NMR spectra of aniline in 50:50 % v/v of MeCN:D2O mobile phase (i) in the absence of stationary phases (solution only) and in the presence of (ii) BEH-C18 with concentrations of (a) 0.25 M, (b) 0.50 M and (c) 1.00 M. All spectra were obtained at 500 MHz spectrometer at 313 K and 5.0 kHz spinning frequency. ... 114 Figure 5.13. 1D 1H HR-MAS NMR spectra of aniline (aromatic region) in 50:50 % v/v of MeCN:D2O mobile phase (i) in the absence of stationary phases (solution only) and in the presence of (ii) BEH-C18 with concentrations of (a) 0.25 M, (b) 0.50 M and (c) 1.00 M. All spectra were obtained at 500 MHz
spectrometer at 313 K and 5.0 kHz spinning frequency. ... 114 Figure 5.14. 1D 1H HR-MAS NMR spectra of aniline in (a) 50:50, (b) 70:30 and (c) 90:10 % v/v of
xxii man &
M
or
ga
n
20
14
List of Appendices Figures
xxiv man & M or ga n 20 14
xxvi man &
M
or
ga
n
20
14
List of Statistical Script
Acknowledgements
The work presented in this study was performed at the Department of Chemistry, University of Warwick, from September 2013 to August 2017. During this period, several people have contributed towards completing this project.
First, I want to say a big thank you to my supervisor, Dr Józef R. Lewandowski who provided me with endless amounts of help and his expertise in this area. He guided and motivated me during both difficult and enjoyable times. Without his support, passion and drive for NMR I wouldn’t have been able to complete this project and for this I will forever be grateful. Gratitude also goes to my second supervisor, Melissa Hannah Brown for her insightful discussions about HPLC chromatography. To Jonathan Lamley who kindly helped me throughout this project especially by showing me how to use the 500 MHz NMR spectrometer and deepening my understanding of Solid State NMR.
My Gratitude goes to James Hogbin, Sam Louis Young and Joshua Bucceri for their help and expertise in running the HPLC experiments in Pfizer. Special thanks to the Warwick University NMR group with whom I have made unforgettable memories throughout my time at Warwick, including the cake club. A big thank you to both Pfizer and EPSRC for funding this exciting project.
Many thanks to my brothers who supported and motivated me throughout this project. A very special thanks to my wife to be Amy Donegan and the one and only sister Saphora Dabo for helping me with my grammar and spelling. Finally, I am extremely grateful to my parents for their love and words of wisdom throughout my life.
xxviii man &
M
or
ga
n
20
14
Declaration
I hereby declare that this thesis High Resolution NMR Based Approaches for Facilitating Chromatography Method Development is an original work and has not been submitted for a diploma or degree at another university. This thesis has been composed by myself unless specifically acknowledged or referenced.
The research was conducted under the supervision of Dr Józef R. Lewandowski and Prof. Melissa Hanna-Brown at the University of Warwick and Pfizer between September 2013 to April 2017.
All the NMR results were obtained at the University of Warwick. The 13C and 29Si were
Abstract
Reversed-Phase High Performance Liquid Chromatography (RP-HPLC) is one of the most widely used techniques for provision of analytical measurement information in the pharmaceutical industry from discovery through to development, clinical and manufacturing analytical laboratories. The pharma industry has been for many years attempting to transform the efficiency of method development and increasingly attention has turned to using in silico methodologies. Pfizer have been at the forefront of developing streamlined workflows and more recently, models for retention time prediction so as to reduce the amount of experimental effort in method development. Many of the in-silico strategies used rely on calculated parameters of the molecules under investigation and to some extent the characteristics of the RP-HPLC stationary phases, but no models yet have captured any measures that capture any description of the multiple and complex analyte – stationary phase-mobile phase interactions within any one RP-HPLC method condition.
To accomplish this, 1H high resolution magic angle spinning (HR-MAS) nuclear
magnetic resonance (NMR) spin-lattice (T1) and spin-spin (T2) relaxation measurements were carried out to probe site-specific molecular motion of a series of aromatic compounds and reversed phase HPLC stationary phases in two different mobile phases. The NMR relaxation measurements provided insight about the nature of the site-specific interaction between the compounds with different stationary phases.
xxx man & M or ga n 20 14
List of Abbreviations and Acronyms
HPLC High Pressure Liquid Chromatography
RP-HPLC Reversed Phase High Pressure Liquid Chromatography
NP-HPLC Normal Phase HPLC
NMR Nuclear Magnetic Resonance
FT Fourier Transformed
MAS Magic Angle Spinning
CP Cross Polarization
HR High-Resolution
DOSY Diffusion-Ordered Spectroscopy
BEH Ethylene Bridged Hybrid
CSH Charged Surface Hybrid
HSS High Strength Silica
GC Gas Chromatography
MS Mass Spectrometer
tR Retention time
MP Mobile Phase
SP Stationary Phase
RF Radio Frequency
TMS Tetramethylsilane
DSS 4,4-Dimethyl-4-Silapentane-1-Sulfonic acid
CSA Chemical Shift Anisotropy
FID Free Induction Decay
2D Two Dimensional
HMBC Heteronuclear Multiple Bond Correlation NOESY Nuclear Overhauser Effect Spectroscopy
EXSY Exchange Spectroscopy
CPMG Carr-Purcell Meiboom-Gill
AFM Atomic Force Microscopy
MeCN Acetonitrile
1
I
NTRODUCTION
High pressure liquid chromatography (HPLC) is an analytical technique used to identify, quantify and separate compounds in a mixture. Over the years, HPLC has been developed to cover a broad range of applications it has today. In the pharmaceutical industry, reversed phase high pressure liquid chromatography (RP-HPLC) is heavily relied upon
from discovery through development and clinical to manufacturing laboratories. RP-HPLC method development strategies have over the years gained significant attention
across the industry and in the scientific literature and regardless of the strategy it is common to see several steps [1, 2] being required before optimal starting conditions for method development and validation can be selected (see Figure 1.1.). The most important information required at the start of the activity are the physical and chemical properties of analytes in the samples requiring separation. These commonly include molecular chemical structure, molecular weight, pKa, logD, LogP, solubility and UV spectra. Such
characteristics enable the chromatographer to narrow down the selection of detector as well as mobile and stationary phases for the development activities.
Figure 1.1. Steps followed in HPLC method development
It is important to gather as much detail as possible about the sample matrix, sampling procedure and sample source prior to any sample manipulation in readiness for the RP-HPLC analysis. In pharmaceutical development laboratories, its generally true that
Sample properties
Sample preparation
Detector selection
Preliminary seperation conditions
Optimise conditions
Check for problems
sample preparation is avoided whenever possible (to ensure as far as possible that samples are unchanged before analysis) and so most samples for RP-HPLC are only diluted into the relevant mobile phase used in the separation method ready for injection (this ensures any solvent miss-matches between sample matrix and mobile phase are avoided which can be evident in chromatograms exhibiting peak asymmetry/split peaks etc). A variety of detectors are used with HPLC systems including: UV/Visible, mass spectrometry, NMR spectrometry [3-5], fluorescence , electrochemical , refractive-index and many more [6]. The detector used depends on the separation goals and the physico-chemical properties of the analyte of interest. For instance, neutral compounds cannot be detected via mass spectrometry but can be visible under UV/Vis (often used in combination with MS for HPLC).
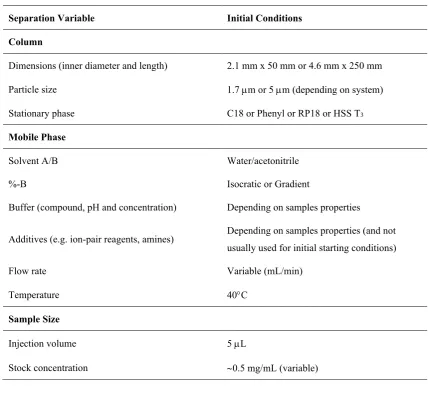
Once the sample properties and goals for the analysis have been considered, some preliminary separation conditions for the method can be applied. Table 1.1 summarises fundamental experimental conditions that need to be considered for the initial method. In some cases, previously successful validated methods with similar goals can be used. The initial conditions might not be optimal but will be sufficient for a starting point for the method development. As shown in Table 1.1, a large number of parameters can be altered with different conditions to achieve the best separating conditions. For instance, the column dimensions, particle size and stationary phase material can each be changed. The mobile phase organic solvent, mobile phase ratio, isocratic or gradient elution mode, use of buffers and additives can also be altered depending on the goals of the method and samples investigated. Selecting the best optimal separating condition in HPLC method development can be both time and money consuming [7, 8]. For instance, Pfizer uses a series of screening experiments to identify the most suitable column (typically three to five phases) and approximate composition of the mobile which can subsequently be optimized to provide the best selectivity [9, 10].
Table 1.1. Experimental conditions that affect HPLC separation.
Separation Variable Initial Conditions
Column
Dimensions (inner diameter and length) 2.1 mm x 50 mm or 4.6 mm x 250 mm
Particle size 1.7 µm or 5 µm (depending on system)
Stationary phase C18 or Phenyl or RP18 or HSS T3
Mobile Phase
Solvent A/B Water/acetonitrile
%-B Isocratic or Gradient
Buffer (compound, pH and concentration) Depending on samples properties
Additives (e.g. ion-pair reagents, amines) Depending on samples properties (and not
usually used for initial starting conditions)
Flow rate Variable (mL/min)
Temperature 40°C
Sample Size
Injection volume 5 µL
Stock concentration ~0.5 mg/mL (variable)
Pfizer recently have been developing new quantitative structure retention time relationship models (QSRR) which currently outperform any commercial software available [19-27]. The predictive algorithms have been used even whilst still being refined and their application to support both selection of suitable starting conditions for RP-HPLC method development but also for troubleshooting purposes have been clear. Specific examples of troubleshooting include the efficient proposal of the most likely structure responsible for new peaks arising during commercial manufacturing or on stability studies allowing rapid structural confirmation. This has been a significant efficiency saving as the usual process for identification of likely structures often involves synthetic chemist brainstorming followed by synthesis of structures posed and the final confirmation by a structural elucidation team.
QSRR models are however not new. Introduced in the 1970s [28], QSRRS have gained significant attention for retention time prediction in various modes of HPLC. In QSRR studies, retention time observed in any HPLC experiment is related to molecular structure and the relationship is defined by numerical descriptions of the molecular structure. There are thousands of molecular descriptors available – many of which can be calculated (Dragon is a typically referred to calculation engine – [29]). To harness the most appropriate descriptors suitable for retention time prediction of any specific molecular structures, generally QSRR models are developed using a representative set of compounds (typically referred to as a training set of compounds) for which the retention times will be gathered experimentally. The most informative molecular descriptors (independent variables) can then be correlated with the retention times (dependent variables) using statistical significance as the selection strategy. This then produces a mathematical model which can be tested with new molecular structures which have experimentally measured retention times (but which are not in the training set) to check the accuracy of the model.
being able to provide some insight on the molecule-stationary phase interactions might serve to enhance the prediction of the QSRR model in development.
The history and evolution of NMR spectroscopy is remarkably fascinating [30]. In 1942, Cornelis Jacobus Gorter published an article [31] describing his attempt to obtain
7Li NMR spectra of LiCl, LiF and other analytes. The reasons for the failure to this
original experiments were that LiF had long longitudinal (T1) relaxation and low
signal-to-noise ratio available, which was confirmed by successful NMR experiments that were obtained 10 years later with one of Gorter’s original crystals [32]. Shortly after Gorter’s discovery, Isidor Isaac Rabi (Columbia University) described how to detect and measure magnetic moments of nuclei. He discovered that applying an oscillating magnetic field could perturb and flip the magnetic moment of a nuclei away from its principal axis [33]. This is when NMR spectroscopy was born. He was awarded the Nobel Prize in Physics in 1944 [34].
Towards the end of Second World War in 1945, Felix Bloch began experimental work on radar scattering and the theory of magnetrons. Expecting that their water samples have long T1 relaxation, Bloch went off to a ski trip to enable the system to return to
equilibrium [35-37]. He later discovered that, in fact, the relaxation rate of water samples was only on the order of a few seconds or even shorter [32]. Soon after their successful experiments at Stanford, a very similar discovery was made at Harvard by Edward Mills Purcell and his co-workers [38, 39]. The work of both Bloch and Purcell was published in January 1946 and, 6 years later, they were both awarded the Nobel Prize for physics. This positive achievement in NMR experimental method development generated excitement for scientists and, as such, NMR now has a multitude of evolving applications in chemistry, biology, physics, geology and even medical diagnosis [40].
Yet one challenge that remained a mystery involved observing broad NMR lines for solid samples due to magnetic dipolar interactions and non-averaged anisotropic interactions. Brownian motion of liquid enables the anisotropic interactions to be averaged hence sharp lines are observed. Raymond Andrews and his colleagues developed a method which involved rotating the sample at a fixed angle (54.44°) about the applied magnetic field [50]. This technique drastically removed the anisotropic interactions in solid samples and was referred as “magic” by Gorter in the early 1960s [30]. Similarly, Irving Lowe also came up with the idea of spinning solids which led to the concept of magic angle spinning (MAS) [50-52]. MAS NMR spectroscopy is widely used in solid-state NMR with spinning speeds up to 150 kHz has been achieved and proven very informative in recent years [53, 54]. Although MAS was a huge breakthrough in solid state NMR, the low signal sensitivity of low abundance nuclei (e.g. 13C or 15N)
remained a challenge. The combination of a concept developed by Hartmann Hahn [55] in 1962 and MAS created the heavily used technique known as cross polarization [56] (CP-MAS) method [56]. The CP-MAS technique was and is effective for observing high resolution solid-state spectra of low sensitivity and abundance nuclei.
MAS NMR spectroscopy applications are not only limited to solid samples but also benefit solution and heterogeneous samples. In the mid-90’s it was discovered that MAS NMR technique improved the resolution of solution and heterogeneous samples [57-60] by averaging the dipolar coupling and magnetic susceptibility in the samples [61]. This novel technique is known as High-Resolution Magic Angle Spinning NMR (HR-MAS NMR). Over the years, the principal application to date for 1H HR-MAS technique has
largely been used for the profiling of biological tissues [62, 63] and inorganic solids [64, 65]. Importantly, in the context of the current work, (1H) HR-MAS NMR has previously
been used to investigate and characterise the separation behaviour in RP-HPLC. Similar experimental conditions of RP-HPLC can be achieved using 1H HR-MAS NMR. An
advantage of 1H HR-MAS is that well resolved spectra of heterogenous samples
consisting of RP-HPLC stationary phase, mobile and analytes can be obtained.
In the mid-90’s, a 1H HR-MAS spectra of an attached organic solvent to a solid-phase
synthesis beads was published by Fitch et al. [66] followed by several articles on the topic in the subsequent years [57, 67, 68]. Combined 13C and 29Si CP/MAS NMR experiments
silica surfaces by examining the surface chemistry of various reversed phase materials [70, 72-75].
Alongside 19Si CP/MAS NMR investigations, 13C CP/MAS NMR was also used to
gain further information of the structural and conformational order of immobilised monofunctional C8, C18 and C30 ligands [72, 76, 77]. The signal assignment was achieved by similar NMR studies of polyethylene [78] and nonporous silica materials [79]. Additionally, temperature [77, 80, 81] and solvent influence [70, 82-88] on RP materials was also reported using 13C and 29Si CP/MAS. Despite the success of CP/MAS
NMR for characterising silica surface, the information obtained using this technique is often not quantitative [69].
In the 1980s, the molecular mobility of the RP materials via the determination of spin-lattice relaxation T1 was achieved [87, 89, 90]. The idea of using 1H HR-MAS NMR T1
relaxation measurements for obtaining a quantitative measure to characterise the interaction behaviour of silica materials was explored by Klaus Albert [91-93]. Coen et al. similarly probed the molecular dynamics of RP materials by using 1H HR-MAS NMR
T1 and T2 relaxation measurements [94, 95]. They first investigated the water
environments with a C18 bounded silica phase using 1H HR-MAS NMR. Due to the
impressive well-resolved spectra obtained in the 1H HR-MAS NMR spectra, two sets of
peaks were observed. Sharp peaks of water (free) and corresponding broad peaks (bound) were also observed. The broad peaks represent the water molecules in a more motionally restricted environment than the sharp resonances. This suggests the water molecules are bound to the silica surface (e.g. free silanols) [94]. Thanks to the high resolution obtained using this technique, site specific 1H HR-MAS NMR relaxation can be obtained as
proposed by Coen et al. [95]. As an alternative approach diffusion-ordered spectroscopy (DOSY) was also used to stimulate the HPLC retention behaviour. Caldarelli et al. [96-100]and others [97, 101-103] demonstrated a huge success using DOSY experiments for NMR chromatography. Even though DOSY experiments are successful in recent years, this technique does not provide site specific contribution to the retention mechanism and requires some specialised instrumentation and expertise.
Even though several very specific studies has been accomplished in this area, a systematic study of multiple samples with various experimental conditions still remains a mystery.
The thesis of this body of work was to test whether 1H HR-MAS NMR spin-lattice (T 1)
interactions between molecule and stationary phase in RP-HPLC. To do this, a carefully selected series of molecules, mobile phases and five different RP-HPLC stationary phases (BEH-C18, BEH-phenyl, BEH-RP18, CSH-phenyl and HSS T3) were investigated. NMR
relaxation measurements provide vital information about the molecular dynamics and therefore the strength of interaction.
This thesis is divided into several Chapters: the history and theory of RP-HPLC method development is covered in Chapter 2. The fundamental theory of NMR spectroscopy and NMR relaxation is shortly outlined in Chapter 3 and 4. Chapters 5-9 summarize the results acquired in this study. Chapter 5 proposes a systematic 1H
HR-MAS NMR method development, (6) NMR spectroscopy, Raman spectroscopy and atomic force microscopy is used to characterise and probe the morphology of five RP stationary phases (7) approaches of expressing T1 and T2 relaxation, (8) illustrates the elaborated 1H HR-MAS relaxation measurements in comparison to acquired HPLC
2
R
EVERSED
P
HASE
HPLC
In this chapter, the origin, retention mechanism, intermolecular interactions, resolution and method development of reversed phase (RP) HPLC is covered. The content of this chapter is based upon several sources:[104] Snyder, L.R., J.J. Kirkland, and J.W. Dolan, Introduction to modern liquid chromatography. 2011: John Wiley & Sons; [1] Snyder, L.R., J.J. Kirkland, and J.L. Glajch, Practical HPLC method development. 2012: John Wiley & Sons; [105] Cazes, J. and R.P. Scott, Chromatography theory. Vol. 88. 2002: CRC Press; [106] Hanai, T., HPLC: a practical guide. Vol. 6. 1999: Royal Society of Chemistry; [107] Meyer, V.R., Practical high-performance liquid chromatography. 2013: John Wiley & Sons and various journals that are referenced throughout.
2.1The origin of chromatography
chromatography by Waters Associates [117]. Both ion-exchange and gel permeation chromatography techniques were the precursor of HPLC development as they share very similar system set up.
Both techniques involve the pumping of solvents at high pressure through a reusable column; the column eluent is monitored via a selected detector which finally generates a chromatogram. However, each technique was limited to analysing a specific type of samples. The research groups of both Csaba Horváth and Josef Huber investigated the development of a multi-purpose HPLC system. Research groups and other scientists published their findings between 1966 to 1968 [118-121]. In the late 1960s, commercially available HPLC systems were first introduced by Waters Associates and DuPont which initially dominated the market. Consequently, several companies took interest in providing similar equipment and thus HPLC research became of interest. Furthermore, the first HPLC books were published in 1971 [122, 123]. Major developments in HPLC took place between 1960 and 2010. Some of the HPLC development involved drastic reduction of retention time, smaller particle size of the stationary phase and discovery of column materials with different supporting material and ligand groups for selectivity. However, the fundamental theory of HPLC development was proposed by Martin [124] in 1941 by suggesting that enhanced column efficiency can be obtained by using smaller particle size and high pressure across the column [104].
A decade later, Martin invented gas chromatography [125] (GC) which led to several theoretical findings[126, 127] which had a fundamental impact for the underlying theory of HPLC development. In early 1960, Giddings extended these theoretical studies to develop more specified applications of HPLC. This work proved to be crucial for the evolution of column efficiency and HPLC experimental method development which is now heavily used across the globe. Herein, only a very short but concise summary of the history and development in chromatography has been covered. More detailed contributions have been reported in several publications [128, 129].
2.2HPLC Chromatography Process
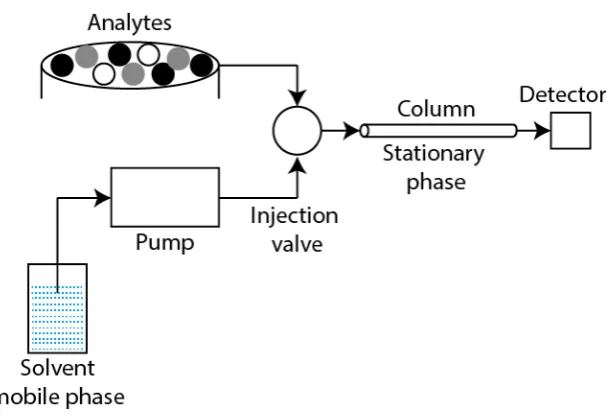
Figure 2.1. Schematic of HPLC system
An illustration of a typical HPLC system is shown in Figure 2.1. The arrows illustrate the flow of the solvent which is stored in the solvent reservoir and migrates to the detector. The solvent in HPLC is referred to as the mobile phase of the system. Once the sample is
plays a fundamental role in RP-HPLC as this is predominantly where separation takes place.
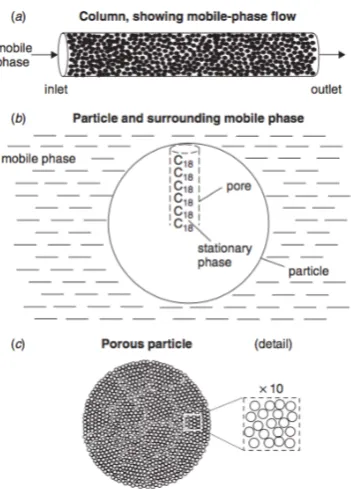
Figure 2.2. HPLC Column packed with porous particles. (a) Column packed with spherical particles, (b) schematic of an individual particle, showing an idealised pore with attached C18 chains, (c) picture of a spherical, porous particle, showing detail (10x expansion). Adapted from [104].
[image:44.595.241.417.111.356.2]The column is a cylindrical tube typically packed with small particles (usually 1.7 to 5 µm in diameter and typically spherical) (Figure 2.2a and 2.3). These particles are typically made of porous silica (illustrated in Figure 2.2b).
The inside of each pore is covered with the stationary phase ligand functional groups (in this case C18 groups are bounded onto the silica particles) for selectively. Since most of
the surface of the particle is contained within these pores, most of the analyte molecules are retained inside the particle rather than its surface. Additionally, the internal surface of the pores forms approximately 99% of the total surface area of the particle. The external surface area (effect on separation) is in most cases considered to be negligible [104].
Even though retention is mainly controlled by the bonded ligand functional group and mobile phase chemistry, the surface area of the packing material also plays a crucial role. The surface area available is dependent on the pore size of the particle packed into the column. The pore size is of the particle is selected so that the analyte molecules can easily access the pores. The surface area of a particle is inversely proportional to the pore
diameter [132]. For instance, a 3-µm particle with a 100 Å pore column will have
approximately three times the surface area as a 3-µm particle, 300 Å pore column. Typically, particles pores with 100-150 Å are used to analyse small molecules and peptides while ≥300 Å pore size particles are used to separate proteins [133]. The analyte molecules can enter the particle pores via diffusion (there is usually no significant flow of mobile phase through the particle).
next sections in this chapter cover several components of a HPLC system and the retention mechanisms in RP-HPLC.
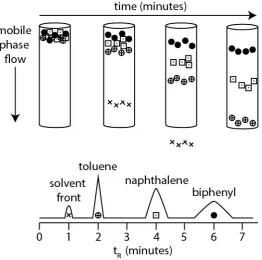
Figure 2.4. Modelled separation process in HPLC of a mobile phase (x), toluene (⨁), naphthalene ( ) and biphenyl (•) with a corresponding chromatogram.
2.3 RP-HPLC Retention
The time it takes an analyte to travel through the column to the detector is known as the retention time, tR. As shown in Figure 2.4, the modelled retention time of toluene, naphthalene and biphenyl are 2, 4 and 6 minutes respectively. The retention time of the solvent (solvent front) is 1 minute which is known as the column dead time t0. This dead time essentially represents the time taken for a molecule which has ‘zero’ interactions with the stationary or mobile phase to travel from the point of injection to the detector. The velocity ua at which toluene (a) flows through the column can be expressed as:
78 = 97 (2.1)
where 7 is velocity of solvent molecules and R is the fraction of toluene’s molecules in the mobile phase.
:;<7=>= ?;<=@7<=A B> CD ⇔ :;<7=>= ?;<=@7<=A B> FD (2.2)
where MP and SP represents mobile and stationary phase respectively. As shown in Figure 2.5, the molecules of toluene have a higher number of molecules in the mobile phase compared to the stationary phase pores, however naphthalene have a larger number of molecules present in the stationary phase compared to mobile which suggest naphthalene is retained longer compared to toluene. Due to the equilibrium process of naphthalene, naphthalene migrates more slowly through the column than toluene, as illustrated in Figure 2.5. However, the migration rate of an analyte is dependent on, the physic-chemical properties of the analyte together with the chemical characteristics of the mobile and stationary phases as well as the temperature of the system.
Figure 2.5. Illustration of the equilibrium distribution and migration rates of toluene (⨁), naphthalene ( ) between a mobile phase and BEH-C18 stationary phase.
2.4Column dead-time (t0) and retention factor (k)
The retention factor of an analyte is defined as the amount of solute present in the stationary phase (s), divided by the amount of solute in the mobile phase (m). The quantity of the solute in each environment is equal to its concentration (Cs or Cm respectively)
multiplied by the volume of the phase (Vs or Vm respectively) which equates to:
G = HIJI HKJK = H
I
HK L × JI
JK
L (2.3)
where K = (Cs/Cm) is the equilibrium constant which is expressed in terms of the
concentration of the analyte in the stationary phase (Cs) and mobile phase (Cm), and Ψ=
(Vs/Vm) is known as phase ratio (ratio of SP and MP in the column) [117]. The retention
factor plays a major role for each peak observed in chromatography and furthermore enables us to improve the resolution and quality of the separation. Some solute molecules are either present in the MP or SP so that if the quantity of solute molecules in MP is defined R, the quantity of solutes present in the SP = 1 – R. Equation 2.3 can be expressed as:
G = 1 − 9
9 (2.5)
9 = 1
1 + G (2.6)
The retention time of toluene (a) can be expressed as the distance travelled divided by its speed (ua) such as:
:S =
T
78 (2.7)
where L is the column length which varies depending on the dimensions of column used. The solvent front can also be expressed as:
:U =
T
7 (2.8)
Both equation 2.7 and 2.8 can be combined to give:
:S = :U7
78 (2.9)
Recalling equation 2.1 (R = ua/u), equation 2.9 can be rewritten as:
:S = :U(1 + G) (2.10)
Equation 2.10 can be rewritten in terms of the mobile phase flow (F) and retention volume VR = tRF such as:
JS = JK(1 + G) (2.11)
where Vm is column dead volume = t0F. Equation 2.10 can be rearranged as:
G = :S − :U
Equation 2.12 enables us to determine the retention factor of each peak observed in a chromatograph. However, to determine this retention factor of an analyte, the solvent front must be determined which is usually observed in the early parts of the chromatogram.
2.5RP-HPLC resolution
As previously mentioned, RP-HPLC method development is the process of selecting the optimal separating conditions to achieve the desired goals of separation [134]. The separation of two peaks (e.g. i and j) can be expressed in terms of their resolution (Rs)
such as:
9I =
2Y:S(Z)− :S([)\
][ + ]Z (2.13)
Where :S([) and :S(Z)are the retention time of peak B and ^ respectively. Additionally, ][
and ]Z are the baseline width of peak B and ^ respectively. Better separation (higher
resolution) is achieved with larger difference in retention time and narrow peak width. The essential role of HPLC method development is to achieve the best separation and resolution of every compound in a mixture. Generally, if two or more compounds are
analysed, a Rs³2 is expected. Alternatively, RP-HPLC Rs can be approximately expressed
as:
9I = _1 4a b
G (1 + G)c deefeeg
(8)
(h − 1)defeg
(i)
√kl
(m) (2.14)
where k is the retention factor (term a), a is the separation factor (term b) and N is the column efficiency (term c)[135]. The retention factor is the ratio of the analyte retention time on the column to the retention time of a non-retained compound. The column efficiency also known as the number of theoretical plates is a measure of the dispersion of the analyte band as it goes through the HPLC system and column which indicates the column performance [136-138]. The separation factor is also referred to as the separation selectivity is the ability of the chromatographic system to chemically differentiate between sample components [138, 139] and can be expressed as:
h = GZ
G[ (2.15)
where GZ and G[ are the retention factor of peak B and ^ respectively. Each term in
However, the separation factor (term b) by far provides the greatest effect on the final resolution achieved. Furthermore, the Purnell equation [140, 141] is commonly used to determine the Rs between two peaks:
9I =√k4 _
h − 1 h a _
G
(1 + G)a (2.16)
To achieve the optimal separating RP-HPLC conditions, several experimental parameters must be systematically varied to achieve the separation goals of the method (see Table 2.1). This process can be divided into 4 stages. Initially, a column is carefully selected which is most likely to separate the compounds. Secondly, the organic solvent (%B) percentage is varied to an appropriate range. A flow rate is also chosen according to the column properties (e.g. column length, diameter and stationary particle size). Finally, a running time which is sufficiently long enough to allow all the analytes to elute must be used.
2.5.1Optimising the retention factor (k)
The retention factor (term a of equation 2.14) of analytes in RP-HPLC chromatography can be altered by changing the organic solvent percentage (solvent B%). The first step of achieving a good retention factor is by setting the running times not too long or too short. The overall aim is to set a running time where all the analytes elute with sharp and narrow peaks (good resolution). This step during method development can be challenging when dealing with bulky and ionisable analytes. The running time must be chosen wisely to reduce running time of large set of samples. Additionally, in some cases some analytes do not elute after long running times in isocratic mode. Therefore, steep gradient elution can be used to elute the analytes with shorter running times. As previously mentioned, the effect of the organic solvent percentage in RP-HPLC retention [142-144] can be expressed as:
log G = log Gq − F∅ (2.17)
2.5.2Optimising selectivity (a)
When the separation needs additional improvement, the method selectivity (term b of equation 2.14) is adjusted to obtain a better separation. Several experimental conditions proposed in Table 2.1 can be adjusted to optimise the selectivity of the method including the %B, the chosen solvent B (generally acetonitrile or methanol), temperature, column type, mobile phase pH, buffer concentration and additive ion-pair reagents. However, changes to these experimental conditions can also affect the retention factor. Hence, this needs to be taken into consideration. Similarly, to optimise the retention factor, the organic solvent percentage is varied. This is then followed by a change in temperature until good peak shapes and resolution is obtained.
2.5.3Optimizing the column plate number (N)
2.5.3.1Column properties
Once a good peak separation and resolution is achieved, the method can be optimised further by varying the column properties (e.g. column length, flow rate, particle size). A change in such column properties can either increase or reduce the number of theoretical plates N (equation 2.18).
k = 16 _:t ]a
u
(2.18)
µm) have been favoured over the commonly used 5 µm column particle size for faster analysis.
2.5.3.2Fast HPLC
RP-HPLC separation of a series of analytes can be achieved in couple of minutes with an
adequate optimised method. Once the k and a are fully optimised, the resolution and running time can then be optimised by N. Additionally reduction of running times can be achieved without affecting the N by using ultra-high pressure RP-HPLC, higher temperature and specially designed column particles.
2.5.3.3Ultra-high pressure
Conventional HPLC systems run at a maximum of 6000 psi or 400 bar. Ultra-high pressure liquid chromatography or U-HPLC can exceed pressures of 6000 psi which yields shorter running times[145, 146]. U-HPLC can reduce running times by 2 to 6 folds in some cases [119]. Even though U-HPLC enables a reduction to the experimental running time, this comes with a cost; the mobile phase viscosity increases with an increase in pressure. Due to the viscosity of the mobile phase through the packed stationary phase, the internal temperature of the column potentially fluctuates which consequently affects k, a and N [147]. Thus, U-HPLC systems can further complicate the method development.
2.5.3.4High temperature
RP-HPLC analyses usually operate between room temperature and 50 °C, however some
experiments have proven possible at extremely high temperatures above 100 °C. Using extremely high temperatures enables a shortened experimental running time, sometimes improving resolution and therefore increasing the N [148-151]. As far as the optimised column length, particle size and flow are carefully selected, an increase in a temperature will improve N. Furthermore, an increase in temperature reduces the mobile phase viscosity and increases the solute diffusion coefficient (Dm). A lowering of mobile phase
Even though using higher temperatures has proven to be advantageous, this technique can lead to a few complications. Using high temperatures can lead to sample degradation and temperature gradients can be caused by using higher temperatures [152, 153]. Temperature gradients can be minimised by using narrower diameter columns, which enables faster system equilibration to be achieved or by careful use of extra system heating components pre and post column to remove temperature gradients. Additionally, at higher temperatures, columns stability can be affected especially under extreme pH conditions.
2.5.3.5Specially designed column particles
Several column designs are commercially available including column particles with either pellicular or shell particles design. These particles of special designs have proven useful for selectively separating large or small analytes and which are robust at high flow rates [154].
2.6HPLC experimental parameters and effect on separation
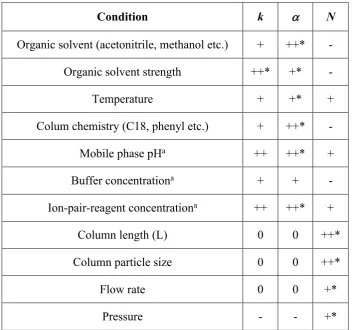
Table 2.1 shows the effect of varying various conditions to control the retention (k) behaviour of an analyte and more specifically control the separation selectivity (a) or column efficiency (N).
2.6.1Mobile phase
Table 2.1. Effect of different experimental conditions on the retention (k), selectivity (a) and column efficiency (N)[104].
Condition k a N
Organic solvent (acetonitrile, methanol etc.) + ++* -
Organic solvent strength ++* +* -
Temperature + +* +
Colum chemistry (C18, phenyl etc.) + ++* -
Mobile phase pHa ++ ++* +
Buffer concentrationa + + -
Ion-pair-reagent concentrationa ++ ++* +
Column length (L) 0 0 ++*
Column particle size 0 0 ++*
Flow rate 0 0 +*
Pressure - - +*
where; ++ indicates major effect, + minor effect, - relatively small effect and 0 no effect.
a indicate condition that primarily affects ionisable analytes (acids and bases). * indicates
the experimental conditions that predominantly dominates the k, a and N respectively. For example, the organic solvent or column chemistry is varied to control a while pressure is varied to only control N.
2.6.2Organic solvent strength
The retention in RP-HPLC is dependent on the percentage of organic solvent (solvent B) in the mobile phase as:
log G = log Gq − F∅ (2.19)
and hence elute faster. A mobile phase which provides small retention times (higher solvent B%) is referred to a strong mobile phase [119, 120]. Furthermore, a mobile phase with higher water percentage is known as a weak mobile phase. An increase of 10% of organic solvent usually reduces the retention times by a factor of 2 to 3 [121, 122]. The final percentage of solvent B must be carefully selected to obtain suitable separation and retention within the series of analytes.
2.6.3Column chemistry
Typically, a non-polar stationary phase (e.g. BEH-C18) and polar (water containing) mobile phases are used in RP-HPLC. Polar analytes will interact more with polar mobile phases and thus, will be eluted quicker (larger R and shorter k), while non-polar analytes will interact strongly with the stationary phase and hence will be retained longer (smaller
R and longer k).
Figure 2.6. Illustration of hydrophobic interactions and hydrogen bonding interactions.
Table 2.2. Commonly used RP-HPLC stationary phases with hydrophobicity properties.
Stationary Phase C18
C8 C4 Cyano Phenyl Amino
Figure 2.7. Structure illustration of (a) monomeric C18 and (b) polymeric C18 chromatography models illustrating the different ligand types. Adapted from [167].
Decreasing
Hydrophobicity/
increasing polarity
Non-polar
Analytes
are retained


![Table 2.3. Commonly used buffers in RP-HPLC. Adapted from [1]](https://thumb-us.123doks.com/thumbv2/123dok_us/9427329.447293/63.595.172.485.186.420/table-commonly-used-buffers-rp-hplc-adapted.webp)