Probabilistic Dialogue Modeling for Speech-Enabled Assistive Technology
William Li, Jim Glass, Nicholas Roy, Seth Teller
MIT Computer Science and Artificial Intelligence Laboratory, Cambridge, MA 02139, U.S.A.
{wli, glass, nickroy, teller}@csail.mit.edu
Abstract
People with motor disabilities often face substantial chal-lenges using interfaces designed for manual interaction. Al-though such obstacles might be partially alleviated by auto-matic speech recognition, these individuals may also have co-occurring speech-language challenges that result in high recog-nition error rates. In this paper, we investigate how augmenting speech applications with dialogue interaction can improve sys-tem performance among such users. We construct an end-to-end spoken dialogue system for our target users, adult wheelchair users with multiple sclerosis and other progressive neurolog-ical conditions in a specialized-care residence, to access in-formation and communication services through speech. We use boosting to discriminatively learn meaningful confidence scores and ask confirmation questions within a partially observ-able Markov decision process (POMDP) framework. Among our target users, the POMDP dialogue manager significantly in-creased the number of successfully completed dialogues (out of 20 dialogue tasks) compared to a baseline threshold-based strat-egy (p = 0.02). The reduction in dialogue completion times was more pronounced among speakers with higher error rates, illustrating the benefits of probabilistic dialogue modeling for our target population.
Index Terms: spoken dialogue systems, speech interfaces, POMDPs
1. Introduction
People with mobility or physical impairments may have dif-ficulty with touch-based user interfaces. Automatic speech recognition (ASR) potentially offers an alternative, natural means of device access, but such systems can still be chal-lenging to use for individuals who have speech impediments or disorders. For example, mismatches may exist between their speech and that of trained ASR systems. These technical chal-lenges mean that ASR often fall short of its potential as an ac-cess equalizer for people with disabilities [1].
Current approaches to recognizing speakers with disabili-ties often use speaker adaptation techniques [2, 3]. Such train-ing, however, may be costly, tirtrain-ing, and difficult for the speaker. As well, in some real-world systems, it may not be possible to access or adapt the underlying acoustic models. Meanwhile, in many assistive technology applications, such as device control or information access, the success metric may not be the word error rate, but rather whether the system successfully under-stands the user’s intent and ultimately responds correctly. Mo-tivated by this abstraction, and faced with highly challenging speech, we seek to construct a system that optimizes perfor-mance at the user intent level.
The present paper describes the use of probabilistic dia-logue modeling for a population of speakers with high recog-nition error rates. Specifically, we developed an assistive
spo-ken dialogue system in a partially observable Markov decision process (POMDP) framework, in which the the dialogue sys-tem seeks to infer the user’s intent and handles speech recog-nition uncertainty by asking confirmation questions. We learn models of: 1) how speech recognition hypotheses map to user intents and 2) meaningful confidence scores from ASR features so that our dialogue manager can make better response deci-sions. Our work draws on modeling techniques from work in spoken dialogue system POMDPs (e.g., [4, 5, 6]) and is inspired by other POMDP-based assistive technologies for handwashing (e.g., [7]) and intelligent wheelchair navigation (e.g., [8, 9, 10]), all of which model the user’s intent as a hidden state to be in-ferred from observations.
Our work has two main contributions. First, we defined and modeled our problem as a spoken dialogue system POMDP by understanding our users and the design constraints. We col-lected data specifically for this application, trained the proba-bilistic models that are part of the dialogue system, and made design decisions appropriate to our application, all of which we describe in this paper. Second, we conducted experiments involving speakers with disabilities that demonstrated the ef-fectiveness of the POMDP framework under high-error condi-tions. As illustrated in our results, handling uncertainty with the POMDP-based dialogue manager led to higher dialogue com-pletion rates and shorter dialogue times, particularly for users with high speech recognition error rates.
This paper is structured as follows: We describe our assis-tive technology application domain and our target user popu-lation (Section 2), the formupopu-lation of our POMDP-based spo-ken dialogue system (SDS-POMDP) (Section 3), our model-building efforts (Section 4), and the experiments designed to test the effectiveness of our end-to-end system (Section 5). We conclude with insights on using dialogue interaction for assis-tive technology.
2. Problem Domain
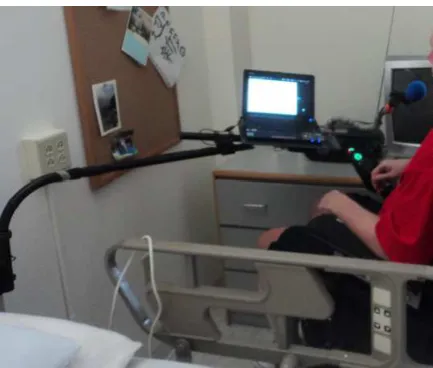
Our target population is the residents at The Boston Home (TBH), a specialized-care residence in Boston, Massachusetts, USA for adults with multiple sclerosis (MS) and other progres-sive neurological conditions, and our goal is to develop speech-enabled assistive technology that can be bedside or wheelchair accessible. One example physical setup for a resident is shown in Figure 1. MS and other related neurological conditions are often associated with co-occurring speech pathologies, includ-ing rapid fatigue, voice weakness, very slow speakinclud-ing style, or mild to severe dysarthria [11]. In addition, cognitive impair-ments associated with MS can also lead to language disorders [12], which could challenge conventional ASR language mod-els.
Table 1 illustrates the performance of our ASR system on on 30 utterances for members of our target population. All of
Figure 1: Example bedside setup of speech interface in resident room at TBH.
the utterances were processed by the MIT SUMMIT speech rec-ognizer [13] using the same set of acoustic and language mod-els. Our target users were seven adult residents at TBH (5 male, 2 female, ages 45 to 70), all of whom use wheelchairs and ex-pressed an interest in using a speech recognition-based system. More precisely, our metric of interest is whether the speech recognition hypothesis maps to the user’s intent — an utterance is labeled “correct” if its top hypothesis and its ground-truth la-bel map to the same intent in our dialogue system. For example, if the utterance “what is monday’s lunch menu” is hypothesized as “what is monday the lunch”, this utterance would be marked as correct because both the hypothesis and the label correspond to the intent(lunch monday).
[image:2.595.49.266.96.280.2]Table 1 also shows the performance of the speech recog-nizer for a control group of seven students (6 male, 1 female, ages 21 to 32) without speech impairments of any kind. The target and control users are not paired in any way; our main reason for showing the system performance with these control users is to provide a quantitative sense of how the speech of our target users is handled conventional ASR systems. In addition, by evaluating our system with both target and control users in our dialogue system, as we show in Section 5, we can compare the value of using dialogue among high- and low-error speakers.
Table 1: Concept error rates (30 utterances) for target and control populations
Speaker
(Target) Error RateIntent (Control)Speaker Error RateIntent
target01 13.3% control01 3.3%
target02 3.3% control02 10.0%
target03 33.3% control03 6.7%
target04 56.7% control04 13.3%
target05 26.7% control05 3.3%
target06 9.4% control06 3.3%
target07 6.6% control07 0.0%
mean 21.4% mean 7.5%
std. dev. 18.9% std. dev. 4.3%
Clearly, the target group of users has a much higher error rate, meaning that a system that simply parses the top
hypoth-esis would be unusable for many target users. This research hypothesizes that dialog strategies that consider the uncertainty associated with user utterances can enable higher task comple-tion rates, particularly for speakers with high speech recogni-tion error rates. The system should handle ASR errors robustly, with the aim of deciphering the user’s intent in order to respond appropriately.
3. Partially Observable Markov Decision
Processes (POMDPs) for Spoken Dialog
Substantial research exists on modeling spoken dialogue as a partially observable Markov decision process (POMDP) [4, 5, 6]. Briefly, a POMDP is specified as a tuple {S, A, Z, T,Ω, R, γ}and is a sequential decision model that handles uncertainty in the environment in a principled way. A POMDP spoken dialogue system (SDS-POMDP) treats speech recognition results as noisy observations of the user’s intent: it encodes the user’s intent as a hidden state,s ∈ S; automatic speech recognition hypotheses as observations,z ∈Z, of that
state; and system responses as actions,a ∈A. The transition modelT =P(s′|s, a)gives the probability that the user’s in-tent will change tos′given the previous intentsand the system actiona; the observation modelΩ = P(z|s, a)describes the probability of ASR observationzfor a given intentsand action a; andR(s, a)specifies the immediate reward associated with each system actionaand user intents. The discount factorγ
is a parameter (0 ≤ γ ≤ 1) that weighs the value of future rewards to immediate rewards.
Bayesian filtering is used to infer a distribution over the user’s state at each time step t from the history of actions and observations,p(st|a0:t, z0:t)[14]. This distribution is usually
referred to as the belief,b. The SDS-POMDP maintains the
be-lief distribution,b, over the user’s possible intents and chooses actions based on a policy,Π(b), that maps every possible belief to an action,a, in order to maximize the expected discounted
reward,P
t
γ−tR(s, a). We describe the key elements of the
SDS-POMDP in the context of the system that we developed for our experiments below.
3.1. SDS-POMDP System Implementation
User Goals (States,S) and System Responses (Actions,A): When a user interacts with the dialogue manager, we assume that he or she has a goal,s ∈S. The purpose of the dialogue manager is to choose an action,a∈A, that satisfies the user’s goal. More precisely, the dialogue manager seeks to infer which goal the user is trying to achieve and take an appropriate action. For our system, we identified the following areas of interest to residents at TBH:
• Time and date;
• Recreational activities schedules; • Breakfast, lunch, and dinner menus; • Making phone calls.
Our SDS-POMDP has 62 states, corresponding to each of the possible user goals. For example, (weather today) or (make phone call)are two different states.
and(show, (weather today)). In addition, the SDS-POMDP can greet the user or ask the user to repeat, for a set of 126 system actions.
ASR Outputs (Observations,Z): The SDS-POMDP uses the aforementioned MIT SUMMIT speech recognizer [13]. Each spoken utterance is processed into a ten-best list of hy-potheses with acoustic and language model scores. We then extract keywords to deterministically map the top hypothe-sis into one of 65 concepts: observations corresponding to each of the 62 goals (such as ( weather today ) and (lunch monday)), a ( yes ) and ( no ) command, and a ( null )command if there is no successful parse. Meanwhile, the text of the ten hypotheses for each utterance, along with the acoustic and language scores for each utterance computed by the speech recognizer, are used as features to as-sign a confidence score to the hypothesis, as detailed in Sec-tion 4. An observaSec-tionzin the SDS-POMDP, therefore, consist of a discrete part,zd(one of 65 possible parses) and a
continu-ous confidence score,zc(where0≤zc≤1).
Observation Model (Ω): Ω = P(z|s, a)is our model, learned from data, of recognition hypotheses given the user’s intent,s, and the system’s response, a. As described above, our observations consist of a discrete (zd) and a continuous (zc)
part, meaning that we need to learn the modelP(zd, zc|s, a). We factor the observation function into two parts as per Equa-tion 1 using the chain rule:
Ω =P(zd, zc|s, a) =P(zd|s, a)P(zc|s, a, zd) (1)
The first term,P(zd|s, a)is estimated from our labeled data using maximum likelihood; for each discrete observationz∗d,
the valueP(z∗
d|s, a)is computed as follows:
P(z∗d|s, a) =
c(zd∗, s, a)
P
zdc(zd, s, a)
(2)
Meanwhile, for the termP(zc|s, a, zd), data sparsity makes it challenging to directly learn the model of confidence score for every(s, a, zd)-triple. To mitigate this issue, we use an
approx-imation similar to the one used by [15], where we learn two models: 1) the distribution of confidence scores when the ut-terance hypothesis is correct (P(zc|correct observation)), and 2) the distribution of confidence scores when there is an er-ror (P(zc|incorrect observation)). The motivation for this ap-proach is that correctly recognized utterances should have a dif-ferent distribution of confidence scores than incorrectly recog-nized utterances. In addition, an equivalent statement to the ob-servation being correct is that thatzdcorresponds tos(denoted below aszd7→s). As a result, for all possible user goalssand
discrete observationszd, we can approximateP(zc|s, a, zd)as follows:
P(zc|s, a, zd) =
(
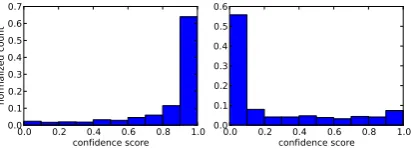
P(zc|correct observation) ifzd7→s P(zc|incorrect observation) otherwise (3) We describe our efforts to learn the confidence score model from our data in Section 4. Figure 3 illustrates that, indeed, the distributions ofP(zc|correct observation)and
P(zc|incorrect observation)are different in our dataset. These two models capture the insight that the confidence score con-tains information about whether the utterance has been correctly or incorrectly recognized. By assuming that the distribution of confidence scores for correct and incorrect observations are the same for every concept, our approach helps overcome data spar-sity issues.
Transition Model, T: For our prototype system, our transi-tion functransi-tionT =P(s′|s, a)is simple: we assume that that the user’s goal does not change over the course of a single dialog, meaning that the transition function equals 1 ifsn+1=snand 0 otherwise.
Reward Function, R: The reward function specifies a pos-itive or negative reward for each state-action pair in the SDS-POMDP; as a result, it is described by asR(S, A). We
hand-crafted a reward function that has positive rewards for “correct” actions (e.g. showing the user the weather if the user’s goal was to know the weather), large negative rewards for “incorrect ac-tions” (e.g. making a phone call if the user’s goal was to know the lunch menu), and small negative rewards for information-gathering confirmation questions. The reward for confirmation questions that do not correspond to the user’s goal is slightly more negative than for the “correct” confirmation question.
Belief Updates: Over the course of a dialog, our SDS-POMDP updates the belief distribution,b, from the observed
hypothesis, the observed confidence score, and the transition function,T =P(s′|s, a). At time stepn+1, the SDS-POMDP uses these models and the prior belief,bn, to computebn+1:
bn+1(s′)∝P(zd|s′, a)P(zc|s′, a, zd)X
s
P(s′|s, a)bn(s)
(4)
During runtime, the SDS-POMDP does not have access to the ground-truth label of the user’s utterance. For each states′,
the termsP(zd|s′, a)andP(zc|s′, a, zd)are chosen from the appropriate conditional probability distribution in Equations 2 and 3, respectively.
Computing the Policy,Π: The policy, which maps beliefs to actions, is computed offline from the specified models in the SDS-POMDP. Given how we incorporate the continuous con-fidence scorezcinto the observation functionΩ, conventional methods of computing the POMDP policy are computationally expensive. We chose the QMDP approximation to compute the policy for the SDS-POMDP. While QMDP is a greedy heuris-tic, as opposed to an optimal POMDP solution, we hypothesized that it could produce an effective dialogue policy in our work. Specifically, the QMDP algorithm computes a functionQfor
each state-action pair,
Q(si, a) =R(si, a) +
N
X
j=1 ˆ
V(si)P(sj|si, a) (5)
whereVˆis the converged value function of the SDS-POMDP’s underlying Markov decision process (MDP) [16]. Then, for a belief stateb = (p1, p2, ...pN), wherepi corresponds to the probability mass in statei, the policy is simply
Π(b) = arg max
a N
X
i=1
piQ(si, a) (6)
It is impractical to describe the policy’s prescribed action for every possiblebin our system, but a few representative
be-lief points and corresponding actions are:
1. ifbis uniform, then the dialogue system asks the user to
repeat;
2. ifbhas very high probability in one state,s∗, and the
3. between situations 1 and 2, i.e. if the probability mass ins∗is not high enough for the system to perform the
terminal action, then it will ask a confirmation question corresponding tos∗.
[image:4.595.51.269.196.349.2]User Interface: Finally, the user interface for the SDS-POMDP is presented to the user on a netbook computer. In our current implementation, the speech recognizer is run locally. A screenshot of the interface is shown in Figure 2.
Figure 2: Graphical user interface of assistive spoken dialogue system, with indicators of time, system state (“Awake”), and
speech synthesizer state (“Voice On”).
4. Model Training and Confidence Scoring
Data Collection: A total of 2701 utterances were collected and manually transcribed from volunteers in our research lab and at TBH. Participants were prompted with possible goals and asked to speak a natural-language command corresponding to the goal, prefaced by an activation keyword like “chair” or “wheelchair.” Because our target population has difficulty using buttons or other physical access devices, a speech-activity de-tector based on the measured spectral power of the audio signal was used instead of a push-to-talk activation method typical in many speech applications. This corpus of utterances was used to estimate the discrete and continuous parts of the observation modelΩ, as summarized in Equations 2 and 3.Learning the Confidence Score: To learn the confidence score,zc, each of the 2701 utterances was labeled as “correct” (+1) if the parse of the top hypothesis matched the parse of the transcription and “incorrect” (−1) otherwise. We then extracted features from each utterance’s 10-best list and trained a classi-fier on 90% of the utterances using AdaBoost [17]. At each itation, AdaBoost chooses a feature with the lowest weighted er-ror, and re-weighs training data points by assigning more weight to misclassified examples; some of the features that it selected are shown in Table 2. Using this weighted set of features, the classification error rate on a held-out test set (10% of the utter-ances) was 6.9%.
Next, we fit a logistic regression curve to AdaBoost’s weighted sum of features to interpret the AdaBoost classifier’s result as a confidence score. The resulting distribution of confi-dence scores for correctly and incorrectly recognized utterances is shown in Figure 3. For a given confidence scorezc, we can
compute the necessary quantities in Equation 3 from these two histograms. These two distributions reveal that the confidence score contains important information about whether the
ob-Table 2: Features selected by AdaBoost classifier
Feature
Category Examples
Concept-level parse success; category of concept ASR scores acoustic, language, and total model
scores; difference between top score and second-highest hypothesis score Word-/
sentence-level
fraction of stop words; presence of mul-tiple concepts; presence of highly mis-recognized words or often merged/split word pairs
n-best list concept entropy of n-best list;
frac-tion of total acoustic or language model scores
served concept is correct or incorrect. During the belief update step of the SDS-POMDP, we draw from the “correct observa-tion” distribution for the state corresponding to the observation concept and from the “incorrect observation” distribution for all other states. For example, the hypothesis(lunch, today) paired with a high confidence score could shift the belief distri-bution sharply toward the corresponding(lunch, today) state; in contrast, a low confidence score could actually cause the probability mass to shift away to other states.
0.0 0.2 0.4 0.6 0.8 1.0 confidence score 0.0
0.1 0.2 0.3 0.4 0.5 0.6 0.7
no
rm
ali
ze
d c
ou
nt
0.0 0.2 0.4 0.6 0.8 1.0 confidence score 0.0
0.1 0.2 0.3 0.4 0.5 0.6
Figure 3: Distribution of confidence scores for correct (P(zc|correct observation))(left)and incorrect (P(zc|incorrect observation))(right)utterances.
5. SDS-POMDP Experiments
5.1. Experimental DesignWe conducted a within-subjects study that compared our SDS-POMDP dialogue manager to a baseline threshold-based dia-logue manager. In the SDS-POMDP, each diadia-logue began with a uniform distribution over states, the belief was updated ac-cording to Equation 4, and the system response was selected using the learned policy. In the threshold-based model, the con-fidence threshold was set at 0.75, where the system would ask the user to repeat if the threshold was not achieved.
[image:4.595.311.517.402.477.2]manager was in operation for a given task.
Although a threshold-based, memory-less baseline dia-logue manager is simple, we chose it as our point of compar-ison because it represents the current approach used by many existing speech-enabled assistive technologies. Such a system could potentially have advantages over the SDS-POMDP; for instance, there is no risk that belief probability mass would ac-cumulate in incorrect states and require the user to speak addi-tional utterances to correct errors. Meanwhile, it might have been useful to try to learn a optimal threshold, conduct ex-periments with different threshold-based dialogue managers, or evaluate the POMDP-based system with dialogue management strategies. However, because 40 dialogues already took sub-stantial effort for some of our target users to complete, we did not perform these additional points of comparison.
Each of the dialogue tasks was presented with a text prompt on our graphical user interface, similar to the one shown in Fig-ure 2. Our evaluation metrics were 1) the total number of dia-logues (out of 20) completed within 60 seconds and 2) the total duration of the dialog, from the start of the user’s first utterance until the system executed the correct response.
5.2. Results
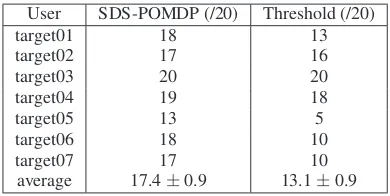
[image:5.595.310.515.102.241.2]All seven control users were able to complete all 20 dialogues successfully within 60 seconds. In contrast, as shown in Ta-ble 3, the seven target users completed an average of 17.4 out of 20 dialogues successfully with the SDS-POMDP and 13.1 with the threshold-based dialogue manager. A one-way repeated-measures ANOVA indicates a significant effect of the SDS-POMDP on the number of dialogues completed within sixty seconds (F(1,6)=10.23, p =.02), compared to the threshold-based model.
Table 3: Number of completed dialogues by target population users by dialogue manager
User SDS-POMDP (/20) Threshold (/20)
target01 18 13
target02 17 16
target03 20 20
target04 19 18
target05 13 5
target06 18 10
target07 17 10
average 17.4±0.9 13.1±0.9
In terms of dialogue completion times, the performance of the threshold-based and POMDP-based dialogue managers for all 14 participants is shown in Figure 4. In the case of unsuc-cessful dialogues, we assume that the total time elapsed was 60 seconds to compute the values in Figure 4.
6. Discussion
6.1. Analysis of ResultsThe results in Table 3 show that the target population users ben-efited considerably from the POMDP-based dialogue manager. In general, this improvement was due to users being able to achieve the dialogue goal after a few low-confidence utterances in the SDS-POMDP; in contrast, they were unable to generate a correct utterance above the confidence threshold in the required time.
Figure 4 illustrates that the largest improvements, in terms
Figure 4: Dialog durations for POMDP- and threshold-based dialogue systems for control (c01-c07) and target (t01-t07)
users. Error bars show standard error of the mean.
of time saved, were among users with the highest completion times with the baseline system. These users were able to com-plete dialogues in less time using the SDS-POMDP. This trend underscores the benefit of probabilistic dialog management in handling noisy speech recognition inputs: the SDS-POMDP performs just as well as simpler, threshold-based methods for speakers with low ASR error rates (i.e.the control participants), but as the uncertainty increases among users with more ASR er-rors, the SDS-POMDP becomes superior.
The key advantage of the SDS-POMDP over the baseline was that it acquired information about the user’s intent from every utterance. The top recognition hypothesis and the confi-dence score updated the SDS-POMDP’s belief. In cases where there was a speech recognition error, it was likely that some probability mass was allocated to the user’s actual goal. As well, utterances with speech recognition errors were more likely to have lower confidence scores, resulting in less “peaked” up-dates to the belief. This behavior meant that probability mass was not incorrectly allocated to the goal corresponding to the in-correct hypothesis. For these reasons, over the course of multi-ple dialogues, the SDS-POMDP’s belief update operation made it superior to the threshold-based dialogue manager.
7. Conclusion
This paper offers empirical evidence that probabilistic dialog modeling, particularly the use of confidence scoring and con-firmation questions in a POMDP framework, could enhance the effectiveness of spoken dialogue systems among users with high ASR error rates. By asking confirmation questions, a sys-tem can become more confident about taking the right action or avoid taking incorrect actions. Such methods could be use-ful for deploying speech-enabled assistive technology among users with challenging speech characteristics or in other situa-tions where error-prone speech recognition is expected.
8. Acknowledgments
We thank Don Fredette and Alexander Burnham for their advice and guidance at The Boston Home.
9. References
[image:5.595.65.260.477.575.2]speech-based applications used by the elderly: A literature review,” As-sistive Technology, vol. 22, no. 2, pp. 99–112, 2010.
[2] F. Rudzicz, “Comparing speaker-dependent and speaker-adaptive acoustic models for recognizing dysarthric speech,” in Proceed-ings of the 9th international ACM SIGACCESS conference on Computers and accessibility. ACM, 2007, pp. 255–256. [3] H. V. Sharma and M. Hasegawa-Johnson, “Acoustic model
adap-tation using in-domain background models for dysarthric speech recognition,”Computer Speech & Language, 2012.
[4] N. Roy, J. Pineau, and S. Thrun, “Spoken dialogue management using probabilistic reasoning,” inProceedings of the 38th Annual Meeting on Association for Computational Linguistics. Associ-ation for ComputAssoci-ational Linguistics, 2000, pp. 93–100. [5] J. Williams and S. Young, “Partially observable markov decision
processes for spoken dialog systems,”Computer Speech and Lan-guage, vol. 21, no. 2, pp. 393 – 422, 2007.
[6] S. Young, M. Gaˇsi´c, S. Keizer, F. Mairesse, J. Schatzmann, B. Thomson, and K. Yu, “The hidden information state model: A practical framework for pomdp-based spoken dialogue manage-ment,”Computer Speech & Language, vol. 24, no. 2, pp. 150–174, 2010.
[7] J. Hoey, A. Von Bertoldi, P. Poupart, and A. Mihailidis, “Assisting persons with dementia during handwashing using a partially ob-servable markov decision process,” inProc. Int. Conf. on Vision Systems, vol. 65, 2007, p. 66.
[8] J. Pineau and A. Atrash, “Smartwheeler: A robotic wheelchair test-bed for investigating new models of human-robot interac-tion,” inAAAI spring symposium on multidisciplinary collabora-tion for socially assistive robotics, 2007, pp. 59–64.
[9] T. Taha, J. V. Mir´o, and G. Dissanayake, “Pomdp-based long-term user intention prediction for wheelchair navigation,” inRobotics and Automation, 2008. ICRA 2008. IEEE International Confer-ence on. IEEE, 2008, pp. 3920–3925.
[10] P. Viswanathan, J. J. Little, A. K. Mackworth, and A. Mihailidis, “Navigation and obstacle avoidance help (noah) for older adults with cognitive impairment: a pilot study,” inThe proceedings of the 13th international ACM SIGACCESS conference on Comput-ers and accessibility. ACM, 2011, pp. 43–50.
[11] L. Hartelius, B. r. Runmarker, and O. Andersen, “Prevalence and characteristics of dysarthria in a multiple-sclerosis incidence co-hort: relation to neurological data,”Folia phoniatrica et logopaed-ica, vol. 52, no. 4, pp. 160–177, 2000.
[12] G. Arrondo, J. Sepulcre, B. Duque, J. Toledo, and P. Villoslada, “Narrative speech is impaired in multiple sclerosis,” European Neurological Journal, vol. 2, no. 1, pp. 11–8, 2010.
[13] J. Glass, “A probabilistic framework for segment-based speech recognition,” Computer Speech and Language, vol. 17, no. 2-3, pp. 137–152, 2003.
[14] L. R. Rabiner, “A tutorial on hidden markov models and selected applications in speech recognition,” Proceedings of the IEEE, vol. 77, no. 2, pp. 257–286, 1989.
[15] J. Williams, “Partially observable markov decision processes with continuous observations for dialogue management,” inComputer Speech and Language, 2005, pp. 393–422.
[16] M. Littman, A. Cassandra, and L. Kaelbling, “Learning policies for partially observable environments: Scaling up,”Proceedings of the Twelfth International Conference on Machine Learning, pp. 362–370, 1995.