An Integrated Forward/Reverse Logistics Network
Optimization Model for Multi-Stage Capacitated
Supply Chain
Lida Tafaghodi Khajavi, Seyed-Mohammad Seyed-Hosseini, Ahmad Makui Department of Industrial Engineering, Iran University of Science and Technology (IUST), Tehran, Iran. E-mail: {lida_tafaghodi, seyedhoseini}@yahoo.com, [email protected]
Received April 7th, 2011; revised May 30th
, 2011; accepted June 1st, 2011.
ABSTRACT
In this study, the integrated forward/reverse logistics network is investigated, and a capacitated multi-stage logistics network design is proposed by formulating a generalized logistics network problem into a bi-objective mixed-integer programming model (MIP). The purpose is to minimize the total costs and maximize the responsiveness of the closed- loop supply chain network simultaneously. Moreover branch and bound algorithm is applied to find a global optimum for this model which provides the decisions related to the facility location problem, optimum quantity of shipped prod-uct, and facility capacity. Finally, a numerical example is conducted in order to show the power of the proposed MIP model to avoid the sub-optimality caused by separate design of the forward and reverse logistics networks. It has been shown that such an approach can significantly help the managers to make decisions about the problems associated with integrated logistics network design.
Keywords: Integrated Forward/Reverse Logistics Network, Closed-Loop Supply Chain Network, Mixed-Integer Linear Programming, Multi-Objective Optimization, Capacity and Location Decision
1. Introduction
Logistics network design provides an optimal platform for efficient and effective supply chain management (SCM). It is an important and strategic operations man- agement problem in SCM, which usually involves multi- ple and conflicting objectives such as cost, service level, resource utilization, responsiveness etc. In general, logis- tics network design decisions include determining the numbers, locations, and capacities of facilities and the quantity of the flow between them [1]. Since opening and closing a facility is an expensive and time-consuming process, making changes in facility location decisions is impossible in a short run. Because tactical and opera- tional decisions are determined after the strategic deci- sions, the configuration of logistics network will become a constraint for tactical and operational level decisions [2].
In the last decade, because of legal requirements, en- vironmental protection and also related economic bene- fits, many companies such as Dell, General Motors, Ko- dak, and Xerox focused on remanufacturing and recovery activities and have met with notable successes in this
area [3,4]. In the recent years, some researches [3,5] classify driving forces led to increased interest and in- vestment in reverse supply chain into two groups: envi- ronmental factors and business factors. Reverse logistics network design includes determining the numbers, loca- tions, and capacities of collection, recovery and disposal centers, buffer inventories in each site, and the quantity of flow between each pair of facilities.
In this paper, specific network design problems for forward, reverse and integrated supply chain design problems are reviewed. To assess the related literature review, the state-of-the-art of classification of logistics network design problem has been provided in [7,8], in these study the classification is developed according to four general specifications: problem definitions, model- ing, outputs and objectives and the available models in the literature in the last decade.
As cost pressures continues, a growing number of firms have begun to explore the possibility of managing product returns in a more cost-efficient and timely man- ner. However, in logistics network design few studies have addressed the problems involve multiple and con- flicting objectives such as total costs and network’s re- sponsiveness. To fill the void in the mentioned line of research, a mathematical model and a genetic algorithm that can solve the reverse logistics problem involving both spatial and temporal consolidation of returned products, is proposed [9]. Tardiness and total costs are minimized for location and capacity decisions in a closed-loop logistics network operated by third party logistics providers [10]. A new solution procedure based on genetic algorithms is proposed to find the set of Pare-to-optimal solutions for multi-objective supply chain network design problem [11]. The rest of this paper is organized as follows. After defining the problem of the present work in second section, a generalized mixed in- teger programming (MIP) formulation model is deve- loped in third section. In forth section the solution me-thod is described. In addition, the application of the model is shown with a numerical example in fifth section. Finally, concluding remarks and some possible future works are given.
2. Problem Definition
To continue and developed our previous research [8] on logistics network design, Unlike the previous studies the integrated logistics network (ILN) discussed in this paper is a multi-stage logistics network including production, distribution, customer zones, collection, recovery and dis- posal centers with multi-level capacities. The main diffe- rences of the proposed bi-objective model compared to existing location models lies in handing forward and re- verse flows simultaneously. Moreover, the problem in- volves multiple and conflicting objectives of total costs and network’s responsiveness.
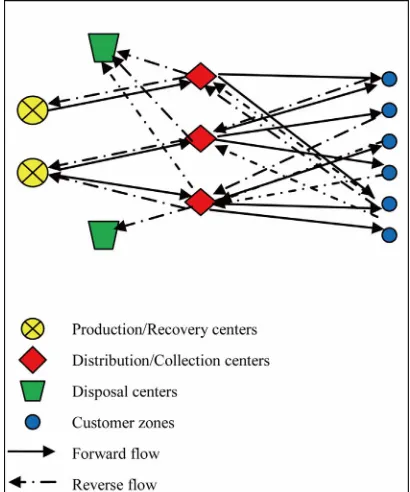
[image:2.595.320.525.85.331.2]As illustrated in Figure 1, in the forward network, new products are shipped from production centers to customer zones through distribution centers to meet the demand of each customer in different time periods. Customer zones are assumed to be predetermined and fixed. In the reverse network, returned products are collected in collection
Figure 1. An integrated forward/reverse logistics network. centers and, after testing, the recoverable products are shipped to recovery facilities, and scrapped products are shipped to disposal centers. It has been discussed that in an integrated logistics network, hybrid processing facilities offer potential cost savings compared to separate distribu- tion or collection centers [6]. Thus, in this paper the ILN is considered a hybrid distribution-collection facility.
In the forward flow, products are pulled through a di- vergent network while in the reverse flow, returned pro- ducts are shipped through a semi-convergent network ac- cording to push principles. After satisfying the demands, a pre-defined percentage of the demand from each customer zone is assumed to be returned and the average disposal fraction is also considered as a pre-defined constant.
Besides determining the number and location of facili- ties, another major issue is the decision on the capacity levels of facilities in order to achieve both minimal costs and maximal network’s responsiveness. In addition, the important problems addressed in this study are as follows: Determining the production, recovery, distribution and collection capacity, as well as the product flow between the facilities.
into account.
3. Mathematical Model
The list of indices, parameters and decision variables are introduced for problem formulation:
Sets and Indices:
I : Set of potential production/recovery center loca-tions iI.
J: Set of potential distribution/collection center loca-tions jJ.
K: Fixed locations of customer zones kK.
M: Set of disposal center locations mM.
N nN
: Set of capacity levels available for facilities .
Parameters: k
d r
: Demand of customer zone k
k: Rate of return of used products from customer
zone k
s: Average disposal fraction
j WC
n
: Warehousing cost of distribution/collection center j
i
f : Fixed cost of opening production/recovery center with capacity level
i n
n j
g : Fixed cost of opening distribution/collection cen-ter j with capacity level
n
n
m: Fixed cost of opening disposal center m with
capacity level
a
n
ij: Shipping cost per unit of products from
produc-tion/recovery center to distribution/collection center
CX
i j
jk: Shipping cost per unit of products from
distri-bution/collection center to customer zone
CU
j k
kj: Shipping cost per unit of returned products from
customer zone k to d stribution/collection center j CQ
i
ji
CP : om d
Shipping cost per unit of recoverable products fr istribution/collection center j to production/ recovery center i
jm
CT : Shippi g cost pn er unit of scrapped products fr
: Total capacity with level for produc-ti
om distribution/collection center j to disposal center
m
capin
on/reco
n
very center i
n j
cap : Total cap city witha level for distribu-tio
vel for disposal center
ti
st per unit of product at produc-ti
n
n/collection center j
n m
cav : Capacity with le n
r
m
du
i
on/re
cw: Manufacturing cost pe unit of product at pro c-covery center i
i
cr : Recovery co on/recovery center i
j
cy : Distribution co t per unit of product at distribu-s tion/collection center j
j
cz : Collection cost per unit of product at distribu-tio
unit of product at disposal cen-ter
n/collection center j
m
cv : Disposal cost per
m
: Weighting factor (importance) for the forward re-sponsiveness in second objective function
(1): Weighting factor (importance) for the reverse responsiveness in second objective function
jk
TF : Delivery time from distribution/collection center e rom customer zone to dis-trib
j to customer zone k
kj
TR : Collection tim f k
ution/collection center j
f
Res : Expected delivery im t e in forward network
r
Res : Expected collection time in reverse network
:
fk j
D j TFk Resf
: kj
rk r
D j TF Res
Decision variables: j
WI : Inventory of products in distribution center
Capacity of recovery for production/recovery
j
i: Capacity of production for production/recovery
caw
center i
i
car: center i
j
cay : C on cen
apacity of distribution for distribution/
collec-ti ter j
j
caz : Ca acity op f collection/inspection for distribu-tion/collection center j
ij
X : Quantity of products shipped from production/ recovery center i to distribution center j
jk
U : Quantity of products shipped fro m distribution/ co
f h ped from
cus-to
llection center j to customer zone k
kj
Q : Quantity o returned products s ip mer zone k to distribution/collection center j
ji
P : Qua ity of recoverable products shipp d nt e from distribution/collection center j to production/recovery center i
jm
T : Quantity of scrapped products shipped from dis-tribution/collection center j to disposal center m
1
n i
W , if a production/recovery center with capacity level n is opened at locationi; 0, otherwise.
1
n j
S , if a distribution/coll ction center wite h capacity level n is opened at location j; 0, otherwise.
1
n m
V , if a disposal center ith capacity levw el is ope
o bi-objective ILN
de-si
3
TC
n
ned at location l; 0, otherwise. In term of the ab ve notation, the
gn problem can be formulated as follows. The first ob-jective function minimizes the total costs consists of the fixed costs of opening facilities, the transportation costs, the operation costs and the warehousing costs. The sec-ond objective function maximizes the total responsive-ness including the forward and reverse responsiveresponsive-ness of the integrated network.
Min Z1TC1TC2 and Max Z2 (1)
1
n n n n i i m m
TC
f W
a V n n j j i n j n j ng S
(2)jk
2 i ij ij j jk i j j k j kj kj i ji ji k j j i m jm jm j m TC cw CX X cy CU U cz CQ Q cr CP P cv CT T
(3) 3 j j j TC
WI WC (4)
2 * 1 * fk rk jk k j k R k kj k k k R j k Z U Q r d
d (5)(6)
(7)
(8) P (9)
J (10)
; jk k j U d k K
; kj k k j Q r d k K
; j ij j jk i k WI
X WI
U j J ; , jmp kjp m k T s Q j J p
(1 ) ; ji kj i k P s Q j
; ij i j X caw i I
(11)(12)
(13)
(14)
(15)
M (16)
(17)
I (18)
J (19)
M (20)
(21)
;
j ij j i
WI
X cay j J;
kj j k
Q caz j J
;
n n
i i i i
n
caw car
cap W i I;
n n
j j j j
n
cay caz
cap S j J;
n n
jm m m
j n
T V cav m
;
ji i j
P car i I
1;
n i n
W i
1;
n j n
S j
1;
n m n
V m
, , , , 0; , , ,
ji ij jk kj jm
P X U Q T i I j J k K m M
, , 0,1 ; , , ,
n n n i j m
W S V i I j J m M n N (22) The first and second objective functions (1) d st
ution Method
posed mixed integer program- emon-rate the considered total costs and total responsiveness in order. Term TC1 in (2) is the fixed opening costs of
production/recovery, distribution/collection and disposal centers. Term TC2in (3) denotes cost of transporting
products in forward and reverse networks and operation costs. Term TC3 in (4) stands for warehousing cost in
distribution/collection centers. The total responsiveness including the forward and reverse responsiveness of the integrated network is shown by (5). Constraints (6) and (7) ensure that the demands of all customers are satisfied and returned products from all customers are collected. Constraints (8)-(10) assure the flow balance at produc-tion/recovery, distribution/collection centers in forward and reverse flows. Equations (11)-(18) are capacity straints on facilities. Equations (18)-(20) are logical con-straints related to the different capacity levels. Finally, Constraints (21) and (22) enforce the binary and non- negativity restrictions on corresponding decision vari-ables.
4. Sol
In order to solve the pro
ming (MIP) problem, the branch and bound algorithm is applied by using LINGO software. Also, the bi-objective model is converted to the single objective model by using the bounded objective method and considering the sec-ond objective as a constraint. A desired definite mini-mum value, min
2
Z , is defined for total responsiveness which can b termined unanimously by distribu-tion/collection centers. Two constraints Z2Z2min,
2 1
Z
e de
have been incorporated in the propose
A ing to the definition that has been stated in [12], branch and bound algorithms for binary MIPs work by fixing the values of some (or all) of the binary variables and then solving the corresponding relaxation. The se-lected variables and their assigned values are determined based on an educated guess considering desired out-comes. The algorithm begins by solving the LP relaxa-tion for the original MIP. If there is no feasible solurelaxa-tion, then there is no feasible solution for the MIP so the algo-rithm terminates. If the solution to the LP relaxation happens to have the property that all of the binary vari-ables have values of either zero or one, then this is the optimal solution to the MIP, so the algorithm terminates. Considering the aforementioned points, in the next sec-tion a numerical example will be conducted for a data set. The efficacy and efficiency of the proposed model will be verified through this example.
5. An Illustrative Example
d model. ccord
and Discussions
example contains three potential production/recovery
olution is ;
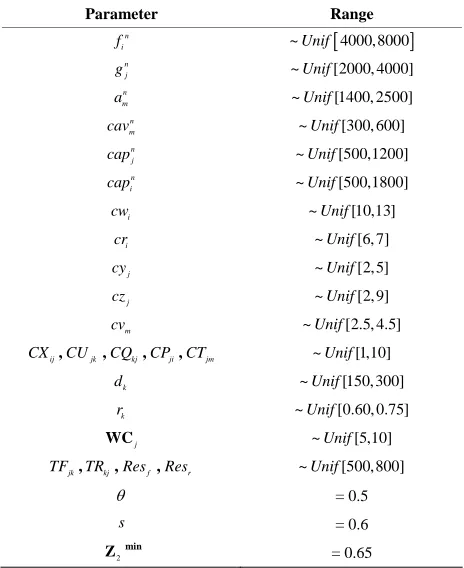
the proposed model is applied to a practical problem. The
centers, five potential distribution/collection (hybrid) cen- ters, three potential disposal centers and four customer zones. It is assumed that each facility have four possible capacity levels but the production, recovery, distribution, and collection capacity are continuous decision variables. Other parameters are generated randomly using uniform distributions specified in Table 1.The numerical example has been formulated by using the proposed MILP model. Subsequently the branch-and-bound solution procedure has been applied. The problem is solved to optimality using LINGO 8.0 software and ran on an Intel Core 2 Duo 2.5 GHz PC.
The computational results associated with a
global optimum s i 1 2 3
1 3 2
:
n
S S S = S3S4 1 ; : 13 1
n m
V V yields
3 4 4
: 1
n
W W W W
ue. The optimal ca llection roduction, a
1 2 3
j 4 5
60619 for the objective function val
-utio , p nd
re-covery operation are shown in Figures 2 and 3. Further-more a sensitivity analysis has been conducted on the vari-ous values of 2min
S
pacities for distrib n, co
[image:5.595.313.533.86.246.2]Z . Based on its results that are shown in Figure 4, it can be concluded that the global optimum value of the fi jective function (Total costs of supply chain) increases when the value of min
2
rst ob
[image:5.595.323.526.273.425.2]Z (which are set by distribution/collection centers) increases. Moreover, Figure 5 represents a sensitivity analysis o weighting factors
Table 1. The value of the parameters used in the example. n the
Parameter Range n
i
f ~Unif4000,8000
n j
g ~Unif[2000, 4000]
n m
a ~Unif[1400, 2500]
n m n
cav ~Unif[300, 600]
j
cap ~Unif[500,1200]
n i
cap ~Unif[500,1800]
i
cw ~Unif[10,13
[image:5.595.56.288.437.721.2]Figure 2. Allocated production and recovery capacity.
Figure 3. Allocated distribution and collection capacity.
] ]
]
]
]
i
cr ~Unif[6, 7
j
cy ~Unif[2, 5]
j
cz ~Unif[2, 9
m
cv ~Unif[2.5, 4.5]
ij
CX ,CUjk,CQ ,kj CP ,ji CT jm ~Unif[1,10 k
d ~Unif[150, 300]
k
r ~Unif[0.60, 0.75]
j
WC ~Unif[5,10
jk
TF ,TRkj,Resf,Resr ~Unif[500,800]
Figure 4. Sensitivity analysis related to various values of
min 2
Z (Minimum Responsiveness). p
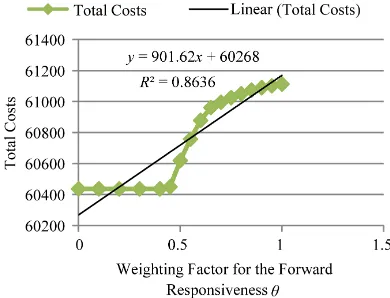
(im ortance) of the forward responsiveness (). Figure 5 irms the influence of import
conf ance of the forward
re-i
sponsiveness in total costs. As illustrated in F gures 6 and 7, it is noticeable that the increase in demand and return ratio increases the total costs of network. In addition, the total cost is more sensitive to demand compared with re-turn ratio. This result could be clarified by the impact of
= 0.5
s = 0.6
n
= 0.65
2
[image:5.595.319.524.452.594.2]demand on the both forward and reverse networks’ costs, but the increase in return ratio mean only influences the reverse network’s costs.
6. Conclusions and Future Research
The importance of network costs and responsiveness in vities ears. This supply chain management and reverse logistics acti has been significantly increased over the past y
[image:6.595.73.268.204.353.2]paper discusses forward/reverse logistics network design
[image:6.595.74.273.399.542.2] [image:6.595.72.273.578.699.2]Figure 5. Sensitivity analysis on various values of θ (Weight-ing Factor for the Forward Responsiveness).
Figure 6. Influence of return ratio of used products from customer zones on network costs.
Figure 7. Influence of demand on network costs.
by considering closed-loop integrated forward/reverse logistics network including production/recovery, distri-bution/collection, customer, and disposal centers. The proposed bi-objective model is able to integrate the for-ward and reverse network design decisions to avoid the sub-optimality which is a result of separated and sequen-tial designs. Computational results show that this MIP model can provide an efficient opportunity for managers to make proper decisions for designing logistics network among various facilities with various capacity levels. Thus, the proposed model can be used as a powerful ol in pra
efficient research in future. to ctical cases.
For future research the model can be expanded to in-clude the elements of risk and uncertainty involved in the reverse logistics network design problem. In addition, addressing the multi-objective treatments which explic-itly analyze the tradeoffs among cost, market potential and speedy returns in a multi-product integrated logistics network is a promising research avenue. Although exact solution for small incidents of the proposed model can be obtained by optimization software such as LINGO, meta- heuristic methods e.g. genetic algorithm (GA), are appli-cable for fast exploration in large scale problems and can be considered as an
REFERENCES
[1] A. Amiri, “Designing a Distribution Network in a Supply Chain System: Formulation and Efficient Solution Proce-dure,” European Journal of Operational Research, Vol. 171, No. 2, June 2006, pp. 567-576.
doi:10.1016/j.ejor.2004.09.018
[2] Y. Meepetchdee and N. Shah, “Logistical Network Design with Robustness and Complexity Considerations,” Inter-national Journal of Physical Distribution & Logistics Management, Vol. 37, No. 3, 2007, pp. 201-222.
[3] L. Meade, J. Sarkis and A. Presley, “The Theory and Prac-tice of Reverse Logistics,” International Journal of
Logis-tics System Ma , January 2007, pp.
56-84. doi:10. 0
nagement, Vol. 3, No. 1
1504/IJLSM.2007.01207
ics, Vol. 54, No. 8, [4] H. Üster, G. Easwaran, E. Akçali and S. Çetinkaya, “Ben- ders Decomposition with Alternative Multiple Cuts for a Multi-Product Closed-Loop Supply Chain Network De-sign Model,” Naval Reveres Logist
September 2007, pp. 890-907.
[5] P. Tsiakis and L. G. Papageorgiou, “Optimal Production Allocation and Distribution Supply Chain Networks,” In-ternational Journal of Production Economics, Vol. 111, No. 2, February 2008, pp. 468-483.
doi:10.1016/j.ijpe.2007.02.035
[6] D. Lee and M. Dong, “A Heuristic Approach to Logistics Network Design for End-of Lease Computer Products Recovery,” Transportation Research Part E, Vol. 44, No. 3, May 2008, pp. 455-474. doi:10.1016/j.tre.2006.11.003
niversity of Science and
Academy of Business g, New Orleans, 16-18 Under Uncertainty,” M.S. Dissertation, Department of In-dustrial Engineering, Iran U
Technology (IUST), Tehran, 2011.
[8] S. M. Seyed-Hosseini, L. T. Khajavi and A. Makui, “An Optimization Model to Develop an Integrated Logistics Network under Periodic Demand,”
Research, Spring 2011 Meetin
March 2011.
[9] H. Min, C. S. Ko and H. J. Ko, “The Spatial and Temporal Consolidation of Returned Products in a Closed-Loop Supply Chain Network,” Computers & Industrial Engi-neering, Vol. 51, No. 2, October 2006, pp. 309-320.
doi:10.1016/j.cie.2006.02.010
[10] F. Du and G. W. Evans, “A Bi-Objective Reverse Logis-tics Network Analysis for Post-Sale Service,” Computers
on of
puters & Industrial Engi-
& Operations Research, Vol. 35, No. 8, August 2008, pp. 2617-2634.
[11] F. Altiparmak, M. Gen, L. Lin and T. Paksoy, “A Genetic Algorithm Approach for Multi-Objective Optimizati Supply Chain Networks,” Com
neering, Vol. 51, No. 1, September 2006, pp. 196-215.
doi:10.1016/j.cie.2006.07.011