Kelvin
–
Helmholtz Instability and Alfv
é
nic Vortex Shedding in Solar Eruptions
P. Syntelis1 and P. Antolin2,1
1
St Andrews University, Mathematics Institute, St Andrews KY16 9SS, UK;[email protected]
2
Department of Mathematics, Physics and Electrical Engineering, Northumbria University, Newcastle Upon Tyne NE1 8ST, UK
Received 2019 July 19; revised 2019 September 5; accepted 2019 September 12; published 2019 October 3
Abstract
We report on a three-dimensional MHD numerical experiment of a small-scale coronal mass ejection(CME)-like eruption propagating though a nonmagnetized solar atmosphere. We find that the Kelvin–Helmholtz instability
(KHI) develops at various but specific locations at the boundary layer between the erupting field and the background atmosphere, depending on the relative angle between the velocity and magneticfield. KHI develops at the front and at two of the four sides of the eruption. KHI is suppressed at the other two sides of the eruption. We alsofind the development of Alfvénic vortex sheddingflows at the wake of the developing CME due to the 3D geometry of thefield. Forward modeling reveals that the observational detectability of the KHI in solar eruptions is confined to a narrow≈10°range when observing off-limb, and therefore its occurrence could be underestimated due to projection effects. The newfindings can have significant implications for observations, for heating, and for particle acceleration by turbulence fromflow-driven instabilities associated with solar eruptions of all scales.
Unified Astronomy Thesaurus concepts:Magnetohydrodynamics(1964);Solar activity(1475);Solar active regions(1974);Solar atmosphere (1477);Solar atmospheric motions(1478);Solar corona(1483);Solar coronal mass ejections(310);Solar magnetic flux emergence(2000);Solar magnetic fields(1503); Magnetohydrodyna-mical simulations(1966)
1. Introduction
The Kelvin–Helmholtz instability (KHI) can occur at the boundary layer between two moving fluids, when the velocity shear between them is such that it overcomes the surface tension of the boundary layer. KHI is a very common physical process and has been associated with many astrophysical systems, such as, for example, planetary magnetospheres
(Hasegawa et al. 2004; Masters et al. 2010; Slavin et al.
2010), astrophysical jets(e.g., Ferrari et al. 1981; Bodo et al.
1994), and disks(e.g., Balbus 2003; Johansen et al.2006). In solar-related phenomena, KHI has been observed at theflanks of coronal mass ejections (CMEs; Foullon et al. 2011, 2013; Möstl et al.2013), in the dimming regions associated with solar eruptions(Ofman & Thompson2011), at the sides of solar jets
(Kuridze et al. 2016; Li et al. 2018, 2019), and at coronal streamers (Feng et al.2013). KHI can play a very important role in the development of turbulence, the mixing and heating of plasma(e.g., Heyvaerts & Priest1983; Terradas et al.2008; Antolin et al.2016; Fang et al.2016), and particle acceleration
(Leroy et al.2018).
The threshold and growth rate of KHI at the boundary layer between two horizontal magnetized flows was derived analytically by Chandrasekhar (1961). The theory has been since extended for flux tubes in the solar convection zone
(Tsinganos 1980), for boundaries between a twisted flux tube and a twisted or a horizontal externalfield(Zaqarashvili et al.
2014a,2014b,2015; Zhelyazkov et al.2015a,2015b), and also for the effects of partial ionization (Martínez-Gómez et al.
2015). A major point from the theory is that the onset and the growth rate of KHI depend on the angle between the shearflow and the magneticfield at the boundary layer. KHI can develop easier in a shear flow perpendicular to a magnetic field, whereas KHI can be suppressed in a shear flow parallel or antiparallel to a magnetic field(e.g., Hillier et al.2019).
KHI in the context of solar eruptions has been studied using models that describe shearflows between two vertical regions, mimicking locally the boundary layer of theflank of a CME
(Ofman & Thompson 2011; Nykyri & Foullon 2013; Möstl et al.2013; Gómez et al.2016). In another approach, KHI has been studied by assuming magnetic cylinders moving through a model atmosphere, mimicking the ejection of a flux rope
(Pagano et al.2007). Such models have the advantage of being easy to implement. As such, they are useful to perform controlled parametric studies. However, the magneticfield of a full 3D CME eruption is significantly more complicated than such idealized configurations(e.g., Syntelis et al.2017). In this study, we report on the first 3D MHD simulation of a solar eruption showing the development of KHI at the boundary layer between the erupting field and the background atmos-phere. We show that the KHI only develops at specific boundaries where the shearflow is mostly perpendicular to the local magneticfield, with important implications for assessing its occurrence as well as the generation of turbulence during CME propagation.
2. Model
The model used in this Letter is described in detail in Syntelis et al.(2017,2019). We use Lare3d(Arber et al.2001)to solve the 3D time-dependent, resistive, and compressible MHD equations in Cartesian geometry. The equations, resistivity form, and normal-ization can be found in Syntelis et al.(2017).
The numerical domain has a physical size of 1533Mm
(10003grid points). The boundary conditions are periodic in they-direction and open in thex-direction. In thez-direction the boundaries are open (closed) for the top (bottom) of the domain.
The domain consists of a solar interior and a solar atmosphere. The interior is a convective stable and adiabatically stratified layer between −7.2 Mmz<0 Mm. The atmospheric temperature
follows a hyperbolic tangent profile for the temperature, mimicking an isothermal photospheric–chromospheric layer (0 Mmz< 1.8 Mm), a transition region (1.8 Mmz<3.2 Mm), and an isothermal corona(3.2 Mmz<145.8 Mm). The atmospheric density and pressure are derived by assuming hydrostatic equilibrium.
A horizontalflux tube is positioned inside the solar interior, along the y-direction, at z=−2.1 Mm. The flux tube’s magnetic field in cylindrical coordinates is
( ) ( )
=
-By B0exp r2 R2 , 1
( )
a
=
f
B rBy, 2
where R=450 km is the tube’s radius,r is the radial distance from the tube axis,α=0.0023 km−1is a proxy of the twist of the tube, andB0=2400 G is the magneticfield strength at its center. The flux tube is initially in pressure equilibrium. To initiate the emergence of theflux tube a density deficit is imposed along the tube’s axis(e.g., Fan2001):
( )
( ) ( ) ( ) ( )
r r l
D = p r
-p z z exp y , 3
t 2 2
wherep is the external pressure,ptis the total pressure within the flux tube, and λ=0.9 Mm is the length scale of the buoyant part of the flux tube.
The formation of KHI depends on the relative angle of the shearflow and the direction of the magneticfield. We assume a nonmagnetized background atmosphere to assess the locations at the surface of the eruption where KHI can develop, solely due to the direction of the eruptingfield, without the influence of a preferred direction imposed by an ambient field. The inclusion of an ambientfield can potentially affect the locations where KHI develops and make KHI less prominent (e.g., Pagano et al.2007; see Section4).
The real viscosity in the solar corona is estimated to be many orders of magnitude smaller than the numerical viscosity in our simulation. Unrealistically high viscosities can suppress the formation of KHI by significantly reducing the velocity shear between the two interfaces(e.g., Howson et al.2017a; Antolin & Van Doorsselaere 2019). It is possible that with higher spatial resolution and correspondingly lower numerical visc-osity, additional KHI could be obtained in our model. In this study, we have not examined the effects of resolution and numerical viscosity to the development of KHI as it would be very demanding computationally.
3. Results
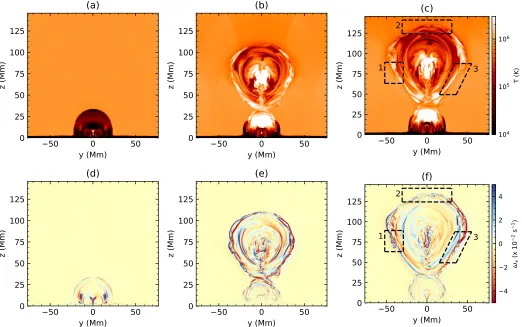
Figure1shows the time evolution of the temperature(first row) andx-component of the vorticity(second row)before and during the eruption. The top left panel shows the temperature distribution at the vertical midplane, inside which a low-lying flux rope is located. Thisflux rope has been formed by the low-lying gradual tether-cutting reconnection of sheared lines (details in Syntelis et al. 2017, 2019). During the eruption (middle column), the erupting field(structure between 30<z<110 Mm, (b)) devel-ops a hot edge layer (outer part of the field). We will refer to the outermost part of the edge as the boundary layer between the magnetized eruption and the nonmagnetized atmosphere. The temperature at the very edge of the boundary layer is cooler than that of the background atmosphere, and cooler than that of the hot edge part of the eruption. This is due to the adiabatic expansion of
this part of the boundary layer, as thefield strength there decreases to zero.
During the eruption, the eruptingfield displaces the atmo-spheric material above it. The displaced material is pushed away from the uppermost part of the erupting field and then down beside the sides of the eruption. Therefore, velocity shear develops at the boundary layer, both by the upward velocity of the eruptingfield and by the sideways and downward velocity of the displaced material. This velocity shear can be seen as regions of high vorticity(Figures1(d)–(f)).
KHI develops at three locations at the boundary layer
(Figures1(c),(f)). Regions 1 and 3 are the left and rightflank of the eruption when observing the structure along the +x -direction. Region 2 is the upper part of the erupting field. There, KHI vortices are larger in size.
Region 1 is examined in more detail in Figure 2. The temperature (a)and density(b)of the wave-like features take values between that of the background atmosphere and that of the boundary layer prior to the development of the waves
(Figure1(b)). However, KHI has not yet developed enough to mix the hot edge of the eruption (right of the wave-like features) with the atmosphere(left of the wave-like features). This is similar to the initial stage of the mixing found in simulations of KHI in coronal loops due to transverse MHD waves(e.g., Antolin et al.2014; Howson et al.2017a,2017b; Karampelas et al. 2017). The plasma β inside the vortices, although mostly high(blue/white, panel(c)), increases locally at the fronts of the waves (white/red), indicating the local compression of the plasma due to the instability.
Panel (d) shows the ωx component of the vorticity. The wave-like features have mostly positiveωx(blue), indicating a consistent counterclockwise rotation in the yz-plane. This rotation is also reflected in the streamlines of the planar velocityfield(green lines,(e)). The negative values ofωx(red) near the base of the wave-like features are associated mostly with shearing and not with an actual rotation.
Inside the central part of two lower wave-like features
(z≈70–75 Mm),ωxchanges sign. This is due to the off-plane motion of the vortices, indicating that the KHI vortices have a 3D structure. To examine that off-plane motion, we plot the ratio of the magnitude of the planar velocity over the magnitude of the total velocity(panel(e)). White indicates a planarflow, and dark blue indicates aflow away from the plane. Similarly, in panel(f)we plot the planar magneticfield strength over the total magnetic field strength. The velocity field shows a component away from the plane, contrary to the magneticfield, implying that the velocity shear is at an angle locally to the magnetic field, therefore favoring the development of KHI. Also, the KHI features develop internally a 3D structure where the velocity, magnetic, and vorticity fields have strong off-plane components.
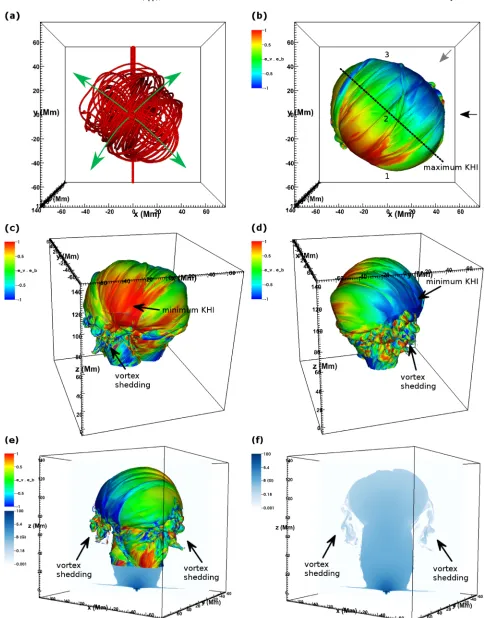
We now examine the 3D structure of the whole boundary layer of the eruption(Figure3). In panel(a), we trace magnetic
field lines from the edges of the eruption(not the KHI regions). The eruption displaces the material above it and, moving it away from the apex of the eruption, toward every direction
(green arrows). In some locations theflow is perpendicular to the magneticfield(favoring KHI), while in other locations the
field. Green indicates the locations favoring KHI, while red and blue indicate the locations not favoring KHI. The 3D visualization reveals that a significant part of the surface of the eruption is covered with wave-like features of different sizes, thereby corrugating the surface. These features have maximum amplitude approximately along the dashed line, where vˆ · ˆB»0. The numbers 1, 2, 3 denote approximately the locations of the 2D boxes of Figure 1. Moving from the green regions toward the red (c) or blue (d) regions, the amplitudes of the wave-like features decrease and eventually become zero(arrows showing minimum KHI). As a result, at the two sides of the eruption associated with the red and blue regions, there are no signs of KHI. At the two other sides, the
field geometry is such that the KHI develops. The complex 3D structure of KHI at various locations on the surface of the eruption implies that projection effects could be highly influencing the observational detection of these features.
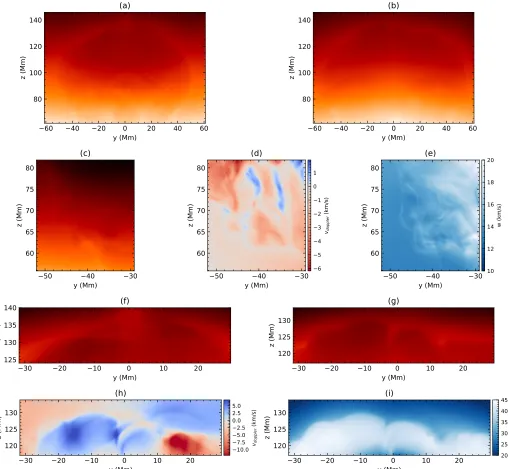
To assess the projection effects, we produce synthetic observations of FeIX along two lines of sight using the FoMo code (Van Doorsselaere et al. 2016; Figure 4), one being perpendicular to the plane of Figure 1(x-axis, 90°angle; see the black arrow in Figure3(b)). At that angle regions 2 and 3 show no sign of KHI (a). Panels (c)–(e)show the line intensity, Doppler velocity, and line width of region 1(comparable to Figure2). For simplicity, the spectral features have been obtained byfitting single Gaussians to the spectral profiles. However, the KHI introduces multiple spectral components, and the Doppler velocities shown here do not represent the extrema. These are represented by the broad line widths obtained from the single Gaussianfits, which are
mostly of nonthermal origin. The KHI features are visible in the intensity image; however, they are more prominent in the Doppler velocity and line width images. The second line of sight is approximately perpendicular to the maximum KHI line of Figure3(b) (45°angle, gray arrow). Region 2 now shows some undulating features, whereas regions 1 and 3 do not show signs of KHI. Panels(f)and(g)show a close-up of region 2 for the two angles. In panel(f)there is no indication of KHI. In panel(g), the undulating feature is present; however, it does not appear as KHI waves, as they are“smoothed”due to the integrating effect of the optically thin radiation across the complex region of the top of the eruption. Therefore, observations of such features are not likely to be associated with KHI. The Doppler velocity(h)and line width(i) at the 45°angle again produce clear signatures of these undulating features, however, without showing characteristic KHI crests. The complexity of region 2 can be witnessed in the line width, where the emission from plasmaflowing at different directions results in very wide line profiles with high nonthermal broadening.
To further assess the projection effects, in Figure5 we show the line intensity of region 2 for nine angles between 10°and 90°. The undulating features appear more clearly between 40° and 50°and become smoothed away from these angles. In general, for lower-resolution and noisier data, such features would be further degraded. Similar results are obtained for regions 1 and 3. Therefore, current observations might be underestimating the presence of KHI in solar eruptions due to line-of-sight projection and resolution effects.
[image:3.612.47.569.52.379.2]Alfvénic vortex shedding developing at two of the sides of the eruption (“vortex shedding” arrows). These regions are more clearly shown in Figure3(e). In panel(f), we plot the magnetic
field strength at a vertical slice through the vortex shedding regions of panel (e). At the two sides of panels(e),(f), thefield geometry is such that the“legs”and the upper part of the eruption form two convex regions. Theflow moving around the sides of the upper part of the eruption and toward the narrow point between the convex regions becomes turbulent. The drag forces deform the boundary layer, forming these characteristic thin and turbulent structures associated with vortex shedding(Bonet et al.
2008; Nakariakov et al.2009; Gruszecki et al.2010).
4. Discussion
We have presented results on the formation of KHI and vortex shedding in a simulation of a small-scale solar eruption. The results demonstrate that using a realistic 3D model of a solar eruption is crucial to assess the formation and the effects of KHI and other flow-driven instabilities in the local development of turbulence, the heating of plasma, and any possible effects associated with such processes (e.g., small-scale reconnection, local acceleration of particles; Nykyri & Otto 2004; Fang et al.
2016; Leroy et al.2018; Páez et al.2019).
The reported simulations have been performed in a nonmagnetized atmosphere. Adding an ambient field would affect the formation of KHI(e.g., Pagano et al.2007). Changes on the local plasma properties at the boundary layer(e.g., shear velocity, boundary layer width, relative magneticfield orienta-tion, magneticfield strength, compressibility of thefluid, etc.)
can lead to, e.g., changes in the growth rate of the instability and affect the sizes, shapes, and mixing of the vortices. Such effects can make the instability less prominent or even suppress it, depending on the specific local properties (e.g., Miura & Pritchett1982; Ryu et al. 2000; Möstl et al. 2013; Nykyri & Foullon2013; Tian & Chen2016; Faganello & Califano2017; Ma et al. 2017). Also, an ambient field would affect the motions of the displaced material, changing the angle of the shear and thus affecting the locations where KHI can develop. Möstl et al. (2013) showed that depending on the relative angles between the magneticfield and the velocity shear along both sizes of a horizontal magnetized layer, the layer could become unstable at only one of its two sides. Given the complexity of the 3D magnetic field of a solar eruption
(Figure3(a)), the presence of an ambientfield could potentially suppress KHI in one of the two unstable sides of the eruption, allowing KHI to develop only in one side of the eruption, similar to the observations of Foullon et al.(2011). However, our results strongly suggest that such a case can be easily attributed to projection effects resulting from the line of sight of the observation. Such possibilities can only be examined by properly modeling the 3Dfield of the solar eruption.
On the other hand, we expect Alfvénic vortex shedding to be largely independent of the external magnetic field, since its occurrence is solely due to the presence of a sharp obstacle with respect to the flow direction (convex regions in our simulation).
[image:4.612.46.569.53.363.2]Forward modeling of the eruption revealed that the projection effects associated with optically thin observations of solar Figure 2.Close-up of region 1, shown in Figure1.(a)Temperature,(b)density,(c)plasmaβ, and(d)x-component of the vorticity.(e)The magnitude of the planar velocity over the total velocity. Overplotted are streamlines of the planar velocityfield.(f)The magnitude of the planar magneticfield over the total magneticfield. Overplotted is the planar magneticfield vector.
Figure 3. (a)Sample field lines of the eruption (red). Green arrows indicate the direction of the velocityfield in thexy-plane. (b) Isosurface of vorticity at
∣ ∣w =1.75´10-2s-1, colored byvˆ · ˆB. Dashed line shows the region wherevˆ · ˆB»0(maximum KHI). Labels 1, 2, 3 indicate the approximate location of regions
1, 2, 3 of Figure1(f). Black and gray arrows indicate the lines of sight used in Figure4. Panels(c),(d)are side views of panel(b). Arrows indicate regions where
ˆ · ˆ »
eruptions can significantly underestimate the presence of KHI in solar eruptions. This provides a simple explanation for the scarcity of the detection of KHI features in observations of solar eruptions. On the other hand, corrugated CME fronts produced by KHI as in our model may have easily been disregarded, interpreted simply by differential CME expansion or other effects. Spectral diagnostics could potentially provide better evidence of KHI-related features than imaging diagnostics.
The studied eruption has the energy and physical scale of a small-scale eruption. Its magneticfield strength is expected to be weaker than that of a larger eruption. Therefore, it is possible that KHI develops easier at the periphery of smaller and less energetic events(including jets; e.g., Li et al.2018,2019), at least while the erupting fields are still located close to the solar surface so that
they are observed by EUV imagers and spectrometers. The formation of the KHI in small-scale eruptions can be a very useful local and global diagnostic to probe the magneticfield and local plasma properties of these events. This is further so, given that the KHI is highly sensitive to the angle between the velocity shear and the local magneticfield, thereby providing information on the global magneticfield topology.
Similar eruptions to the studied one can be produced in higher energies in a multiscale manner following a power-law distribu-tion(Syntelis et al.2019). For larger-scale eruptions, the magnetic
[image:6.612.51.560.51.520.2]field could be strong enough so that KHI develops less frequently closer to the solar surface. However, depending on the properties of the eruption, KHI could also develop away from the lower solar atmosphere, during the eruption’s expansion and propagation Figure 4.Synthetic observations of FeIXfor two lines of sight, one perpendicular to the plane of Figure1(x-axis, 90°polar angle, panels(a),(c),(d),(e),(f))and another approximately perpendicular to the maximum KHI line of Figure3(b) (45°polar angle, panels(b),(g),(h),(i)).((a),(b))Line intensity showing the whole eruption.((c)–(e))Line intensity, Doppler velocity, and line width of region 1.(f)Line intensity of region 2 at 90°angle.((g)–(i))Line intensity, Doppler velocity, and line width of region 2 at 45°angle.
inside the solar wind(Páez et al.2017), as the shearing between a CME and the solar wind could be appropriate for the formation of KHI (Manchester et al. 2005). Therefore, our results should be applicable to larger-scale eruptions showing KHI either closer to or farther away from the solar surface.
The presence of turbulence in the solar wind and the existence of a shock and an expanding CME front is often invoked to explain the acceleration of particles associated with these events (Bemporad & Mancuso 2011). The generated turbulence associated with the KHI and Alfvénic vortex shedding as well as the resulting corrugated CME front demonstrated in our model should therefore be considered for turbulence and particle acceleration studies.
This work was supported by computational time granted from the Greek Research & Technology Network(GRNET)in the National HPC facility—ARIS. P.A. acknowledges funding from his STFC Ernest Rutherford Fellowship (No. ST/ R004285/1). P.S. acknowledges support by the ERC synergy grant “The Whole Sun.”
ORCID iDs
P. Syntelis https://orcid.org/0000-0002-6377-0243
P. Antolin https://orcid.org/0000-0003-1529-4681
References
Antolin, P., De Moortel, I., Van Doorsselaere, T., & Yokoyama, T. 2016,
ApJL,830, L22
Antolin, P., & Van Doorsselaere, T. 2019,FrP,7, 85
Antolin, P., Yokoyama, T., & Van Doorsselaere, T. 2014,ApJL,787, L22
Arber, T., Longbottom, A., Gerrard, C., & Milne, A. 2001,JCoPh,171, 151
Balbus, S. A. 2003,ARA&A,41, 555
Bemporad, A., & Mancuso, S. 2011,ApJL,739, L64
Bodo, G., Massaglia, S., Ferrari, A., & Trussoni, E. 1994, A&A,283, 655
Bonet, J. A., Márquez, I., Sánchez Almeida, J., Cabello, I., & Domingo, V. 2008,ApJL,687, L131
Chandrasekhar, S. 1961, Hydrodynamic and Hydromagnetic Stability(Oxford: Clarendon)
Faganello, M., & Califano, F. 2017,JPlPh,83, 535830601
Fan, Y. 2001,ApJL,554, L111
Fang, X., Yuan, D., Xia, C., Van Doorsselaere, T., & Keppens, R. 2016,ApJ,
833, 36
Feng, L., Inhester, B., & Gan, W. Q. 2013,ApJ,774, 141
Ferrari, A., Trussoni, E., & Zaninetti, L. 1981,MNRAS,196, 1051
Foullon, C., Verwichte, E., Nakariakov, V. M., Nykyri, K., & Farrugia, C. J. 2011,ApJL,729, L8
Foullon, C., Verwichte, E., Nykyri, K., Aschwanden, M. J., & Hannah, I. G. 2013,ApJ,767, 170
Gómez, D. O., DeLuca, E. E., & Mininni, P. D. 2016,ApJ,818, 126
Gruszecki, M., Nakariakov, V. M., van Doorsselaere, T., & Arber, T. D. 2010,
PhRvL,105, 055004
Hasegawa, H., Fujimoto, M., Phan, T. D., et al. 2004,Natur,430, 755
Heyvaerts, J., & Priest, E. R. 1983, A&A,117, 220
Hillier, A., Barker, A., Arregui, I., & Latter, H. 2019,MNRAS,482, 1143
Howson, T. A., De Moortel, I., & Antolin, P. 2017a,A&A,602, A74
Howson, T. A., De Moortel, I., & Antolin, P. 2017b,A&A,607, A77
Johansen, A., Henning, T., & Klahr, H. 2006,ApJ,643, 1219
Karampelas, K., Van Doorsselaere, T., & Antolin, P. 2017,A&A,604, A130
Kuridze, D., Zaqarashvili, T. V., Henriques, V., et al. 2016,ApJ,830, 133
Leroy, M., Ripperda, B., & Keppens, R. 2018, JGRA Advance Online Publication
Li, X., Zhang, J., Yang, S., & Hou, Y. 2019,ApJ,875, 52
Li, X., Zhang, J., Yang, S., Hou, Y., & Erdélyi, R. 2018,NatSR,8, 8136
Ma, X., Delamere, P., Otto, A., & Burkholder, B. 2017,JGRA,122, 10382
Manchester, W. B., I., Gombosi, T. I., De Zeeuw, D. L., et al. 2005,ApJ,
622, 1225
Martínez-Gómez, D., Soler, R., & Terradas, J. 2015,A&A,578, A104
Masters, A., Achilleos, N., Kivelson, M. G., et al. 2010,JGRA,115, A07225
Miura, A., & Pritchett, P. L. 1982,JGR,87, 7431
Möstl, U. V., Temmer, M., & Veronig, A. M. 2013,ApJL,766, L12
Nakariakov, V. M., Aschwanden, M. J., & van Doorsselaere, T. 2009,A&A,
502, 661
Nykyri, K., & Foullon, C. 2013,GeoRL,40, 4154
Nykyri, K., & Otto, A. 2004,AnGeo,22, 935
Ofman, L., & Thompson, B. J. 2011,ApJL,734, L11
Páez, A., Jatenco-Pereira, V., Falceta-Gonçalves, D., & Opher, M. 2017,ApJ,
851, 112
Páez, A., Jatenco-Pereira, V., Falceta-Gonçalves, D., & Opher, M. 2019,ApJ,
879, 122
Pagano, P., Reale, F., Orlando, S., & Peres, G. 2007,A&A,464, 753
Ryu, D., Jones, T. W., & Frank, A. 2000,ApJ,545, 475
Slavin, J. A., Anderson, B. J., Baker, D. N., et al. 2010,Sci,329, 665
Syntelis, P., Archontis, V., & Tsinganos, K. 2017,ApJ,850, 95
Syntelis, P., Archontis, V., & Tsinganos, K. 2019,ApJ,876, 61
Terradas, J., Andries, J., Goossens, M., et al. 2008,ApJL,687, L115
Tian, C., & Chen, Y. 2016,ApJ,824, 60
Tsinganos, K. C. 1980,ApJ,239, 746
Van Doorsselaere, T., Antolin, P., Yuan, D., Reznikova, V., & Magyar, N. 2016,FrASS,3, 4
Zaqarashvili, T. V., Vörös, Z., Narita, Y., & Bruno, R. 2014a,ApJL,783, L19
Zaqarashvili, T. V., Vörös, Z., & Zhelyazkov, I. 2014b,A&A,561, A62
Zaqarashvili, T. V., Zhelyazkov, I., & Ofman, L. 2015,ApJ,813, 123
Zhelyazkov, I., Zaqarashvili, T. V., & Chandra, R. 2015a,A&A,574, A55
[image:7.612.45.571.53.154.2]Zhelyazkov, I., Zaqarashvili, T. V., Chandra, R., Srivastava, A. K., & Mishonov, T. 2015b,AdSpR,56, 2727