Longevity is a trait of increasing importance in dairy cow breeding and selection. Longevity has its important economic value within dairy cattle breeding schemes (Essl, 1998). In the literature, various definitions of longevity and many differ-ent methods of analysis are used, and results differ greatly. Longevity traits are usually divided into two classes: lifetime and stayability. Lifetime traits are as follows: herd life (HL) – the interval between birth and culling, productive life (PL) or length of productive life – the interval between first calving and culling, total milk production – lifetime milk production summed up over lactations, number of days in lactation – lifetime milking days to-talled over lactations, and the number of lacta-tions. Stayability traits usually comprise survival to a certain number of months of age (e.g. 36 or
72 months of age) or stayability to a certain number of months after first calving (e.g. 12, 36 months of PL, etc.), and survival to a certain lactation (Vollema, 1998). Longevity traits can be corrected for milk production, thus aiming to give better measurements of involuntary culling (Dekkers, 1993). Corrected traits are also called “functional” traits (Vollema, 1998).
The study of relationships between animal lon-gevity and other characteristics and traits is of cru-cial importance and is aimed at the improvement of selection response. In this respect, type traits are particularly important, and linear type clas-sification systems are a part of animal evaluations in most countries with a developed dairy industry (Mark, 2004). Efficient selection for longevity is, however, rather difficult because in a real time it
Supported by the Ministry of Agriculture of the Czech Republic (Project No. NAZV 1G46086).
Relationships between conformation traits and
longevity of Holstein cows in the Czech Republic
M. Vacek, M. Štípková, E. Němcová, J. Bouška
Research Institute of Animal Production, Prague-Uhříněves, Czech Republic
ABSTRACT: The relationships between conformation traits and longevity traits were analyzed in 41 489 Holstein cows born in the years 1994–1999 which were culled by 30th June 2005. Pearson correlation coefficients between type traits and the herd life or productive life of cows were calculated. The effects of type trait scoring level on the length of productive life were described by means of analyses of variance. The observed correlations between herd life or productive life and type traits are in the range of –0.061 to 0.160. Negative correlations were found for rump angle, rear leg set, udder depth, and teat length. Most of the body traits had slightly positive relation-ships to herd life, indicating that larger cows live longer. However, body depth and chest width did not have a linear relation to longevity traits. The longest productive life was found in cows undersized in chest width and body depth (P < 0.01). A similar dependence was also found for rump width (P < 0.01). The ideal rear leg set for longevity was scored as average or below average, i.e. moderately curved or slightly straight legs (P < 0.05). Cows with well-attached fore udder, high attached rear udder, strong central ligament, close front teat placement, and with moderately long teats showed the longest functional productive life (P < 0.05–0.001). Linear relationships between longevity traits and general conformation characteristics were found as well.
is not possible to obtain estimated breeding values of sires on the basis of direct longevity of their daughters. Selection can therefore be realized only indirectly through type traits which are correlated to longevity.
According to a number of authors, the relationship between longevity and some type traits is evident. For example, Vollema and Groen (1997) found a non-linear relationship between udder depth, central ligament, teat placement and foot angle. Similar con-clusions were reported by Vukasinovic et al. (1994), Cruickshank et al. (2002), Vukasinovic et al. (2002) and Tsuruta et al. (2005). Strapák et al. (2005) and Bouška et al. (2006) confirmed significant correla-tions between longevity and udder traits.
A possibility of using indirect information to predict the cow’s longevity and its breeding value appears to be efficient. The present study brings together relationships between selected linear type traits and longevity of Holstein cows in the Czech Republic.
MATERIAL AND METHODS
Holstein cows born in the years 1994–1999 with their first calvings in 1 685 herds in the period from 1996 to 2002 were included in the data set (n = 47 923). All cows were scored by the classifiers of the Czech and Moravian Breeders Association (CMSCH) for the following linear type traits:
Trait 1 point 9 points Angularity Lacks angularity Very angular
Stature Short Tall
Chest width Narrow Wide Body depth Shallow Deep
Rump angle High pins Extreme slope Rump width Narrow Wide
Rear legs side view (rear legs set)
Straight Sickled
Foot angle Very low Very steep Fore udder attachment Weak Strong Rear udder height Low High Central ligament Indistinct Deep Udder depth Deep Shallow Front teat placement Wide Narrow Teat length Short Long
Four body measurements (withers height, height at sacrum, chest girth, and body length) were also
measured. In addition, 5 general characteristics were evaluated and the final score was determined. Dairy character, body capacity, rump, feet and legs, and udder were scored in the range of 50 to 100 points. Production traits (milk yield and fat and protein percentage and yield) in the first lactation, date of first calving and culling were determined. For the analysis of the relationship between type traits and longevity, cows culled by 30th June 2005
(n = 41 489) were used.
Analysed data were corrected in the following way:
(a) Milk yields in kg were adjusted by the equa-tion with fixed effect of Herd-Year-Season of the first calving (HYS) and linear regression on age at the first calving. Afterwards the cows were divided on the basis of adjusted milk yield in the first lactation into three classes (< 5 750 kg; 5 750–6 950 kg; 6 950 kg of milk).
(b) Linear type traits, body measures and general type characteristics were adjusted by the equa-tion with fixed effect of Herd-Year of type clas-sification, quadratic regression on the number of days between calvings, and type classifica-tion and linear regression on age at the first calving. Cows were divided on the basis of the adjusted scoring of traits or characteristics into five classes.
(c) The length of herd life (HL) or production life (PL) of cows was adjusted by the equation with fixed effect of HYS and fixed effect of adjusted milk yield (see par (a).
The relationships between conformation traits and herd life and/or production life of cows were calculated by the model equation:
Y Xo^
var(e) = R = Iσ2
e
E
[ ]
=[ ]
e 0 [X´X][o^ ] = [X´Y]where:
Y = the vector of functional HL or PL
o^ = the vector of fixed effect (alternative traits)
X = the incidence matrix of fixed effects
e = the residuum
RESULTS AND DISCUSSION
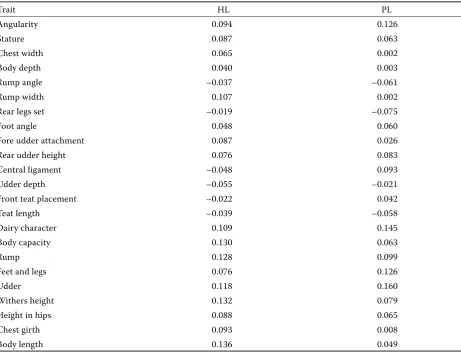
The relation between conformation traits and herd life (HL), and length of productive life (PL) were assessed by Pearson residual correlations given in Table 1. The length of herd life and pro-ductive life showed positive correlations with most linear type traits excluding rump angle, rear leg set-side view, udder depth, and teat length, which were negative. Similar results were published by Brotherstone and Hill (1991). However, these au-thors found positive correlations for udder depth. Negative correlations of central ligament and teat placement were found only with HL. The highest positive correlation coefficients were between HL and four general characteristics (r = 0.118–0.130), while in feet and legs the correlation was lower (r = 0.076). High positive correlations were also found for withers height and body length. For PL the correlation coefficients were higher in angular-ity, foot angle, fore udder attachment, teat
place-ment, dairy character, feet and legs, and udder in comparison with HL. Vice versa, lower coefficients were found mainly in chest width, body depth, fore udder attachment, body capacity, rump and in all measures for the length of PL. Generally, our results are in agreement with correlations published by Vollema and Groen (1997), Vollema (1998), Strapák et al. (2005), and others.
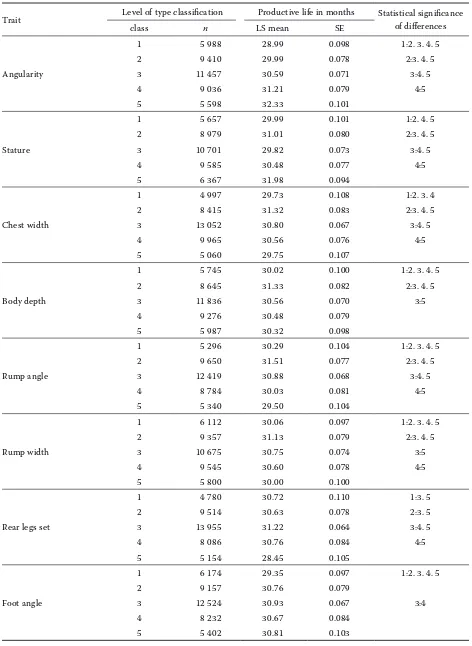
[image:3.595.67.529.406.759.2]Relations between conformation traits and lon-gevity can be better demonstrated by the length of productive life depending on the level of classifica-tion in individual type traits. Table 2 contains PL in months according to the point scoring of linear type traits. In the case of angularity, PL increased with the number of points in linear scoring. This means that more angular cows had longer PL. This result is in discrepancy with the conclusions of other authors, who usually reported a nonlinear relationship between angularity and cow longevity. For example, Hamoen (2002) described the lowest culling rate in cows with a moderate scoring of
Table 1. Pearson correlation coefficients (r) between conformation traits and herd life (HL), and length of produc-tive life (PL)
Trait HL PL
Angularity 0.094 0.126
Stature 0.087 0.063
Chest width 0.065 0.002
Body depth 0.040 0.003
Rump angle –0.037 –0.061
Rump width 0.107 0.002
Rear legs set –0.019 –0.075
Foot angle 0.048 0.060
Fore udder attachment 0.087 0.026
Rear udder height 0.076 0.083
Central ligament –0.048 0.093
Udder depth –0.055 –0.021
Front teat placement –0.022 0.042
Teat length –0.039 –0.058
Dairy character 0.109 0.145
Body capacity 0.130 0.063
Rump 0.128 0.099
Feet and legs 0.076 0.126
Udder 0.118 0.160
Withers height 0.132 0.079
Height in hips 0.088 0.065
Chest girth 0.093 0.008
Table 2. Effect of linear type trait score on the length of productive life
Trait Level of type classification Productive life in months Statistical significance of differences
class n LS mean SE
Angularity
1 5 988 28.99 0.098 1:2. 3. 4. 5
2 9 410 29.99 0.078 2:3. 4. 5
3 11 457 30.59 0.071 3:4. 5
4 9 036 31.21 0.079 4:5
5 5 598 32.33 0.101
Stature
1 5 657 29.99 0.101 1:2. 4. 5
2 8 979 31.01 0.080 2:3. 4. 5
3 10 701 29.82 0.073 3:4. 5
4 9 585 30.48 0.077 4:5
5 6 367 31.98 0.094
Chest width
1 4 997 29.73 0.108 1:2. 3. 4
2 8 415 31.32 0.083 2:3. 4. 5
3 13 052 30.80 0.067 3:4. 5
4 9 965 30.56 0.076 4:5
5 5 060 29.75 0.107
Body depth
1 5 745 30.02 0.100 1:2. 3. 4. 5
2 8 645 31.33 0.082 2:3. 4. 5
3 11 836 30.56 0.070 3:5
4 9 276 30.48 0.079
5 5 987 30.32 0.098
Rump angle
1 5 296 30.29 0.104 1:2. 3. 4. 5
2 9 650 31.51 0.077 2:3. 4. 5
3 12 419 30.88 0.068 3:4. 5
4 8 784 30.03 0.081 4:5
5 5 340 29.50 0.104
Rump width
1 6 112 30.06 0.097 1:2. 3. 4. 5
2 9 357 31.13 0.079 2:3. 4. 5
3 10 675 30.75 0.074 3:5
4 9 545 30.60 0.078 4:5
5 5 800 30.00 0.100
Rear legs set
1 4 780 30.72 0.110 1:3. 5
2 9 514 30.63 0.078 2:3. 5
3 13 955 31.22 0.064 3:4. 5
4 8 086 30.76 0.084 4:5
5 5 154 28.45 0.105
Foot angle
1 6 174 29.35 0.097 1:2. 3. 4. 5
2 9 157 30.76 0.079
3 12 524 30.93 0.067 3:4
4 8 232 30.67 0.084
angularity. Our ascertained figures could be influ-enced by the dissimilarity of the Czech Holstein cow population. The dependence of PL on cow stature is not consistent. There is not a direct relationship between the stature of cows and their productive life. The effects of chest width and body depth are similar when the longest PL was found for cows with undersized scoring. Cows included in the sec-ond point level of classification reached more than 31.3 months of PL, while cows with minimal or maximal chest width scoring (class 1 or 5) had only 29.75 months of PL. Similar but lower differences were found in the body depth and rump width as
well. Cows in the 2nd class of linear scoring of these
[image:5.595.63.533.286.760.2]traits had the significantly longest PL. Fore length of PL slightly angled rump (class 2) is the most suit-able. The shortest PL (29.5 months) was found for cows with extremely sloped rumps (class 5). The longest PL (31.2 months) was in cows with regular rear legs set (class 3). Cows with sickled rear legs had the significantly lowest PL (28.5 months). There are no significant differences between straight legs (class 1 and 2) and slightly curved legs (class 4). Differences in PL according to the foot angle score were statistically significant (P < 0.001) only be-tween class 1, i.e. cows with low foot angle, and
Table 3. Effect of linear udder trait score on the length of productive life
Trait Level of type classification Productive life in months Statistical signifi-cance of differences
class n LS mean SE
1 7 929 30.28 0.085 1:3. 4
2 8 499 30.19 0.083 2:3. 4. 5
Fore udder attachment 3 11 502 30.84 0.071 3:4. 5
4 8 034 31.08 0.085 4:5
5 5 525 30.45 0.102
1 6 188 29.31 0.097 1:2. 3. 4. 5
2 9 103 30.40 0.080 2:3. 4. 5
Rear udder attachment 3 10 742 30.76 0.073 3:4. 5
4 8 935 31.00 0.080 4:5
5 6 521 31.25 0.094
1 5 403 28.60 0.103 1:2. 3. 4. 5
2 9 056 30.40 0.080 2:3. 4. 5
Central ligament 3 12 507 30.88 0.068 3:4. 5
4 8 706 31.14 0.081 4: 5
5 5 817 31.30 0.099
1 7 273 30.82 0.089 1:2. 3. 4. 5
2 9 420 31.35 0.078 2:3. 4. 5
Udder depth 3 11 707 30.30 0.070
4 7 616 30.09 0.087
5 5 473 30.31 0.103
1 5 398 30.12 0.104 1:2. 3. 4. 5
2 9 711 30.43 0.077 2:4. 5
Front teat placement 3 11 732 30.41 0.070 3:4. 5
4 8 643 30.94 0.082
5 6 005 31.15 0.098
1 5 447 30.86 0.103 1:2. 3. 4. 5
2 8 499 30.58 0.082 2:3. 4. 5
Teat length 3 13 912 31.51 0.064 3:4. 5
4 8 778 29.86 0.081 4:5
all other classes. Similar results were reported by Boetcher et al. (1997), who concluded that most of the body traits had slightly positive relationships with herd life, indicating that larger cows lived longer. However, body depth had a slightly nega-tive relationship with some longevity traits.
The effects of udder linear traits are shown in Table 3. The longest PL was found for cows with above-average fore udder attachment (class 4), with highest rear udder attachment (class 5), and with deepest central ligament (class 5). In the case of udder depth, cows with moderately deep udders showed the longest PL. This finding differs from Hamoen (2002), who described the lowest cul-ling rate for cows scored from 5 to 7 points cor-responding to our scoring class 3 or 4. There is an early linear dependence between PL and the front teat placement classification when PL is extended
with the scoring level. The significantly best PL was found for cows with moderate teat length (class 3). Cows with too long teats showed the lowest PL in comparison with the other classes (P < 0.001).
[image:6.595.66.533.359.757.2]A direct proportion between the number of points and length of PL was shown in all five gen-eral characteristics of cow conformation (Table 4). Boetcher et al. (1997) concluded that dairy charac-ter was negatively related to longevity afcharac-ter adjust-ment for production. This is consistent with the results of other authors (Dekkers, 1993; Hamoen, 2002). On the contrary, Vollema (1998) reported positive relationships between dairy character and longevity traits as published by many researchers. Generally, there is a linear relationship between general characteristics or final score and longev-ity as found by Short and Lawlor (1992), Vollema (1998), and others.
Table 4. Effect of the general type characteristic score on the length of productive life
Trait Level of type classification Productive life in months Statistical signifi-cance of differences
class n LS mean SE
1 4 654 28.93 0.110 1:2. 3. 4. 5
2 7 787 29.92 0.085 2:3. 4. 5
Dairy character 3 14 271 30.16 0.063 3:4. 5
4 8 083 31.12 0.084 4:5
5 6 694 32.81 0.092
1 5 555 29.73 0.102 1:2. 3. 4. 5
2 9 781 30.44 0.077 2:4. 5
Body capacity 3 10 270 30.54 0.075 3:4. 5
4 9 917 30.78 0.076 4:5
5 5 966 31.43 0.098
1 5 426 28.98 0.103 1:2. 3. 4. 5
2 9 287 30.20 0.079 2:3. 4. 5
Rump 3 11 589 30.77 0.070 3:4. 5
4 10 444 31.25 0.074
5 4 743 31.32 0.110
1 5 696 28.70 0.100 1:2. 3. 4. 5
2 9 125 29.75 0.079 2:3. 4. 5
Feet and legs 3 13 535 31.08 0.065 3:5
4 7 753 31.29 0.086 4:5
5 5 380 31.79 0.103
1 5 675 28.85 0.100 1:2. 3. 4. 5
2 8 970 29.90 0.079 2:3. 4. 5
Udder 3 11 219 30.43 0.071 3:4. 5
4 9 771 30.90 0.076 4:5
CONCLUSION
The relationships between most of the confor-mation traits and analysed longevity parameters were significant. Some results of the assessment show that selection and mating focused on the functional type improvement of cows as done by breeders can be efficient in herd lifetime profit-ability. Ascertained results can be used as a tool for breeding schemes in dairy herds, and partial results can be applied in future research and breed-ing value estimation of longevity traits in the Czech Republic.
Acknowledgement
We thank Mrs. Lois Russell for editorial help with the manuscript.
REFERENCES
Boetttcher P.L., Jairath L.K., Koots K.R., Dekkers J.C.M. (1997): Effects of interactions between type and milk production on survival traits of Canadian Holsteins. J. Dairy Sci., 80, 2984–2995.
Bouška J., Vacek M., Štípková M., Němec A. (2006): The relationship between linear type traits and stayability of Czech Fleckvieh cows. Czech J. Anim. Sci., 51, 299– 304.
Brotherstone S., Hill W.G. (1991): Dairy herd life in rela-tion to linear type traits and producrela-tion > 1. Phenotypic and genetic analyses in pedigree type classified herds. Anim. Prod., 53, 279–287.
Cruickshank J., Weigel K.A., Dentine M.R., Kirkpatrick B.W. (2002): Indirect prediction of herd life in Guern-sey dairy cattle. J. Dairy Sci., 85, 1307–1313.
Dekkers J.C.M. (1993): Theoretical basis for genetic pa-rameters of herd life and effects on response of selec-tion. J. Dairy Sci., 76, 1433–1443.
Essl A. (1998): Longevity in dairy cattle breeding: A re-view. Livest. Prod. Sci., 57, 79–89.
Hamoen A. (2002): On the way to a functional cow. NRS presentation, June 2002, Arnhem, Netherlands. Mark T. (2004): Applied genetic evaluation for production
and functional traits in dairy cattle. J. Dairy Sci., 87, 2641–2652.
Rasch D., Mašata O. (2006): Methods of variance com-ponent estimation. Czech J. Anim. Sci., 51, 227–235. SAS Institute Inc. (2001): Release 8.2 (TS2MO) of the
SAS® System for Microsoft® Windows®. SAS Institute
Inc., Cary, NC.
Short T.H., Lawlor T.J. (1992): Genetic parameters of conformation traits, milk yield, herd life in Holsteins. J. Dairy Sci., 75, 1987–1998.
Strapák P., Candrák J., Aumann J. (2005): Relationship between longevity and selected production, reproduc-tion and type traits. Czech J. Anim. Sci., 50, 1–6. Tsuruta S., Misztal I., Lawlor T.J. (2005): Changing
defi-nition of productive life in US Holsteins: Effect on ge-netic correlations. J. Dairy Sci., 88, 1156–1165. Vollema A.R. (1998): Longevity of dairy cows: A review
of genetic variances and covariances with conformati-on. Anim. Breed., 66 (Abstr.), 781–802.
Vollema A.R., Groen A.F. (1997): Genetic correlations between longevity and conformation traits in an up-grading dairy cattle population. J. Dairy Sci., 81, 3006– 3014.
Vukasinovic N., Moll J., Künzi N. (1994): Analysis of type traits as predictor of longevity in Swiss brown cattle: Genetic parameters and sire evaluation. 45th EAAP An-nual Meet., Edinburgh.
Vukasinovic N., Schleppi Y., Künzi N. (2002): Using con-formation traits to improve reliability of genetic evalu-ation for herd life based on survival analysis. J. Dairy Sci., 85, 1556–1562.
Received: 2006–01–20 Accepted after corrections: 2006–04–06
Corresponding Author
Ing. Mojmír Vacek, CSc., Research Institute of Animal Production, Přátelství 815, P.O. Box 1, 104 01 Prague 114-Uhříněves, Czech Republic