Texture is a sensory and functional manifestation of the structural, mechanical and surface properties of foods detected through the senses of vision, hear-ing, touch and kinaesthetics (Szczesniak, 2002). In practise, many methods are used to evaluate meat texture. They can be grouped into three categories: sensory methods (which are fundamentally subjec-tive), instrumental methods (known as objective) and indirect methods. Among instrumental meth-ods, the most commonly used are compression tests,
penetration tests, shear tests (frequently Warner-Bratzler shear or Kramer shear press), extension tests, and texture profile analysis tests (Kamdem and Hardy, 1994). Generally, the consumption of meat has increased. On the contrary, in the Czech Republic and other European countries the con-sumption of beef has dramatically decreased due to several reasons (higher price, BSE, etc.), but also because of the variability in meat quality. Especially three sensory attributes (flavour, juiciness and
ten-Effect of selected fattening performance and carcass
value traits on textural properties of beef
J. SOCHOR
1, J. SIMEONOVOVÁ
2, J. ŠUBRT
2, J. BUCHAR
21Czech Agriculture and Food Inspection Authority, Brno, Czech Republic 2Mendel University of Agriculture and Forestry, Brno, Czech Republic
ABSTRACT: Fifty-one crossbreed young bulls, progenies of Charolais (CH), Czech Pied (CP), Simmental (SI) and Blonde d’Aquitaine (BA) beef cattle bred at the paternal position crossed by Czech Pied at the maternal position, were reared in a typical production system and slaughtered at an average age of 578 days and live weight of 656 kg. The animals were evaluated for fattening performance and carcass quality traits (live weight at slaughter, age at slaughter, total weight gain, carcass weight, dressing percentage, net daily gain) and meat quality characteristics (dry matter, proteins, fat, ash, pH48, water holding capacity, remission, collagen, area of M. longissimus dorsi
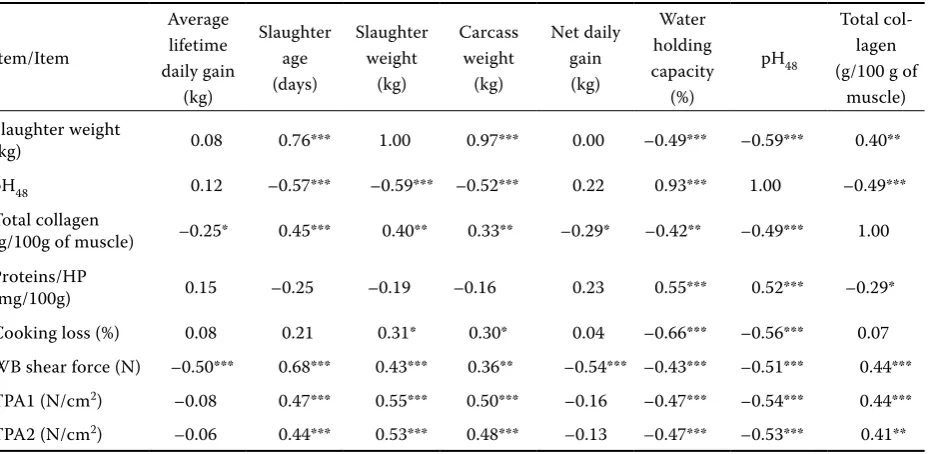
and cooking loss). Correlation coefficients were determined in order to discover which of the above-mentioned characteristics influenced textural properties measured by Warner-Bratzler (WB) shear device and compression test (TPA). It can be concluded from the overall assessment of the correlation coefficients that slaughter age (r = 0.68, P < 0.001), net daily gain (r = –0.54, P < 0.001), average lifetime daily gain (r = –0.50, P < 0.001) and pH48 (r = –0.51, P < 0.001) had the major influence on the textural properties measured by WB shears. Meat texture expressed by TPA was mainly influenced by live weight at slaughter (r = 0.55, P < 0.001), carcass weight (r = 0.50,
P < 0.001) and pH48 (r = –0.54, P < 0.001). Significant differences (P < 0.001) were found out for the age at slaughter (CH × BA) and (CP× BA), slaughter weight (CP× SI) and (CP × BA) and carcass weight (CP× BA). At the same level of significance further differences were found out for pH48 and water holding capacity (CP× SI), (CP × BA) and cooking loss (CH × CP). Highly significant differences (P < 0.01) in the textural properties (measured by WB shears) were determined between the following breeds: (CH × BA) and (CP × BA). At the level of significance
P < 0.05, the highest differences were identified between (CH × SI) and (CP × SI). TPA test showed statistically significant differences between (CH × CP), (CP × SI) breeds at the level P < 0.05.
Keywords: bulls; fattening performance traits; meat quality; textural properties; Warner-Bratzler shears; com-pression test
derness) contribute to a consumer’s perception of meat palatability or satisfaction derived from consuming beef. It has been shown that tender-ness, as a textural property, is the most important factor for determining beef palatability (Jeremiah, 1982). In his paper Thompson (2002) discussed the management of meat tenderness using a carcass grading scheme which employs the concept of total quality management of those factors that impact on beef palatability. The factors were as follows: breed, growth path, hormonal growth promoters, pH/temperature window, alternative carcass sus-pension, marbling and ageing. From the structural point of view tenderness depends on the properties of muscle fibres and on the amount and type of connective tissue. Tenderness can be affected by rigor development, chilling, electrical stimulation, ante-mortem stress, etc. (Tornberg, 1996).
Many investigators (Mandell et al., 1997; Özlütürk
et al., 2004; Sami et al., 2004; Sañudo et al., 2004 etc.) studied the relations between different pro-duction factors (breed, age, weight, etc.) and both meat quality characteristics and textural proper-ties (especially tenderness measured mainly by WB shears and/or assessed by a sensory panel).
Breed type and slaughter weight influence carcass and meat quality characteristics in several ways, in-cluding the properties and structure of muscle and meat physiology. This, in turn, influences carcass cooling, rate of glycolysis, early pH changes and, finally, the process of transformation of muscle into meat (Sañudo et al., 2004).
Different breeds of cattle have a wide spectrum of fibre types in muscles (Gil et al., 2001) but these are not always reflected by differences in instru-mental analyses using Warner-Bratzler shears or sensory panels (Koch et al., 1982; Jeremiah et al., 1997). Within the same breed type, the most im-portant intrinsic factors affecting meat quality are age, live weight and sex (Huff and Parris, 1993). It is also relatively well documented that heavier cattle have less tender meat (Shorthose and Harris, 1990). Collagen is the major determinant of meat texture (when cold shortening is omitted) and subtle vari-ations in the texture are dependent on the quality rather than on the quantity of collagen (Bailey and Light, 1989).
The objective of this paper was to find and ex-plain relations (expressed by coefficients of cor-relation) between different fattening performance traits, carcass quality, meat quality characteristics and textural properties. The outcome of the
re-search should helpwith quality assurance of beef. The second aim was to compare the level of dis-tinction between different characteristics in four investigated crossbreds produced in the Czech Republic.
MATERIAL AND METHODS
A total of 51 young bulls were reared in a typi-cal production system and slaughtered at an aver-age aver-age of 578 days and live weight of 656 kg. The groupof animals consisted of Charolais (CH) n = 21, Czech Pied (CP) n = 12, Simmental (SI) n = 11 and Blonde d’Aquitaine (BA) n = 7 crossbreds that were progenies of sires of these breeds crossed by Czech Pied breed at the maternal position. The animals were evaluated for fattening performance and carcass quality traits (live weight at slaughter, age at slaughter, total weight gain, carcass weight, dressing percentage, net daily gain).
A portion of M. longissimus pars thoracis (MLT) (9–11th vertebrae) was removed from each carcass for the analysis of selected meat quality character-istics. Chemical analyses were based on classical methods of analysis. Kjehdahl’s method was used to determine the content of total N, the extraction method was applied to define the content of intra-muscular fat using the petroleum ether solvent. For the parameters of technological quality we defined the pH value of the muscles 48 hours post mortem, the colour was evaluated on the basis of reflect-ance per cent (wavelength 542 nm) and content of muscle pigments, for the water holding capacity we used the compression method and the content of fibrous proteins was determined by means of the content of hydroxyproline. The MLT area was determined planimetrically on the level of the 9th thoracic vertebra.
Textural properties were analysed by two differ-ent objective methods. Meat was vacuum packaged prior to cooking in a water bath until the internal temperature reached 70°C for one hour. Cooking loss was determined by weighing the samples be-fore and directly after cooking. Percentage of total cooking loss (evaporative and driploss) was calcu-lated as follows:
Cooking loss = [(raw weight – cooked weight)/raw weight] × 100
the Warner-Bratzler device shearing until the total break of the sample. The test was conducted ac-cording to methodology described by Christensen
et al. (2000). The bicyclical compression test was used to simulate molars during a mastication proc-ess. Samples were compressed upto 80% deforma-tion (K = 0.8) and maximum stress (N/cm2) was determined. The methodology of compression test was according to Houška et al. (1994). Both probes were attached to TIRA-test machine.
Mathematical and statistical tests of average data on the whole and for each breed separately were carried out using the statistical UNISTAT 5.0 pack-age. Summary statistics (mean, standard deviation, coefficient of variation), coefficients of correlation and three selective t-tests with 95, 99 and 99.9% level of significance were used.
RESULTS
[image:3.595.65.530.351.529.2]Selected fattening performance and carcass qual-ity traits of fifty-one young bulls are presented in Table 1. The highest slaughter age was in Blonde d’Aquitaine breed (BA = 683.3 days), followed by Simmental (SI = 645.4 days), Charolais (CH = 548.1) and Czech Pied (CP= 505.1). The same order was in slaughter weight and carcass weight. CH breed had the highest average lifetime daily gain (1.147 kg) as well as net daily gain (0.701 kg). The highest dressing percentage was determined in BA breed (59.02%). Table 2 shows statistically significant differences in fattening performance and carcass quality traits. It is clear from Table 2 that BA versus CH and CPdiffered significantly in slaughter age at the level of significance P < 0.001 and SI versus
Table 1. Selected fattening performance and carcass quality traits (n = 51)
Item/Breed – Charolais Czech Pied Simmental Blonde d’Aquitaine
x s–x V(%) –x s–x V(%) –x s–x V(%) –x s–x V(%)
Slaughter age (days) 548.1 78.06 14.24 505.1 50.35 9.97 645.4 113.30 17.56 683.3 20.75 3.04 Slaughter weight
(kg) 653.3 76.06 11.64 587.3 50.76 8.64 694.1 86.69 12.49 722.3 72.48 10.03 Average lifetime
daily gain (kg) 1.147 0.132 11.47 1.106 0.062 5.63 1.038 0.080 7.68 1.015 0.116 11.39 Carcass weight (kg) 378.7 43.36 11.45 339.8 33.40 9.83 389.0 58.64 15.08 424.7 33.58 7.91 Dressing
percentage (%) 57.99 0.96 1.65 57.81 1.62 2.80 55.90 2.39 4.28 59.02 3.07 5.20 Net daily gain (kg) 0.701 0.074 10.53 0.674 0.046 6.79 0.608 0.058 9.61 0.622 0.536 8.61
[image:3.595.63.536.593.723.2]Charolais n = 21; Czech Pied n = 12; Simmental n = 11; Blonde d’Aquitaine n = 7
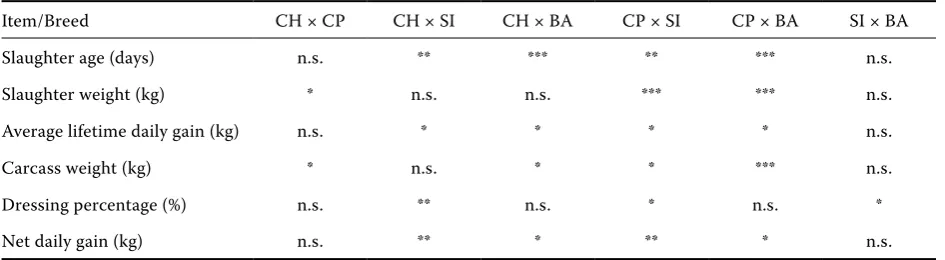
Table 2. Statistically significant differences in fattening performance and carcass quality traits
Item/Breed CH × CP CH × SI CH × BA CP × SI CP × BA SI × BA
Slaughter age (days) n.s. ** *** ** *** n.s.
Slaughter weight (kg) * n.s. n.s. *** *** n.s.
Average lifetime daily gain (kg) n.s. * * * * n.s.
Carcass weight (kg) * n.s. * * *** n.s.
Dressing percentage (%) n.s. ** n.s. * n.s. *
Net daily gain (kg) n.s. ** * ** * n.s.
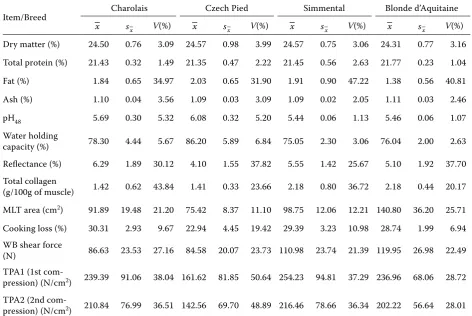
Table 3. Selected meat quality characteristics (n = 51)
Item/Breed – Charolais Czech Pied Simmental Blonde d’Aquitaine
x s–x V(%) –x s–x V(%) –x s–x V(%) –x s–x V(%)
Dry matter (%) 24.50 0.76 3.09 24.57 0.98 3.99 24.57 0.75 3.06 24.31 0.77 3.16 Total protein (%) 21.43 0.32 1.49 21.35 0.47 2.22 21.45 0.56 2.63 21.77 0.23 1.04 Fat (%) 1.84 0.65 34.97 2.03 0.65 31.90 1.91 0.90 47.22 1.38 0.56 40.81 Ash (%) 1.10 0.04 3.56 1.09 0.03 3.09 1.09 0.02 2.05 1.11 0.03 2.46 pH48 5.69 0.30 5.32 6.08 0.32 5.20 5.44 0.06 1.13 5.46 0.06 1.07
Water holding
capacity (%) 78.30 4.44 5.67 86.20 5.89 6.84 75.05 2.30 3.06 76.04 2.00 2.63 Reflectance (%) 6.29 1.89 30.12 4.10 1.55 37.82 5.55 1.42 25.67 5.10 1.92 37.70 Total collagen
(g/100g of muscle) 1.42 0.62 43.84 1.41 0.33 23.66 2.18 0.80 36.72 2.18 0.44 20.17 MLT area (cm2) 91.89 19.48 21.20 75.42 8.37 11.10 98.75 12.06 12.21 140.80 36.20 25.71
Cooking loss (%) 30.31 2.93 9.67 22.94 4.45 19.42 29.39 3.23 10.98 28.74 1.99 6.94 WB shear force
(N) 86.63 23.53 27.16 84.58 20.07 23.73 110.98 23.74 21.39 119.95 26.98 22.49 TPA1 (1st
com-pression) (N/cm2) 239.39 91.06 38.04 161.62 81.85 50.64 254.23 94.81 37.29 236.96 68.06 28.72
TPA2 (2nd
com-pression) (N/cm2) 210.84 76.99 36.51 142.56 69.70 48.89 216.46 78.66 36.34 202.22 56.64 28.01
Charolais n = 21; Czech Pied n = 12; Simmental n = 11; Blonde d’Aquitaine n = 7
CPand CH at P < 0.01. No significant differences were found out in slaughter weight between CH × SI, CH × BA and SI × BA; on the contrary, highly significant (P < 0.001) differences were identified between CPversus SI and CP × BA. Net daily gain significantly differed (P < 0.01) between CH × SI and CP × SI and at the level P < 0.05 between CH × BA and CP × BA as well.
The evaluation of meat quality was based on 12 characteristics (Table 3). The assessment of statistically significant differences is presented in Table 4. No significant differences between breeds were found out in chemical composition (dry mat-ter, total protein, fat and ash) except for total colla-gen content that ranged from 1.41 g/100g of muscle (CP) to 2.18 g/100g (SI and BA) and differed sig-nificantly (P < 0.01) between CH × SI, CH × BA and CP × BA. Out of the physical properties the largest differences were found in pH48 accompanied by water holding capacity, which corresponded to each other. It decreased in the order CP, CH, BA and SI. The value of cooking loss ranged from
28.74% (BA) to 30.31% (CH), on the contrary for CPit was only 22.94%, i.e. significantly lower. The lowest reflectance 4.10% was measured for CP,on the other hand the highest was determined for CH (6.29%). Textural properties were expressed by WB and TPA analysis. The lowest shear force was re-corded for CP(84.58 N) followed by CH (86.63 N), SI (110.98 N) and BA (119.95 N). No significant differences were found out between CH × CPand SI × BA. TPA analysis proved statistically signifi-cant differences (P < 0.05) between CH × CPand CP× SI. The coefficient of variation was the highest for total collagen content, fat content and texture measurements, on the contrary it was lowest was for total protein, ash and dry matter.
coef-Table 4. Statistically significant differences in meat quality characteristics
Item/Breed CH × CP CH × SI CH × BA CP × SI CP × BA SI × BA
Dry matter (%) n.s. n.s. n.s. n.s. n.s. n.s.
Total protein (%) n.s. n.s. n.s. n.s. n.s. n.s.
Fat (%) n.s. n.s. n.s. n.s. n.s. n.s.
Ash (%) n.s. n.s. n.s. n.s. n.s. n.s.
pH48 ** * n.s. *** *** n.s.
Water holding capacity (%) *** * n.s. *** *** n.s.
Reflectance (%) ** n.s. n.s. * n.s. n.s.
Total collagen (g/100g of muscle) n.s. ** ** * ** n.s.
MLT area (cm2) * n.s. *** *** *** *
Cooking loss (%) *** n.s. n.s. ** ** n.s.
WB shear force (N) n.s. * ** * ** n.s.
TPA1 (1st compression) (N/cm2) * n.s. n.s. * n.s. n.s.
TPA2 (2nd compression) (N/cm2) * n.s. n.s. * n.s. n.s.
[image:5.595.63.534.102.342.2]CH = Charolais; CP = Czech Pied; SI = Simmental; BA = Blonde d’Aquitaine *P < 0.05; **P < 0.01; ***P < 0.001
Table 5. Coefficients of correlation between selected characteristics (overall assessment)
Item/Item
Average lifetime daily gain
(kg)
Slaughter age (days)
Slaughter weight
(kg)
Carcass weight
(kg)
Net daily gain (kg)
Water holding capacity
(%)
pH48
Total col-lagen (g/100 g of
muscle) Slaughter weight
(kg) 0.08 0.76*** 1.00 0.97*** 0.00 –0.49*** –0.59*** 0.40** pH48 0.12 –0.57*** –0.59*** –0.52*** 0.22 0.93*** 1.00 –0.49*** Total collagen
(g/100g of muscle) –0.25* 0.45*** 0.40** 0.33** –0.29* –0.42** –0.49*** 1.00 Proteins/HP
(mg/100g) 0.15 –0.25 –0.19 –0.16 0.23 0.55*** 0.52*** –0.29* Cooking loss (%) 0.08 0.21 0.31* 0.30* 0.04 –0.66*** –0.56*** 0.07 WB shear force (N) –0.50*** 0.68*** 0.43*** 0.36** –0.54*** –0.43*** –0.51*** 0.44*** TPA1 (N/cm2) –0.08 0.47*** 0.55*** 0.50*** –0.16 –0.47*** –0.54*** 0.44***
TPA2 (N/cm2) –0.06 0.44*** 0.53*** 0.48*** –0.13 –0.47*** –0.53*** 0.41**
HP = hydroxyproline; *P < 0.05; **P < 0.01; ***P < 0.001
ficients of correlation were also found between cooking loss and pH48 (r = –0.56), proteins/hy-droxyproline and water holding capacity (r = 0.55), TPA 1st and slaughter weight (0.55), TPA 1st and pH48 (r = –0.54).
DISCUSSION
[image:5.595.68.533.418.645.2]breeds were slaughtered at the different slaughter age and weight, the evaluation of breed effect is debatable.
Slaughter age
A highly significant correlation (P < 0.001, r = 0.76) was found between slaughter age and slaugh-ter weight. Slaughslaugh-ter age had a significant effect (P < 0.001) and was positively correlated (r = 0.68) with WB shear force measurements. Although a higher correlation coefficient was found out in the present study, this result is in accordance with the findings of Mandell et al. (1997), who also reported positive correlations (r = 0.29, P = 0.03) between age at slaughter and shear force.
Cross et al. (1984) reported that the total collagen level was significantly affected by sex and age. The effect of age was confirmed in the present study as well, when age was positively correlated (P < 0.001,
r = 0.45) with total collagen content.
Total collagen content
However, Bailey and Light (1989) reported an op-posite fact that the collagen concentration did not change significantly during growth until slaugh-ter, but collagen solubility decreased with animal weight and age. Soluble collagen is significantly related to the contribution of connective tissue to toughness, and tenderness differs among mus-cles from various anatomical regions (Cross et al., 1973). In the present study both indicators (ani-mal weight, ani(ani-mal age) were positively correlated (Table 5) with objective measurement of toughness (WB shear force and compression test).
Our results of total collagen concentration in muscles in the case of CH and CPwere similar to those reported by Sañudo et al. (2004); on the other hand, the values for SI and BA were slightly high-er. The results showed significant differences (P < 0.01) in the total collagen content between CH × SI, CH × BA, CP× BA combinations, which cor-responds to Sañudo’s et al. (2004) findings that the total collagen content is affected by breed type.
In 1977 Dransfield showed a clear correlation between total collagen content and muscle tough-ness. A high positive correlation between WB shear force and total collagen content (P < 0.01,
r = 0.723) was also demonstrated by Torrescano
et al. (2003). This fact was proved in our experi-ment too. WB and compression test were posi-tively correlated with total collagen content (P < 0.001, r = 0.44 for both WB and TPA), and there-fore, the results reported by Dransfield (1977) and Torrescano et al. (2003) are consistent with the findings of the present study.
pH48
The course of glycolysis as a part of early post mortem changes is evaluated by the pH value. The average pH48 values did not exceed the critical value (6.2) defining the incidence of DFD syndrome for any breed. However, the highest average pH value was recorded for CP(6.08), which could indicate the inclination to DFD syndrome, probably caused by increased perceptiveness of CPto ante-mortem stress. The latter statement can be supported by the fact that besides pH CPmeat demonstrated the highest value of water holding capacity, the lowest cooking loss and reflectance (Table 3).
The pH value can be important for meat tender-ness. Yu and Lee (1986) established that high pH meat (above 6.3) was most tender, followed by low (below 5.8) and intermediate (5.8–6.3) pH meats. Therefore our results are in agreement with Yu’s conclusion. The lowest WB and TPA values were recorded for CP(in the case of WB shear force the value was insignificantly lower compared to CH, but significantly lower than in SI (P < 0.05) and BA (P < 0.01)), so the meat from CPbulls was evaluated as the most tender.
Cooking loss
The cooking loss values for CH, SI, BA were similar to the results of Scheeder et al. (2001), on the contrary, the value for CPwas considerably lower.
Gullet et al. (1996) found total cooking loss to be negatively correlated with tenderness. No rela-tion between cooking loss and WB was proved. On the other hand, the positive relation (r = 0.41;
WB shear force
In comparison with Özlütürk et al. (2004) we demonstrated higher WB values (86.63 N; ver-sus Özlütürk’s 71.4 N) for CH and lower for SI (110.98 N; versus Özlütürk’s 137.7 N).
The values of WB measurements were signifi-cantly lower in CH and CPcompared to SI and BA (Tables 3 and 4) and correlated with slaughter weight (positive correlation r = 0.43) and slaughter age (r = 0.68). The same relation between age and tenderness was reported by Shorthose and Harris (1990). Thus the meat from lighter and younger animals was significantly more tender, however with larger variation within WB values. From the texture point of view the differences in tenderness can be explained by the content of total collagen that was higher in the case of SI and BA (it means in the older animals). These statements can be sup-ported by the correlation coefficient between WB and collagen content (r = 0.44).
Furthermore, Bailey and Light (1989) reported that the collagen solubility decreased with animal weight and age. Therefore the heated meat from older animals is tougher even if the total collagen content is the same.
TPA (compression test)
As it is clear from the previous description, there were significant differences (even at the level of
P < 0.001) between the breeds in slaughter weight and age.
Out of the fattening performance traits, the re-sults of TPA were mostly influenced by the weight-age effect. Significant differences (P < 0.05) were found out between mean TPA values of CH × CP and CP× SI. Furthermore, the results of TPA were influenced by slaughter weight (r = 0.55) to a larger extent than by slaughter age (r = 0.47). According to Sañudo et al. (2004), the differences are related to the stronger texture of connective tissue in heavier animals. The stronger texture is a result of some hy-pothetical differences in the angle between the col-lagen fibres and the myofibrillar compounds and/or of the superior thickness of their perimysium and endomysium (Torrescano et al., 2003).
In reference to total collagen content and TPA, it could be indicated that the connective tissue had a different quality because this tissue depends on the collagen content and the number of links
be-tween collagen molecules (Shorthose and Harris, 1990). In our case, the same positive correlation (r = 0.44) between collagen content and TPA was observed as it was determined for WB test. It im-plicates that total collagen content influences both textural properties (measured by WB and TPA) at the same level.
CONCLUSIONS
In conclusion, pH48 value had a significant influ-ence on WB shear force and compression test. It means that better tenderness can be expected in beef with higher pH48 value. The higher cooking loss had a negative effect on tenderness measured by TPA.
The evaluation of meat tenderness by WB showed that out of the fattening performance traits, slaugh-ter age and slaughslaugh-ter weight had the strongest ef-fect (positive correlation with meat toughness). To compare these two characteristics it is necessary to state that the toughness measured by WB is more influenced by slaughter age (r = 0.68) than slaughter weight (r = 0.43). This fact can be ex-plained by the content of total collagen that was higher in older animals and by the change of the soluble to insoluble collagen ratio with age. On the other hand, the results of compression test (TPA) were more influenced by slaughter weight (r = 0.55), which can be explained by the stronger connective tissue in heavier animals. No relation-shipbetween WB test and TPA test was found. It indicates that these tests measure different as-pects of meat texture. Therefore further research including sensory analysis would be helpful before definite conclusions can be drawn on the effect of selected quality characteristics on textural prop-erties of beef.
REFERENCES
Bailey A.J., Light N.D. (1989): Connective Tissue in Meat and Meat Products. Elsev. Appl. Sci., London, 195–224. Christensen M., Purslow P.P., Larsen L.M. (2000): The effect of cooking temperature on mechanical properties of whole meat, single muscle fibres and perimysial con-nective tissue. Meat Sci., 55, 301–307.
Cross H.R., Schanbacher B.D., Crouse J.D. (1984): Sex, age and breed related changes in bovine testosterone and intramuscular collagen. Meat Sci., 10, 187–195. Dransfield E. (1977): Intramuscular composition and
texture of beef muscles. J. Sci. Food Agric., 28, 833– 842.
Gil M., Serra X., Gispert M., Oliver M.A., Sañudo C., Panea B., Olleta J.L., Campo M.M., Oliván M., Osoro K., García-Cachán M.D., Cruz-Sagredo R., Izquierdo M., Espejo M., Martín M., Piedrfita J. (2001): The effect of beef-production systems on the myosin heavy chain 1, the biochemical characteristics and the colour vari-ables of Longissimus thoracis from seven Spanish beef cattle breeds. Meat Sci., 58, 181–188.
Gullet E.A., Buttenham S., Hore T. (1996): Effect of age and cut on consistency of tenderness and leanness of beef. Food Qual. Pref., 7, 37–45.
Houška M., Pavlíčková I., Pokorný J. (1994): Correlations of evaluation of sensory and instrumental hardness. Potrav. Vědy, 12, 475–488.
Huff E.J., Parris F.C. (1993): Bovine longissimus muscle tenderness as affected by post-mortem aging time, animal age and sex. J. Food Sci., 58, 713–716. Jeremiah L.E. (1982): A review of factors influencing
con-sumption, selection, and acceptability of meat pur-chases. J. Cons. Stud. Home Econ., 6, 137–154. Jeremiah L.E., Aalhus J.L., Robertson W.M., Gibson L.L.,
(1997): The effect of grade, gender and post-mortem treatments on beef. II. Cooking properties and palat-ability attributes. Can. J. Anim. Sci., 77, 41–54. Kamdem A.T.K., Hardy J. (1994): Grinding as a method
of meat texture evaluation. Meat Sci., 39, 225–236. Koch R., Dikeman M.E., Crouse J.D. (1982):
Characteri-sation of biological types of cattle (Cycle III) III. Carcass composition, quality and palatability. J. Anim. Sci., 54, 35–45.
Mandell I.B., Gullett E.A., Wilton J.W., KempR.A., Allen O.B. (1997): Effects of gender and breed on carcass traits, chemical composition, and palatability attributes in Hereford and Simmental bulls and steers. Livest. Prod. Sci., 49, 235–248.
Özlütürk A., Tüzemen N., Yanar M., Esenbuga N., Dursun E. (2004): Fattening performance, carcass traits and meat quality characteristics of calves sired by Cha-rolais, Simmental and Eastern Anatolian Red sires mated to Eastern Anatolian Red dams. Meat Sci., 67, 463–470.
Sami A.S., Augustini C., Schwarz F.J. (2004): Effects of feeding intensity and time on feed on performance, carcass characteristics and meat quality of Simmental bulls. Meat Sci., 67, 195–201.
Sañudo C., Macie E.S., Olleta J.L., Villarroel M., Panea B., Albertí P. (2004): The effects of slaughter weight, breed type and ageing time on beef meat quality using two different texture devices. Meat Sci.,66, 925–932. Scheeder M. R. L., Casutt M. M., Roulin M., Escher F.,
Dufey P. A., Kreuzer M., (2001): Fatty acid composition, cooking loss and texture of beef patties from meat of bulls fed different fats. Meat Sci.,58, 321-328. Shorthose W.R., Harris P.V. (1990): Effect of animal age
on the tenderness of selected beef muscles. J. Food Sci.,
55, 1–8.
Sochor J., Simeonovová J., Jarošová A. (2005): The differ-ences of tenderness between beef, pork and turkey meat. Acta Aliment. Hung., 34, in print.
Szczesniak A.S. (2002): Texture is a sensory property. Food Qual. Pref., 13, 215–225.
Thompson J. (2002): Managing meat tenderness. Meat Sci., 62: 295–308.
Tornberg E., (1996): Biophysical aspects of meat tender-ness. Meat Sci., 43, 175–191.
Torrescano G., Sanchez-Escalante A., Gimenez Roncales P., Beltrán J.A. (2003): Shear values of raw samples of fourteen bovine muscles and their relation to muscle collagen characteristics. Meat Sci., 64, 85–91.
Yu L.P., Lee B.Y. (1986): Effects of postmortem pH and temperature on bovine muscle structure and meat ten-derness. J. Food Sci., 51, 774–780.
Received: 04–09–07 Accepted after corrections: 04–11–18
Corresponding Author