An analysis of energy use, input costs and relation
between energy inputs and yield of apple orchard
R. Fadavi, A. Keyhani, S.S. Mohtasebi
Department of Agricultural Machinery Engineering, Faculty of Agricultural Engineering
and Technology, University of Tehran, Karaj, Iran
Abstract
Fadavi R., Keyhani A., Mohtasebi S.S., 2011. An analysis of energy use, input costs and relation between energy inputs and yield of apple orchard. Res. Agr. Eng., 57: 88–96.
This study examines the energy balance between the input and the output per hectare for an apple orchard in the West Azarbaijan province in Iran (2008–2009). Data were collected by using random sampling method for 80 “face to face” questioners. Results showed that the highest share of energy consumption belongs to packaging (57%) and irrigation (16%). The highest share of expenses was found to be 34% and 30% for labor and packaging, respectively. The total energy input for apple production, energy productivity, net energy and output-input energy value were estimated as 101,505 MJ/ha, 0.23 kg/MJ, –56,320 MJ/ha and 0.44, respectively. Results indicated that 71% and 96.7% of total energy input were in indirect and non-renewable form, respectively. The benefit-cost ratio was estimated as 1.77. The regres-sion results revealed that all exogenous variables (for machinery, fertilizers, farmyard manure and packaging energies) were found statistically significant. The packaging had the highest impact (3.23). According to the benefit-cost ratio, large farms were more successful in economic performance.
Keywords: energy; economic productivity; apple; packaging
Apple is one of the most important fruits in the world. In Iran, apple (Delicious and Golden vari-eties) is mostly cultivated in the West Azarbaijan province. Also, the Oromieh Township is the lead-ing apple producer in this province (Anonymous 2005). Based on the Food and Agriculture Organi-zation (FAO) China, United States, Poland and Iran are the main apple producing countries in the world, respectively (Anonymous 2008a).
Energy use in agriculture was developed in re-sponse to increasing populations, limited supply of arable land and a desire for higher standards of living. More intensive energy use of fossil fuel, chemical fertilizers, pesticides, machinery and electricity brought some important human health and environmental problems. Thus, efficient use of energy inputs is of prompt importance in terms of
sustainable farming. Energy requirements in agri-culture are divided into two groups: direct and in-direct. Direct energy is required to perform various tasks related to crop production processes such as land preparation, irrigation, intercultural opera-tion, threshing, harvesting and transportation of agricultural inputs and farm production (Singh 2000). Indirect energy consists of the energy used in the manufacture, packaging and transport of fer-tilizers, pesticides and farm machinery (CAEEDAC 2000; Kennedy 2000).
Strapatsa et al. (2006), determined the amount of energy consumption from which one kilogram of apples is produced along with energy indices in apple production in Greece. Hasanzadeh and Rahbar (2005) studied energy use for apple pro-duction in Iran. For correct utilization of inputs in an agricultural system, a solution is to determine the best production function. In agriculture, many production functions are developed from which the Cobb-Douglas production function was shown to be efficient. Hatirli et al. (2006), investigated en-ergy inputs and crop yield relationship to develop and estimate an econometric model for greenhouse tomato production in Turkey. Furthermore, this study considered the effect of farm size on energy use and input costs. Yilmaz et al. (2005) reported that large farms are more successful in energy pro-ductivity, energy use efficiency and economic per-formance.
The aims of this study were to determine input-output energy use in apple production to investi-gate the efficiency of energy consumption and to make an economic analysis. The study also sought to analyze the effect of farm size on energy use and input costs based on apple orchards and to reveal the relationship between energy inputs and yield by developing mathematical models in the Oromieh Township in Iran.
MAteRiAl And MethodS
The West Azarbaijan province is located in the northwestern Iran. The average annual rainfall is 300–400 mm with average high and low annual temperatures of 19.4°C and 6.7°C, respectively (Anonymous 2007).
Data were collected from apple orchard’s holder in the Oromieh Township by using a “face to face” questionnaire and a stratified random sampling technique in 2008. For estimating the size of re-quired sample Neyman technique (Yamane 1967) as Eq. (1) is used that statistical sample method was executed by 80 orchards:
(1)
where:
n – required sample size
N – number of holdings in target population Nh – number of the population in the h stratification Sh – standard deviation in the h stratification
Sh2 – variance of h stratification
d – precision where (x–X) or mid-confidence interval z – reliability coefficient (1.96, whichrepresents the
95% confidence interval) D2 – d2/z2
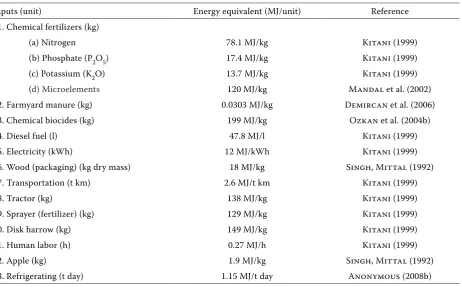
The permissible error in the sample size was defined to be 5% for 95% confidence, sample size was calculated as 80 orchards. Based on the energy equivalents of the inputs and outputs (Table 1), the metabolisable energy was calculated. Energy ratio (energy use efficiency) and energy productivity were calculated as Eq. (2) and Eq. (3) (Mandal et al. 2002):
Output-input ratio (ER) = Energy output (MJ/ha)/
Energy input (MJ/ha) (2)
Energy productivity (EP) = Total output (kg/ha)/
Energy input (MJ/ha) (3)
In this study, energy embodied in pesticides, fer-tilizers, manure, packaging, machinery and refrig-erating were considered as indirect energies while human energy, diesel and electricity were taken as direct form of energies. Also, non-renewable ener-gies were considered as all input enerener-gies (except human energy and farmyard manure) while human energy and farmyard manure were considered as renewable energies.
The output/input analysis was also applied in economic benefits analysis. The process was simi-lar with energy balance analysis. The economic (or energy) inputs of this system include costs of hu-man labor, chemical fertilizers, chemicals biocides, packaging, transportation, refrigerating, fixed costs and agricultural machinery. The economic (or en-ergy) outputs of this system include main and sec-ondary yields.
In the literature, Cobb-Douglas function was used by several authors to examine the relationship between energy inputs and production or yield (Singh et al. 1998, 2002), Cobb-Douglas function yielded better estimates in terms of statistical sig-nificance and expected signs of parameters among linear, linear logarithmic and second degree poly-nomial functions. All estimations were carried out using the Eviews software (SHAZAM Analytics Ltd., London, UK) and MS Excel program, Cobb-Douglas production function is expressed as Eq. (4):
lnYi =a + ∑n
j=1bj × ln(xij) + ei× i = 1,2,3,…..80 (4)
2 2
2
h h h
S N D
N
S N
n h
¦
¦
where:
Yi – denotes the yield level of the ith farmer
xij – vector inputs used in the production process a – constant term
bj – represents coefficients of inputs which are esti-mated from the model
ei – the error term
In this study, it is assumed that if there is no in-put energy, the outin-put energy is also zero. The same assumption was also made by Singh et al. (2003). Making this assumption excludes the constant term from Eq. (5), and the equation reduces to:
lnYi= ∑n
j=1bj × ln(xij) + ei (5)
In addition to the influence of each variable on the yield level, the impact of direct, indirect, re-newable and non-rere-newable energies on yield was also investigated. For this purpose, Cobb-Douglas function was specified in the following form Eq. (6) and Eq. (7):
lnYi = c1 × ln DE + c2 × ln IDE + ei (6)
where:
Yi – ith farm’s energy output
DE – direct energy used
IDE – indirect energy used for apple orchard production ci – coefficient of exogenous variables
lnYi = d1 × ln RE + d2 × ln NRE + ei (7)
where:
Yi – ith farm’s energy output
RE – renewable energy used
NRE – non-renewable energy used for apple production di – coefficient of exogenous variables
ReSultS And diScuSSion
economic analysis of apple production
[image:3.595.71.534.99.386.2]The costs of each input and gross production val-ues calculated in apple production are given in Ta-ble 2. The gross value of production (13,873 $/ha) was found by multiplying the apple yield (19,447 kg/ ha, 4,335 kg/ha) to their corresponding prices (0.7 $/ kg, 0.06 $/kg) and summing the results. The total mean expenditure for the production was 7,816 $/ha, where 92.2% was the share of variable costs, wheas 7.8% wwheas fixed expenditures. Several studies re-ported that the ratio of variable cost was higher than that of fixed cost in cropping systems (Esengun et al. 2007; Ҫetin, Vardar 2008; Mohammadi et al. Table 1. Energy equivalents of inputs-output in agricultural production
Inputs (unit) Energy equivalent (MJ/unit) Reference 1. Chemical fertilizers (kg)
(a) Nitrogen 78.1 MJ/kg Kitani (1999) (b) Phosphate (P2O5) 17.4 MJ/kg Kitani (1999) (c) Potassium (K2O) 13.7 MJ/kg Kitani (1999)
(d) Microelements 120 MJ/kg Mandal et al. (2002)
2008). The benefit-cost ratio from apple production in the surveyed orchards was calculated to be 1.8. The research results were consistent with the find-ings reported by other researchers for other orchard crops, such as 2.37 for orange, 1.89 for lemon and 1.88 for mandarin (Ozkan et al. 2004b). The gross return (6,673 $/ha) was calculated by subtracting the variable cost of production per hectare (7,200 $/ ha) from the gross value of production (13,873 $/ ha). The productivity (2.5 kg/$) was obtained by dividing apple yield (19,447 kg/ha) by total produc-tion costs (7,816 $/ha).
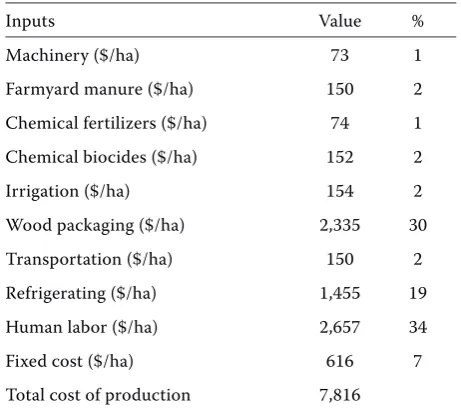
Table 3 shows that of all the inputs, the human labor expenses have the biggest share of 34%. La-bor expenses share for harvesting (43%), irriga-tion (21.7%), pruning (21.5%), fertilizairriga-tion (8.8%), sprayer (3%) and plotting (2%) operation were found. Almost in all surveyed orchards, most op-erations were performed by human labor, due to lack of machineries suitable for long-legged trees. Also, some farmers were concerned about the soil compaction resulting from machinery traffic.
Packaging (30%) and refrigerating (19%) expens-es are followed by the fixed costs (7.8%). Rexpens-esults re-vealed that harvesting and postharvest operations are the most important expenses with (65.6%). Due to low mechanization level in apple orchard, hu-man energy is accounted for 34% and that of
ma-chineries for 1% of total costs, data concerning the percentage of the costs are presented in Table 3, the results showed that the cost of material of chemical fertilizers and biocides is calculated as 74 and 152 $/ ha, respectively, which is significantly lower in comparison with other conditions and crops.
Analysis of input-output energy use in apple production
The yield in apple orchard is generally carried out by human labor energy in the research area and the number of large orchard holdings using modern technology is very limited. The average size in the surveyed orchards was found to be 1.2 ha with a range from 0.1 up to 5 ha. Machine power was used only for sprayer (in all orchards), and fertilizing and plotting (in few orchards) due to the fact that most apple orchards are designed in a conventional way in which machinery traffic is really limited. The en-ergy consumption and its sources for apple produc-tion are presented in Table 4.
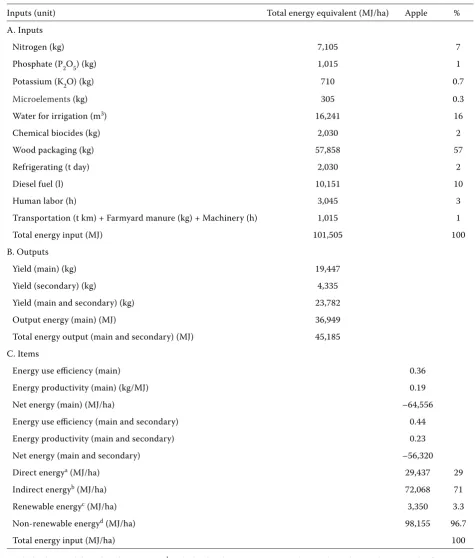
As can be seen from Table 4, the total energy used in various farm inputs is 101,505 MJ/ha. The last col-umn in Table 4 gives the percentage share of each input from the total energy inputs. Of all the inputs, wood packaging has the largest share (57%), apples are packaged with wood because owners of apple or-chards believe that wooden boxes store more power than plastics or other types of packing boxes. Packag-ing energy is followed by the irrigation energy (16%), based on duration of irrigation (5–24 h for one ha); irrigation methods were conventional or semi-mech-Table 2. Economic analysis of apple production
Cost and return components Value Yield (main) (kg/ha) 19,447 Sale price (main) ($/kg) 0.7 Yield (secondary) (kg/ha) 4,335 Sale price (secondary) ($/kg) 0.06 Gross value of production ($/ha) 13,873 Variable cost of production ($/ha) 7,200 Fixed cost of production ($/ha) 616 Total cost of production ($/ha) 7,816 Total cost of production (only main) ($/kg) 0.4 Total cost of production (main and
[image:4.595.62.290.102.380.2]secondary) ($/kg) 0.33 Gross return ($/ha) 6,673 Net return ($/ha) 6,057 Benefit to cost ratio (–) 1.8 Productivity (only main) (kg/$) 2.5 Productivity (main and secondary) (kg/$) 3
Table 3. Input costs in apple production
Inputs Value %
[image:4.595.302.533.551.756.2]anized (mostly with electric pump and conventional), an apple orchard is irrigated eight to ten times a year. The diesel energy was mainly utilized for operating tractors, [mostly Massey Ferguson (MF) and Goldoni] fuel consumption of Goldoni type is less than that of
MF, in spite of being conventional, diesel energy was accounted for 10% of total energy inputs.
[image:5.595.57.533.98.657.2]The total energy equivalent of chemical fertiliz-ers consumption placed fourth among the energy inputs and constituted (9%) of the total energy Table 4. Amounts of inputs-output energy in apple production
Inputs (unit) Total energy equivalent (MJ/ha) Apple % A. Inputs
Nitrogen (kg) 7,105 7
Phosphate (P2O5) (kg) 1,015 1
Potassium (K2O) (kg) 710 0.7
Microelements (kg) 305 0.3
Water for irrigation (m3) 16,241 16
Chemical biocides (kg) 2,030 2
Wood packaging (kg) 57,858 57
Refrigerating (t day) 2,030 2
Diesel fuel (l) 10,151 10
Human labor (h) 3,045 3
Transportation (t km) + Farmyard manure (kg) + Machinery (h) 1,015 1
Total energy input (MJ) 101,505 100
B. Outputs
Yield (main) (kg) 19,447
Yield (secondary) (kg) 4,335 Yield (main and secondary) (kg) 23,782 Output energy (main) (MJ) 36,949 Total energy output (main and secondary) (MJ) 45,185 C. Items
Energy use efficiency (main) 0.36
Energy productivity (main) (kg/MJ) 0.19
Net energy (main) (MJ/ha) –64,556
Energy use efficiency (main and secondary) 0.44 Energy productivity (main and secondary) 0.23 Net energy (main and secondary) –56,320
Direct energya (MJ/ha) 29,437 29
Indirect energyb (MJ/ha) 72,068 71
Renewable energyc (MJ/ha) 3,350 3.3
Non-renewable energyd (MJ/ha) 98,155 96.7
Total energy input (MJ/ha) 100
input, and nitrogen (7%) was in the first place fol-lowed by phosphate (1%), potassium (0.7%) and microelements (0.3%). The most frequently used fertilizer is farmyard manure and in some orchards chemical fertilizers are not even used because of soil structure and soil nutrients preservation. The contribution of transportation, farmyard manure and machinery energy remained at low level of 1% (in total) as indirect energy inputs. Hasanzadeh and Rahbar (2005), reported that the most energy consuming input for apple production in the West Azarbaijan province was that for irrigation, nitro-gen chemical fertilizing and chemical biocides, re-spectively. Fadavi et al. (2010), reported that by increasing mechanization index only, energy con-sumption will not decrease necessarily, and sug-gested that management of inputs consumption is more important.
Strapatsa et al. (2006), calculated that the most energy inputs for orchard apple production in Greece were fuel (33%), machinery (25%) and fer-tilizers (15%) (mainly N) (where orchards were ir-rigated one or two times a year); in all studies sites, postharvest operations were not included.
The energy use efficiency, energy productivity and net energy of apple production in the Oromieh Township are tabulated in Table 4. Energy use effi-ciency (energy ratio) was calculated as 0.36 and var-ied from 0.23–0.52 in the sampled orchard holdings, showing the inefficient use of energy in the orchard apple production. It is noteworthy that the ratio can be increased by increasing the crop yield (en-ergy equivalent of apple is relatively low) and/or by decreasing energy inputs consumption (input man-agement). Similar results were reported for different orchard plants such as 0.96 for cherry (Kizilaslan
2009) and 0.97 for apple (Hasanzadeh, Rahbar 2005), some higher energy ratios were reported such as 1.00 for apple (Strapatsa et al. 2006) and 3.37 for apricot (Gezer et al. 2003) in the literature. The results indicate that energy productivity and net energy were 0.19 kg/MJ and –64,556 MJ/ha, re-spectively. This means that 0.19 units output was obtained per unit energy. Calculation of energy productivity is well documented in the literature for different crops such as soybean (0.18) (De et al. 2001), potato (0.35) (Mohammadi et al. 2008) and cherry (0.51) (Kizilaslan 2009). The calculated net energy is negative (less than zero) implying that in apple production, energy was lost. Results showed that economic productivity is better than energy productivity, which means that only economic issue is more important for farmers in the region. This is something that governments should take into con-sideration, and take some steps such as managing for agricultural inputs, training farmers, introducing newer technologies, etc., to make the task beneficial both from economical and energetic points of view.
The results revealed that the share of human energy and human expenses were 3% of total energy and 34% of total expenses, respectively (human energy is valu-able energy). Strapatsa et al. (2006), estimated hu-man energy as 2.7% of total input energy. Postharvest-ing (41%), fertilization (35%), plottPostharvest-ing (13%), irrigatPostharvest-ing (9%) and spraying (2%) operations also accounted for most of energy inputs. Table 4 showed that the share of direct input energy (29%) was much lower com-pared to that of indirect energy (71%). Also, non-re-newable and renon-re-newable energies contributed to 96.7% and 3.3% of the total energy input, respectively (this is a serious threat for environment). Several researchers found that the ratio of direct energy was higher
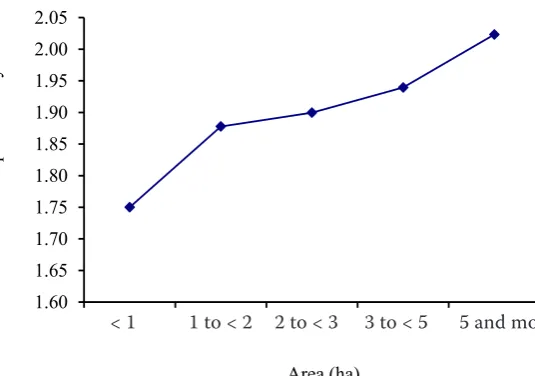
(low-Fig. 1. The relationship between farm size and economic productivity
1.60 1.65 1.70 1.75 1.80 1.85 1.90 1.95 2.00 2.05
<1 ha 1 to <2 ha 2 to <3 ha 3 to <5 ha 5 ha and more
Econo
m
ic pr
oduc
tiv
ity
Area (ha)
[image:6.595.73.341.82.270.2]er) than that of indirect energy, and the rate of non-renewable energy was greater than that of non-renewable energy consumption in cropping systems (Esengun et al. 2007; Ozkan et al. 2007; Kizilaslan 2009). Re-sults revealed that operations are carried out mostly by human energy and their share is insignificant in energy consumption compared to other inputs.
It is also useful to investigate the relationship between farm size and economic productivity and energy ratio in order to determine the efficiency of holdings (Fig. 1) as energy ratio is calculated as less than one in all apple orchards, effect of area on en-ergy ratio was not considered. From Fig. 1, it can be concluded that large size orchard holdings have a high economic productivity than smaller size hold-ings. As indicated previously, the average orchard size is 1.2 ha in the research area. Therefore, the larger holdings might have their advantages of us-ing sufficient, better management, quality inputs and output and higher level of technology due to their more favourable economical outcome. Fur-thermore, secondary tonnage of small orchards is more than that in larger orchards due to poorer management of inputs. According to Ҫetin and Vardar (2008), the benefit-cost ratio in larger farms was more successful from energy use and economic performance points of views.
econometric model estimation of apple production
Relation between the energy inputs and yield was estimated using Cobb-Douglas production function for apple orchards. Apple yield was assumed to be a function of human labor, machinery, chemical fer-tilizers, farmyard manure, chemical biocides, irri-gation, packaging, transportation, refrigerating and diesel fuel energies. Prior to model estimation, au-tocorrelation was tested using the Durbin-Watson test (Hatirli et al. 2005) for the data used in this study. This test result revealed that Durbin-Watson value was determined as 1.83 for Eq. (5), 2.06 for Eq. (6), and 1.86 for Eq (7). Hence, there was no autocorrelation at the 5% significance level in the estimated models. The coefficient of determination (R2) was found to be 0.80 (all energy inputs), 0.78
[image:7.595.62.289.101.361.2](direct and indirect energies) and 0.76 (renewable and non-renewable energies) for these models. Re-gression results for this equation are shown in Ta-ble 5. The elasticity estimates are particularly use-ful for determining the relationship between input energy and yield. Since Cobb-Douglas function was used in the estimation, the coefficient of variables in log form also represents elasticity. Packaging energy was found as the most important variable that influences yield. The elasticity for packaging energy is 3.23, implying that a given 1% change in packaging energy will result in 3.23% increase in Table 5. Econometric estimation results of energy inputs
Endogenous variable: yield Coefficient t-ratio Exogenous variables
Model 1: lnYi= b1lnX1 + b2lnX2+ b3lnX3 + b4lnX4+ b5lnX5 + b6lnX6+ b7lnX7+ b8lnX8+ b9lnX9+ b10lnX10
1. Labor energy 0.053 0.75 2. Machinery energy 0.61 4.68** 3. Chemical fertilizers energy 0.11 2.59* 4. Farmyard manure energy 0.59 3.61** 5. Chemical biocides energy –0.29 –0.231 6. Irrigation energy 0.22 0.494 7. Packaging energy 3.23 7.82** 8. Transportation energy 0.03 0.3 9. Refrigerating energy 0.044 0.6 10. Diesel fuel energy –0.076 –1.56 Durbin-Watson 1.83
R2 0.80
* and ** indicate significance at 5% and 1% probability level, respectively
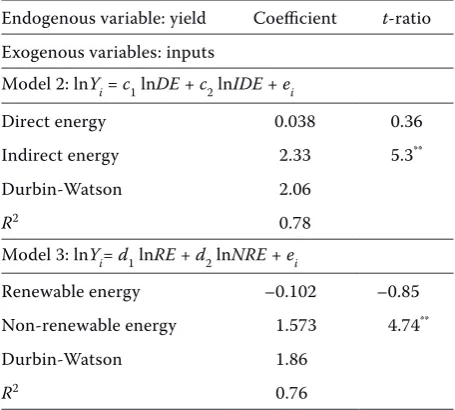
Table 6. Econometric estimation results of direct, indirect, renewable and non-renewable energies
Endogenous variable: yield Coefficient t-ratio Exogenous variables: inputs
Model 2:lnYi = c1lnDE + c2lnIDE + ei
Direct energy 0.038 0.36 Indirect energy 2.33 5.3**
Durbin-Watson 2.06
R2 0.78
Model 3: lnYi= d1lnRE + d2lnNRE + ei
Renewable energy –0.102 –0.85 Non-renewable energy 1.573 4.74**
Durbin-Watson 1.86
R2 0.76
[image:7.595.304.532.525.730.2]yield. The second important input was found as machinery with 0.61 elasticity. Other important variables that influence apple yield are farmyard manure and chemical fertilizer with elasticities of 0.59 and 0.107, respectively. The regression coeffi-cients of direct and indirect (Model 2) as well as re-newable and non-rere-newable (Model 3) energies on yield were investigated through Eq. (6) and Eq. (7), respectively. The results are given in Table 6; the re-gression coefficients of indirect and non-renewable energies were all statistically significant at 1% level, (share of non-renewable and indirect energies were calculated more than renewable and direct energy). A 1% increase in indirect or non-renewable energies increases the yield by 2.33% or 1.57%, respectively; whereas direct or renewable energies increase the yield by only 0.36% or 0.85%, respectively. Hatirli et al. (2006), reported that the impact of indirect energy was shown to be more effective than that of direct energy on yield, Hatirli et al. (2005), in-vestigated that the impact of non-renewable energy was found to be more profound than that of renew-able energy on yield.
concluSionS
Data used in this study were collected from 80 farmers located in the Oromieh Township of the West Azarbaijan province in Iran. Orchard produc-tion consumed a total of 101,505 MJ/ha energy and energy output was calculated as 45,185 MJ/ha. The results revealed that wooden packaging (57%), irri-gation (16%), fuel (10%) and chemical fertilizer (9%) were the major contributors of total energy use in ap-ple orchards. Energy productivity, net energy gain and output-input energy were calculated as 0.23 kg/MJ, –56,320 MJ/ha and 0.44, respectively. It was conclud-ed that the direct and indirect energy inputs were 29% and 71% of the total energy inputs, respectively. Re-newable energy sources among the inputs had a share of 3.3% of the total energy input, which was smaller than that of non-renewable energy sources (packag-ing is considered as non-renewable and indirect en-ergy). In this study, energy management is important; therefore, policies should emphasize on development of new technologies (application of new technologies such as packaging and irrigation are encouraged) and provide with alternative energy resources aiming at efficient use of energy (use of Goldoni tractors instead of other common tractors can save in fuel consump-tion and also prevent soil compacconsump-tion). The results
derived from this study can be used by policy makers and other relevant agencies for recommendations to farmers in order to use energy more efficiently.
The benefit-cost ratio was found to be 1.77. The mean net return from apple production was ob-tained as 6,057 $/ha. Human labor (34%) and pack-aging (30%) expenses are followed by the refrigerat-ing (19%). Due to low mechanization level in apple orchards, human expense accounted for 34% and machine 1% of total costs. Postharvesting (41%), fertilization (35%), plotting (13%), irrigating (9%) and spraying (2%) operations also accounted for most energy consumptions.
These results indicate that energy use in apple production is not efficient, leading to many envi-ronmental problems, detrimental to the natural resources by excess use of inputs. All these inputs would be useful not only for reducing negative ef-fects to environment, human health, maintaining sustainability and decreasing production costs, but also for providing higher energy use efficiency. Benefit-cost and economic productivity showed that large farms were more successful implying that large size orchard holdings have a higher economic productivity as compared with the smaller ones due to relatively better management and financial abili-ty. The elasticity estimates of packaging energy was found as 3.23, which has a major impact on apple orchard production, followed by machinery (0.61), farmyard manure (0.59) and chemical fertilizers (0.107). The impacts of direct, indirect and renew-able and non-renewrenew-able energies on yield were es-timated as 0.038, 2.33, 2.06 and 0.78, respectively.
References
Anonymous, 2005. Agricultural Census of 2003 in Azarbaijan Gharbi Province (The Statistics Center of Iran). Oromieh, Oromieh’s Office of Publication and Information. (in Persian) Anonymous, 2007. Yearly Census of Azarbaijan Gharbi
Prov-ince (The Office of Statistics and Technology Information). Oromieh, Deputy of Planning of The Governor General Office of Azarbaijan Gharbi Province. (in Persian) Anonymous, 2008a. Food and Agriculture Organization (FAO).
Available at: www.fao.org. (accessed November 27, 2010). Anonymous, 2008b. Institute of Standards and Industrial
Research of Iran. Available at: www. isiri.org. (accessed June 17, 2008).
Ҫetin B., Vardar A., 2008. An economic analysis of energy requirements and input costs for tomato production in Turkey. Renewable Energy, 33: 428–433.
De D., Singh R.S., Chandra H., 2001. Technological impact on energy consumption in rainfed soybean cultivation in Madhya Pradesh. Applied Energy, 70: 193–213.
Demircan V.K., Ekinci H.M., Keener D., Akbolat C., Ekin-ci A., 2006. Energy and economic analysis of sweet cherry production in Turkey: A case study from Isparta province. Energy Conversion and Management, 47: 1761–1769. Esengun K., Erdal G., Gunduz O., Erdal H., 2007. An
economic analysis and energy use in stake-tomato pro-duction in Tokat province of Turkey. Renewable Energy,
32: 1873–1881.
Fadavi R., Keyhani A., Mohtasebi S.S., 2010. Estimation of a mechanization index in apple orchard in Iran. Journal of Agricultural Science, 2: 180–185.
Gezer I., Acaroglu M., Haciseferogullari H., 2003. Use of energy and labour in apricot agriculture in Turkey. Biomass and Bioenergy, 24: 215–219.
Hasanzadeh A., Rahbar S., 2005. Study of energy flow in ap-ple orchards Azarbaijane Gharbi Province. In: The 4th Iranian
Congress onHorticultural Science, November 10–12, 2005. Ferdosi Mashad University, Mashad, Iran. (in Persian) Hatirli S.A., Ozkan B., Fert C., 2005. An econometric
analysis of energy input-output in Turkish Agriculture. Renewable and Sustainable Energy Reviews, 9: 608–623.
Hatirli S.A., Ozkan B., Fert C., 2006. Energy inputs and crop yield relationship in greenhouse tomato production. Renewable Energy, 31: 427–438.
Kennedy S., 2000. Energy use in American agriculture. Avail-able at: http://web.mit.edu/10.391J/www/proceedings/Agri-culture_Kennedy2000.pdf (accessed January 5, 2000). Kitani O., 1999. CIGR, Handbook of Agricultural
Engineer-ing. Vol. 5.Energy and Biomass Engineering. St. Joseph, ASAE publication.
Kizilaslan H., 2009. Input-output energy analysis of cherries production in Tokat province of Turkey. Applied Energy, 86: 1354–1358.
Mandal K.G., Saha K.P., Gosh P.L., Hati K.M., Bandyo-padhyay K.K., 2002. Bioenergy and economic analyses of
soybean-based crop production systems in central India. Biomass Bioenergy, 23: 337–345.
Mohammadi A., Tabatabaeefar A., Shahin S., Rafiee S., Keyhani A., 2008. Energy use and economical analysis of potato production in Iran a case study: Ardabil province. Energy Convers Manage, 49: 3566–3570.
Ozkan B., Akcaoz H., Fert C., 2004a. Energy input-output analysis in Turkish agriculture. Renewable Energy, 29: 39–51.
Ozkan B., Akcaoz H., Karadeniz F., 2004b. Energy require-ment and economic analysis of citrus production in Turkey. Energy Conversion and Management, 45: 1821–1830. Ozkan B., Fert C., Karadeniz C.F., 2007. Energy and cost
analysis for greenhouse and open field grape production. Energy, 32: 1500–1504.
Singh J.M., 2000. On farm energy use pattern in different cropping systems in Haryana, India. [PhD Thesis.], Ger-many, International Institute of Management, University of Flensburg.
Singh S., Mittal J.P., 1992. Energy in Production Agriculture. New Delhi, Mittal Publications.
Singh S., Singh S., Mittal J.P., Pannu C.J.S., 1998. Frontier energy use for the cultivation of wheat crop in Punjab. Energy Conversion and Management, 39: 485–491.
Singh H., Mishra D., Nahar N.M., 2002. Energy use pattern in production agriculture of a typical village in arid zone India: part I. Energy Conversion and Management, 43: 2275–2286. Singh H., Mishra D., Nahar N.M., Ranjan M., 2003. Energy
use pattern in production agriculture of a typical village in arid zone India: part II. Energy Conversion and Management,
44: 1053–1067.
Strapatsa A.V., Nanos G.D., Tsatsarelis C.A., 2006. Energy flow for integrated apple production in Greece. Agriculture, Ecosystem and Environment, 116: 176–180. Yamane T., 1967. Elementary Sampling Theory. New Jersey,
Prentice-Hall Inc.
Yilmaz I., Akcaoz H., Ozkan B., 2005. An analysis of energy use and input costs for cotton production in Turkey. Renew-able Energy, 30: 145–155.
Received for publication February 11, 2010 Accepted after corrections January 2, 2011
Corresponding author:
M.Sc. Raheleh Fadavi, University of Tehran, Faculty of Agricultural Engineering and Technology, Department of Agricultural Machinery Engineering, Karaj, Iran