Area based Dynamic Traffic Control System
Abhilash Sharma1, Anushree Goud2
1, 2
Bharati Vidyapeeth Institute of Management and Information Technology, Navi Mumbai
Abstract: The proposed system is developed with the aim to reduce traffic congestion. This system is designed to provide the appropriate signal timing so that the traffic clogging is reduced. The prevailing system includes setting fixed signal timing for each lane irrespective of the number of cars present at the traffic signal. Therefore, the green signal time given to each lane would be the same even if the lane has few cars or a wide number of cars, which is one of the reasons for traffic congestion. Thus the proposed system makes use of image processing and calculates the number of cars in every lane based on the car area and appropriately renders the traffic signal timing.
Keywords: Area; Image processing; Traffic congestion; Traffic signal
I. INTRODUCTION
Today the car population has increased highly as compared to the previous years. In a report released by the ward’s auto in 2010, the total number of cars globally present exceeds 1.015 billion. This is enough to give us the idea about the ratio of a number of cars by a number of people in the world. With such high numbers, it is evident to result in a number of problems. One such problem is traffic congestion.
The traffic jam at the signals not only troubles the commuters but also results in noise pollution which further does more harm to the people. Traffic congestion can lead to vehicle owners becoming irritated and thus, resulting in road rage. The traditional method that is used at the signals of providing the fixed amount of time for each lane does hardly any good and leads to more traffic congestion. Also, more traffic at one side would require more green time as compared to the fixed signal time. An alternative to the conventional method is to use a system that calculates the approximate number of cars present at the signal and based on that provides the green signal time.
This is done by capturing the image and converting it into grayscale, applying the threshold and then complimenting the image. The count is then estimated by calculating the area of the car region. Finally, based on the count, the signal time is allocated. Raspberry Pi as a microcontroller can be used to provide the signal time.
II. LITERATURE RIVIEW
The author gives information of traffic congestion on road day by day becoming more problematic. This research has focused on the Visual Recognition. And also taken spot sensors such as loop detectors and pneumatic sensors, which are more expansive and their maintenance also, this cannot be affordable to developing country. Also results in road land deformation. As a result visual recognition of density based traffic control is better. For this, cameras can be installed at Traffic signal light. Cameras has to install at height to get a clear and larger view of the road.
The camera takes pictures, system convert in grayscale then threshold again it is converted in to canny and then Erode which provide broad edge [1] Which helps to count the vehicles, The traffic density measures only the ratio between the density of the vehicles and the total density of the road. For all roads based on that, timing is allocated [1]. The timing for traffic light will be calculated each time change automatically depending upon the traffic load.
The system will have a camera mounted on the motor for its rotation to face lanes and sense the traffic on the road, The camera is controlled by PC through a microprocessor to move the camera in lane and capture image [2]. The system will be intelligent and will calculate the time every time and operate in a cyclic clockwise signal lights control The emergency will have high priority and the required lane will be open after closing all others.
III. OBJECTIVE
The basic aim of this research is:
A. To enable dynamic traffic signal timing
B. To reduce traffic congestion at signals.
C. To decrease noise pollution.
IV. PROPOSED MODEL
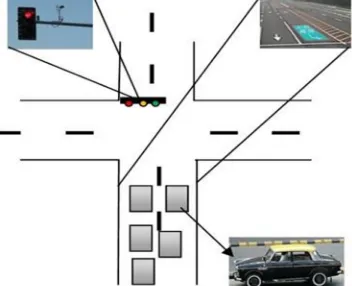
[image:2.612.229.405.227.370.2]The camera is situated at the top of the signal to achieve an unhindered view of the traffic for every lane. This camera will capture the image of the traffic every time the signal goes red so that the image can be processed and appropriate green signal timing can be provided. Also, the camera is required to be positioned at an appropriate height so that the image taken does not have cars overlapping each other.
Figure 1: System Architecture
A. Block Diagram
The block diagram includes a high-definition camera that would capture the image of the traffic, a microcontroller such as Raspberry Pi - that would perform the processing over the image. The block diagram also includes a power supply to power the camera, microcontroller as well as the traffic signal.
Figure 2: Block Diagram
V. ALGORITHM
1) Step 1: Start.
2) Step 2: Read the source image present in RGB value.
3) Step 3: Convert the source image into a grayscale image.
4) Step 4: Apply threshold to the output image from the previous step.
5) Step 5: Compliment the threshold image.
6) Step 6: Draw boundary for every black colored region. Step 7: Calculate the area for every black colored region. Step 8: Create a variable to store the count.
7) Step 9: Check whether the area for each black shaded region is in the range 250 and 3000.
8) Step 10: If yes? Then increment the count.
9) Step 11: Display count.
[image:2.612.193.428.458.546.2]VI. IMAGE COMPUTING
The image processing includes a number of steps to retrieve the total count of the cars in the image.
A. Source Image
[image:3.612.184.385.140.292.2]This is the source image in RGB value taken by the camera for processing.
Figure 3: Source Image
B. Grayscale Image
[image:3.612.192.420.341.492.2]The source image is then converted to the grayscale image which involves shades of gray. This is done because multiple colors are complex to process and also it helps to remove noise from the image making it easier to compute.
Figure 4: Grayscale Image
C. Threshold Image
The main purpose to threshold an image is to simplify the image segmentation. The threshold applied over the grayscale image helps us to get a binary image i.e. image having only 2 colors – black and white. Threshold image helps to easily partition the input image into background and foreground and perform segmentation over the image.
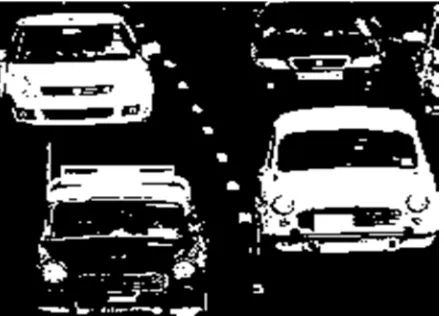
[image:3.612.209.431.561.719.2]D. Compliment Image
[image:4.612.191.420.117.298.2]The output threshold image is then complemented to reverse the colors of the region. This is done so that the cars present in the image can have the black color region.
Figure 6: Compliment Image
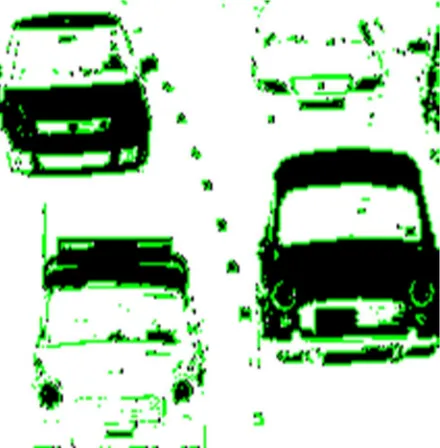
E. Applying Boundaries
In the final step, a boundary is applied to each of the black colored region and area is calculated for each region which then helps us to calculate the total number of cars in the image.
Figure 7: Compliment image with boundaries
VII. INPUT
To the proposed system, a number of images are given as an input to check the output given by the system. The source for a few of the image is Google.
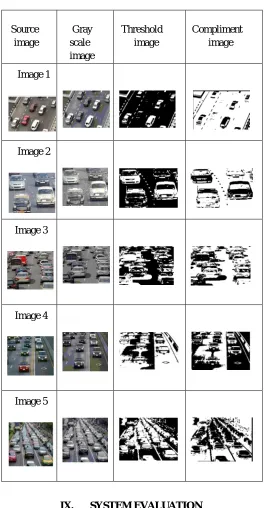
VIII. OUTPUT
For each of the input, there are a number of different images generated as given below in the table. The program is run onto scripts in MATLAB and the output is displayed on the screen.
[image:4.612.197.417.358.582.2]Table 1: Output Table [Source:References[7]]
IX. SYSTEM EVALUATION
[image:5.612.174.440.96.604.2]This involves the parameters on the basis of which the calculations are done.
Table 2: Parameters Source
image
Gray scale image
Threshold image
Compliment image
Image 1
Image 2
Image 3
Image 4
Image 5
PARAMETER CHARACTERISTICS
Area of shaded region Between 250 and 3000 pixel
Line of sight 200-300 meters
Camera High- definition above 8
A. Result Table
[image:6.612.165.454.117.235.2]Result from the output based on the parameters: The result is calculated analytically.
Table 3:Result
From the table, the result for image 2 is accurate; the result for image 1 and 4 is good and is satisfactory as the value is close and is good enough for us to determine the green signal time.
The result for image 3 and 5 is poor and not satisfactory. This is due to the angle at which the photo is taken. In the image, the cars appear very close to each other and therefore it becomes difficult to calculate the number of cars.
X. CONCLUSION
For the proposed system, the area measurement is done using MATLAB r2013a as software for processing the image which performs all the image processing steps described in the paper to the source image.
Thus the proposed system gives us the appropriate result i.e. the actual number of cars in the image and the result are close and this would help us in dynamically setting the time for the traffic signal. The important requirement that the system has is the placement of the camera. The camera must be at such an angle that the cars do not appear very close to each other or overlap each other. The system here is implemented using MATLAB as software but can also be done using OpenCV software which is open source software and can also be used in real time.
XI. ACKNOWLEDGMENTS
I would like to express my thanks to the people who have helped me most throughout my Research Paper. I am grateful to my Prof.Dr.Suhasini Vijaykumar and Prof. Anushree Goud
for nonstop support for the Research Paper.
A special thank of mine goes to my colleague who helped me out in completing the project, where they all exchanged their own interesting ideas, thoughts and made this possible to complete my Research Paper with all accurate information. I wish to thank my parents for their personal support or attention who inspired me to go my own way.
At last but not the least I want to thank my friends who treasured me for my hard work and encouraged me and finally to God who made all the things possible for me till the end.
XII. BIBLIOGRAPHY
A. T.Mani, A.Nandha Kumar, M.Dhanapal, A.Satishkumar, R. Hemalatha, I.Vinodhini: “Density based Traffic lightControl
System”. http://www.ijarmate.com/index.php?option=com_login&task =download...
B. Huff post news http://www.huffingtonpost.ca/2011/08/23/car- population_n_934291.html
C. Image threshold https://www.mathworks.com/discovery/image- thresholding.html
REFERENCES
[1] Vidhya K, Banu AB. Density based traffic signal system. International Journal of Innovative Research in Science, Engineering and Technology. 2014 Mar;3(3):2218-22..
[2] Tina R, Sharmila SG. Density Based Traffic signal System. International Journal and Magazine of engineering Technology Management and Research. 2015 Sep;2(9):149-5
[3] An Introduction to Digital Image Processing with Matlab http://www.math.hkbu.edu.hk/~zeng/Teaching/math3615/ ls.pdf
Image Output Actual number Result
Image1 5 7 Good
Image 2 4 4 Accurate
Image 3 7 15 Poor (cars are close
To each other)
Image 4 11 12 Good (cars are
Scattered)