BUNCH, Josephine.
Available from Sheffield Hallam University Research Archive (SHURA) at: http://shura.shu.ac.uk/19408/
This document is the author deposited version. You are advised to consult the publisher's version if you wish to cite from it.
Published version
BUNCH, Josephine. (2005). Detection and imaging of pharmaceutical compounds in skin by MALDI-MS. Doctoral, Sheffield Hallam University (United Kingdom)..
Copyright and re-use policy
1 01 8 2 6 2 0 0 8
are charged at 50p per hour
All rights reserved INFORMATION TO ALL USERS
The quality of this reproduction is dependent upon the quality of the copy submitted. In the unlikely event that the author did not send a com plete manuscript and there are missing pages, these will be noted. Also, if material had to be removed,
a note will indicate the deletion.
uest
ProQuest 10694289
Published by ProQuest LLC(2017). Copyright of the Dissertation is held by the Author. All rights reserved.
This work is protected against unauthorized copying under Title 17, United States C ode Microform Edition © ProQuest LLC.
ProQuest LLC.
789 East Eisenhower Parkway P.O. Box 1346
Pharmaceutical Compounds
in Skin by M ALDI-MS
Josephine Bunch B.Sc. (Hons)
A thesis submitted in partial fulfilment of the requirements of
Sheffield Hallam University
for the degree of
D octor of PhilosophyI would like to take this opportunity to thank my supervisor at Sheffield Hallam University, Dr Malcolm Clench, for all his advice and support throughout this project.
I am grateful to Pfizer Global R&D, for sponsorship of this work, and thank my external advisor, Dr Don Richards, for all his assistance throughout this project.
Images presented in this thesis were constructed using beta test ion ima ging software, kindly supplied by MDS Sciex, Ontario, Canada. I would like to thank Dr Julie Wingate at MDS Sciex for all her support in using this application.
Kind thanks are due to Stuart Creasey and Jonnie Plumb, at Sheffield Hallam University, for their assistance with the SEM and confocal mi croscopy work respectively.
I gratefully acknowledge financial support from the British Mass Spectro metry Society, enabling my attendance at the International Conference for Mass Spectrometry (IMSC), Edinburgh, 2003.
Special thanks to Sam Ramsay for all his help with the ‘spot calculator and for all the Saturday mornings.
Thanks to Brendan, Karen, Sally, Paul and Jill for making life in the lab so much fun. And thanks to Alysia, Gerard, Sam, Tim, Gail, Scarlet, Kerry, Claire, Jane and Alice for making life outside the lab so much fun.
Mass spectrometric techniques have been developed recently for the ex amination of biological tissue samples. Tandem mass spectrometry has been employed for the detection of pharmaceutical compounds and also mass spectrometric ‘images’ have been produced which show the spatial distribution of peptides, proteins and drugs in tissue.
In this thesis, a programme of method development for the detection and imaging of topically applied pharmaceutical compounds in porcine epidermal tissue by MALDI-TOF-MS is presented.
Direct analysis of fresh tissue sections was compared with the analysis of tissue imprints formed by blotting onto a variety of substrates. The samples were coated with matrix material by a prototype electrospray deposition device. Analyses were performed on a linear time-of-flight (LaserTOF 1500, SAI) mass spectrometer. Direct analysis of tissue and analysis of the C18 blots gave irreproducible data. Problems with matrix layer in-homogeneity were experienced with nitrocellulose and polyvinyl difluoride (PVDF) membranes. Reproducible data were obtained by analysis of tissue imprints created on carbon and cellulose membranes. All subsequent work was conducted using an Applied Biosystem Qstar
pulsar i hybrid quadrupole time-of-flight mass spectrometer fitted with
an orthogonal MALDI ion source and ion imaging software. The advant ages of superior mass accuracy and resolution with such an instrument configuration were investigated.
Electrospray and airspray methods were compared for analysis of tissue imprinted carbon and cellulose membranes. A novel method of pre coating cellulose membranes in matrix by airspray prior to the blotting procedure was developed. The method was found to retain the expected distribution of the analyte.
Ion images demonstrating the permeation of the applied compound into the skin were achieved by imaging a cross sectional imprint of treated tissue on a cellulose membrane precoated in matrix material. A calib ration graph for the determination of ketoconazole was prepared using the sodium adduct of the matrix ion as an internal standard. This en abled construction of a quantitative profile of drug in skin. Conventional haematoxylin and eosin staining and microscopy methods were employed to obtain a histological image of the porcine epidermal tissue. Super imposing the mass spectrometric and histological images revealed drug permeation into the dermal tissue layer.
1 Introduction 1
1.1 Mass spectrom etry... 1
1.1.1 Desorption ionisation... 1
Laser desorption and matrix-assisted laser desorption/ionisation mass spectrom etry... 2
1.1.2 Principles of M A LD I... 3
L a se rs... 3
The m a tr ix ... 5
Methods of matrix preparation/application... 9
1.1.3 MALDI ion fo rm atio n ... 12
Primary ion form ation... 13
Secondary ion form ation...15
1.1.4 Desorption mechansisms... 16
1.1.5 Time-of-flight mass spectrom etry... 16
Reflectron T O F ... 18
Delayed ex tractio n ... 19
Latest instrument developments... 20
1.2 Imaging mass spectrom etry... 21
1.2.1 Imaging MALDI M S ... 22
Imaging thin-layer chromatography (TLC) p la te s ...23
Imaging biological sam ples...24
1.3 Dermal ab so rp tio n ... 29
1.3.1 The structure of s k in ... 29
1.3.2 The skin barrier... 32
1.3.4 Methods for the analysis of percutaneous absorption and quan
tification of drugs in skin... 36
In vivo vs. in vitro methods ...36
In vivo assessm ent... 36
In vitro assessment...39
2 The Preparation of Tissue Samples for the Determination of Phar maceutical Compounds by MALDI-TOF-MS 41 2.1 Introduction... 41
2.2 E xperim ental... 42
2.2.1 Materials ... 42
2.2.2 Instrumentation... 44
2.2.3 M ethods... 45
2.3 Results and discussion... 46
2.3.1 Evaluation of the suitability of different analytes... 47
Aciclovir...47
Piroxicam ...47
Ketoconazole...52
2.3.2 Comparison of direct tissue analysis vs. tissue blotting for the determination of ketoconazole in skin by MALDI-TOF-MS. . . 55
Direct analysis of drug treated tis s u e ...55
C18 b e a d s...56
C18 Envidiscs...56
Nitrocellulose membranes ...58
Polyvinyl difluoride (Immobilon P PVDF) membranes . . . . 60
Cellulose m em branes...60
Polyethylene-filled carbon conductive membrane...65
2.3.3 Assessment of matrix coverage...67
2.4 Conclusions...78
3 Imaging Tissue Imprints by MALDI-Q-TOF-MS 82 3.1 Introduction...82
3.2.1 Materials ...85
3.2.2 Instrumentation... 85
3.2.3 M ethods...85
3.3 Results and discussion... 85
3.3.1 MALDI-Q-TOF analysis of aciclovir and piroxicam ... 85
Mass determination of ketoconazole by MALDI-Q-TOF MS . 87 MALDI-Q-TOF analysis of membranes...92
Imaging the membrane... 97
3.4 Conclusions...106
4 Optimisation of methods of matrix application for analysis of treated tissue 109 4.1 Introduction...109
4.2 E xperim ental...110
4.2.1 Materials ... 110
4.2.2 Instrumentation...110
4.2.3 M ethods... 110
Comparison of electrospray and airspray matrix deposition on carbon and cellulose membranes... 110
Treatm ent...I l l Membrane preparation and tissue b lo ttin g ... I l l Direct tissue analysis...I l l 4.3 Results and discussion...112
4.3.1 Electrospray matrix deposition ...112
4.3.2 Airspray deposition...112
Analysis of tissue-imprinted carbon membranes: matrix ap plied after the blotting procedure... 117
Analysis of tissue-imprinted cellulose membranes: matrix ap plied after the blotting procedure... 120
Analysis of tissue imprinted carbon membranes: matrix ap plied prior to the blotting procedure... 120
4.3.3 Direct tissue analysis...125
4.4 Conclusions... 131
5 Analysis of a Vertical Imprint of Drug-treated Tissue with respect to the Quantification of Ketoconazole at Different Tissue Depths 133 5.1 Introduction... 133
5.2 Experim ental... 135
5.2.1 Materials ... 135
5.2.2 Instrumentation...135
Sample preparation for optical microscopy... 136
Tissue treatment and membrane preparation...136
Imaging the membrane...136
5.3 Results and discussion... 136
5.3.1 Quantification of drugs in sk in ... 138
5.4 Conclusions... 147
6 M ethods for the Quantification of Drug in Tissue by Imaging MALDI-TOF-MS and a Comparison with HPLC Corneum Tape Stripping 149 6.1 Introduction... 149
6.2 Experim ental... 150
6.2.1 Materials ... 150
6.2.2 Instrumentation...150
6.2.3 M ethods... 150
Optimisation of HPLC determination of ketoconazole in tape strippings...150
Topical treatm en ts...151
Tape stripping... 152
HPLC a n a ly sis... 152
Tissue blotting and corneum tape stripping ... 152
MALDI-MS analysis of m em branes...152
6.3 Results and discussion... 153
6.3.2 Determination of ketoconazole in porcine epidermal tissue by corneum tape stripping/HPLC... 158 6.3.3 Determination of ketoconazole in porcine epidermal tissue by
corneum tape stripping/tissue blotting with analysis by MALDI- TOF-MS ...158 6.4 Conclusions... 163
7 Conclusions and Further Work 165
Appendix A 174
Appendix B 181
1.1 Energy absorption, ionisation and formation of molecular ion... 4
1.2 Chemical structures of some commonly-used MALDI matrices . . . . 7
1.3 MALDI-TOF-MS (linear time-of-flight)...18 1.4 Reflectron TOF mass spectrometer... 19 1.5 The integumentary system consists of skin, associated appendages,
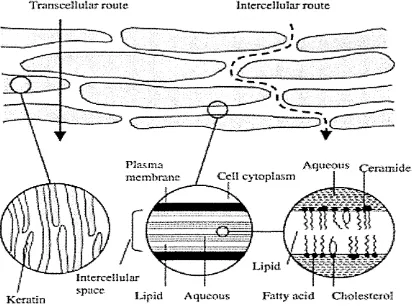
muscles and nerves (from [128])... 30 1.6 Layers of the epidermis (from [129])...31 1.7 Permeation routes through the stratum corneum: (i) via the lipid
matrix between the corneocytes (intercellular route) and (ii) across the corneocytes and the intercellular lipid matrix (transcellular route) [144]. 1.8 Schematic representation of the method of tape stripping for determ
ination of the amount of drug penetrated into the skin. After ap plication of the formulation at the donor site (a) and removal of the formulation, the stratum corneum is progressively removed by tape
stripping (b) [159]... 38
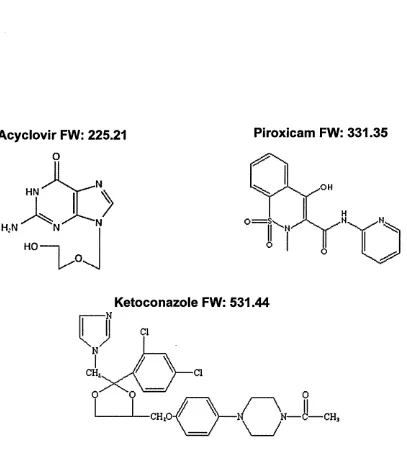
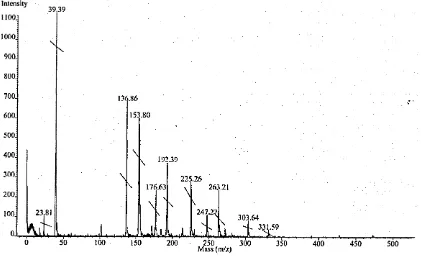
2.1 Structures and formula weights of the pharmaceutical analytes . . . . 43 2.2 Electrospray deposition device employed in these investigations . . . . 45 2.3 MALDI mass spectrum of aciclovir showing the protonated drug mo
lecule [M+H]+ at m /z 225, and the sodium and potassium drug
adducts at m /z 247 and 263 respectively. DHB-associated peaks,
[Matrix+H]+ at m /z 154; [Matrix+Na]+ at m /z 176; and [Matrix+K]+
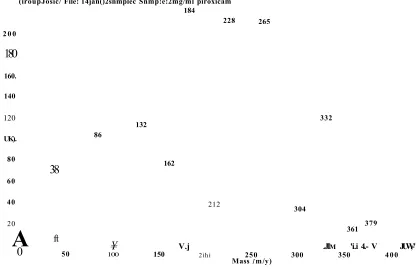
2.4 MALDI mass spectrum of piroxicam-treated tissue showing the pro-
tonated analyte ion [M+H]+ at m /z 332. Expected matrix peaks
at m /z 191: [Matrix+H]+; m /z 212: [Matrix+Na]+; and m /z 228:
[Matrix+K]+ are also observed. The matrix dimer ion is present at
m /z 380. Drug-treated tissue was mounted from 3551 mm, and coated
in a-CHCA by electrospray deposition... 49
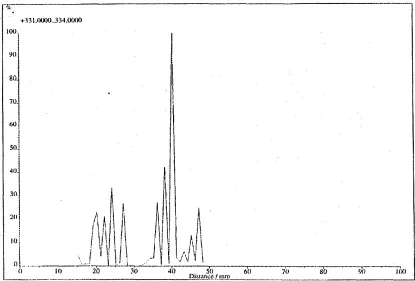
2.5 Summed ion chromatogram for the range m /z 330-334 demonstrat
ing that compounds were detected from 15-28 mm and 32-48 mm. Treated tissue was mounted between 15-48 mm and coated in a- CHCA by electrospray deposition...50 2.6 MALDI mass spectrum acquired at a position on the target where
no tissue was present. A peak at m /z 332 can be seen with an ion
intensity of approximately 120. Matrix associated peaks are observed
at m /z 212: [M+Na]+; m /z 228: [M-f-K]+. The matrix dimer is
present at m /z 379. Treated tissue was mounted onto a MALDI
target and coated in a-CHCA by electrospray deposition...51
2.7 MALDI mass spectrum of untreated tissue, showing a peak at m /z
333. Tissue was coated in a-CHCA by electrospray deposition... 53 2.8 MALDI mass spectra for (a) untreated tissue, and (b) ketoconazole-
treated tissue. Spectrum (a) clearly shows an absence of possibly- interfering peaks, while (b) clearly shows successful detection of the protonated analyte. Tissue was coated in a-CHCA by electrospray deposition...54
2.9 Summed ion chromatogram for the mass range m /z 531-533. No
compounds in this range were detected between 32-42 mm. Treated tissue was mounted from 32-44 mm and coated in a-CHCA by elec trospray. ... 55 2.10 MALDI mass spectrum of a ketoconazole-treated tissue imprint on
C18 beads. The analyte is detected at m /z 531 with a relative ion in
tensity of approximately 240. Matrix-associated peaks are observed
at m /z 190: [Matrix-fH]+; m /z 212: [Matrix+Na]+; and m /z 379
2.11 MALDI mass spectrum of a ketoconazole-treated tissue imprint on a
nitrocellulose membrane. The analyte is detected at m /z 530 with a
relative ion intensity of approximately 1600. Matrix-associated peaks
are observed at m /z 190: [Matrix+H]+; m /z 211: [Matrix+Na]+;
m /z 226.8: [Matrix+K]+; and m /z 379 [Matrix+Matrix]+. The
sample was coated in a-CHCA by electrospray deposition...58
2.12 Summed ion chromatogram for the range m /z 531-533. Greatest ion
intensities were observed between 41-43 mm. Tissue was treated with ketoconazole and blotted onto a nitrocellulose membrane coated with a-CHCA by electrospray. The original treatment area corresponded to between 38 and 43 mm... 59 2.13 MALDI mass spectrum of a ketoconazole-treated tissue imprint on
a PVDF membrane. The analyte is detected at m /z 530 with a re
lative ion intensity of 1000. Matrix-associated peaks are observed
at m /z 211: [Matrix+Na]+; m /z 227: [Matrix+K]+; and m /z 379:
[Matrix+Matrix]+. The sample was coated in a-CHCA by electros pray deposition...61
2.14 Summed ion chromatogram for the range m /z 530-533. Tissue was
mounted from 21-42 mm. Ketoconazole was pipetted onto the surface of the tissue within the diameter of a plastic ring corresponding to 24- 28 mm and subsequently blotted onto a PVDF membrane and coated with a-CHCA by electrospray...62
2.15 Summed ion chromatogram (from m /z 531-533) and mass spectra
from a confined tissue treatment tissue blotting experiment, on a cellulose membrane. The diameter of the plastic ring corresponded to 30-35 mm. The protonated analyte molecule is detected between 30.5 and 35 mm. The sample was coated in a-CHCA by electrospray deposition...63
2.16 Summed ion chromatogram (from m /z 531-533 from a standard tis
2.17 MALDI mass spectrum of a ketoconazole-treated tissue imprint on a
carbon membrane. The analyte is detected at m /z 532 with a relative
ion intensity of 170. The most abundant matrix-associated peak was
observed at m /z 212: [Matrix+Na]+. The sample was coated in a-
CHCA by electrospray deposition...
2.18 Summed ion chromatogram (from m /z 531-533) from a confined tis
sue treatment tissue blotting experiment. The tissue was treated with ketoconazole and blotted onto a carbon membrane. The membrane was coated with a-CHCA by electrospray. The original treatment area corresponded to 34-39 mm... 2.19 SEM images of Envidisc membrane coated with 15 mg-ml-1 a-CHCA
by electrospray deposition. Image acquired at 500 x magnification. . 2.20 SEM images of pvdf membrane coated with 15 mg-ml-1 a-CHCA by
electrospray deposition. Image acquired at 500 x magnification. . . 2.21 SEM images of nitrocellulose membrane coated with 15 mg-ml-1 a-
CHCA by electrospray deposition. Image acquired at 500 x magnific ation... 2.22 SEM images of cellulose membrane coated with 15 mg-ml-1 a-CHCA
by electrospray deposition. Image acquired at 500 x magnification. . 2.23 SEM images of carbon membrane coated with 15 mg-ml-1 a-CHCA
by electrospray deposition. Image acquired at 500 x magnification. . 2.24 SEM images of Envidisc membrane coated with 15 mg-ml-1 a-CHCA
by electrospray deposition. Image acquired at 3000 x magnification. 2.25 SEM images of pvdf membrane coated with 15 mg-ml-1 a-CHCA by
electrospray deposition. Image acquired at 3000 x magnification. . . 2.26 SEM images of nitrocellulose membrane coated with 15 mg-ml-1 a-
CHCA by electrospray deposition. Image acquired at 3000 x magni fication... 2.27 SEM images of cellulose membrane coated with 15 mg-ml-1 a-CHCA
by electrospray deposition. Image acquired at 3000 x magnification. 2.28 SEM images of carbon membrane coated with 15 mg-ml-1 a-CHCA
by electrospray deposition. Image acquired at 3000 x magnification.
3.1 Use of an orthogonal MALDI ion source eliminates mass shifts that arise from irregular sample surfaces... 84 3.2 Schematic diagram of the hybrid quadrupole-time of flight mass spec
trometer (Qstar pulsar i), fitted with an orthogonal MALDI ion source, as used in these investigations. Reprinted with kind permission from the oMALDI Server Users Manual, MDS Sciex, 2003... 86
3.3 MALDI mass spectrum of acyclovir acquired using the Qstar Pulsar i
a-CHCA was employed as the matrix material. The protonated
drug molecule (m/z 226) and the potassium adduct matrix ion (m/z
228) are clearly resolved as two separate peaks. Matrix-associated
peaks are also observed at m /z 172 ([Matrix-H20+H]+), m /z 190
([Matrix+H]+), and m /z 228 ([Matrix+K]+)...88
3.4 MALDI mass spectrum of acyclovir acquired using the Qstar Pulsar i.
a-CHCA was employed as the matrix material. The spectral region
of interest (m/z 225-230) from Figure 3.3 is enlarged to reveal good
resolution of drug and matrix peaks. The protonated drug molecule
(m/z 226) and the potassium adduct matrix ion (m /z 228) are clearly
resolved as two separate peaks... 89
3.5 MALDI mass spectrum of piroxicam acquired using the Qstar Pulsar i.
a-CHCA was employed as the matrix material. A cluster of peaks
with similar m /z values is evident around the protonated drug mo
lecule (m/z 332). Matrix-associated peaks are observed at m /z 172
([Matrix—i720+H]+), m /z 190 ([Matrix+H]+), m /z 212 ([Matrix-f-Na]+)
and m /z 228 ([Matrix-f-K]+)...90
3.6 MALDI mass spectrum of piroxicam acquired using the Qstar Pulsar i.
a-CHCA was employed as the matrix material. Enlarging the cluster
of peaks around m /z 332 shown in Figure 3.5 reveals that the pro
3.7 Mass measurement of the protonated molecule of ketoconazole at m /z 531.1566 across a 130 minute imaging run. Treated tissue was blot ted onto a cellulose membrane. An average error of 1.6 mmu was obtained, demonstrating the superior mass accuracy of the hybrid in strumentation. It is clear that mass accuracy is maintained across the sample surface, thus sample topography has little effect on mass values in an orthogonal MALDI arrangement. In addition the ran dom scatter of mass values indicates that mass measurements are not affected by surface sample charging, as is often noted with axial geometry. ...93 3.8 MALDI mass spectrum acquired at a position on the membrane where
no drug was blotted. No possibly interfering peaks were observed in the region m /z 530-535... 94 3.9 MALDI mass spectrum acquired at a position on the membrane where
drug treated tissue was blotted. Ketoconazole was detected at m /z
531.19 95
3.10 The background spectra can be subtracted from the sample spectra to emphasise the presence of the drug...96 3.11 Mass spectra demonstrating the chlorine isotope pattern of keto
conazole acquired with (a) an SAI LinearTOF 1500, and (b) an Ap
plied Biosystems Qstar pulsar i. This highlights the superior mass
resolution of the Q-TOF mass spectrometer...98 3.12 The start and end co-ordinates of an imaging run provide detail about
the minimum and maximum x and y values of the area, thus defining
the image area... 100 3.13 The image data acquisition search pattern, as defined within the ima
ging software application...100 3.14 MALDI-TOF-MS image of the protonated molecule of ketoconazole
on a tissue imprinted cellulose membrane... 102 3.15 MALDI-TOF-MS image of the sodium adduct of a-CHCA coating
3.16 The effect of altering the z (ion intensity) scale on image presentation. All four images were created from the same data file: by altering the
scale of ion intensity [z axis), very different images are produced. . . 104
3.17 Imaging a spot sample: an indication of the superiority of matrix deposition by electrospray...105 3.18 Confocal microscopy image of the MALDI laser spot size obtained by
analysis of heat-sensitive paper... 106
4.1 MALDI image of the sodium adduct of a-CHCA. Carbon membrane was coated in 15 mg-ml-1 a-CHCA by electrospray deposition. Image demonstrates areas of dense matrix coverage, but also areas where the electrospray procedure failed... 113 4.2 MALDI image of the sodium adduct of a-CHCA. Cellulose membrane
was coated in 15 mg-ml-1 a-CHCA by electrospray deposition. Image demonstrates areas of dense matrix coverage, but also areas where the electrospray procedure failed...114 4.3 MALDI image of the sodium adduct of a-CHCA. Carbon membrane
was coated in 25 mg-ml-1 a-CHCA by airspray deposition. Image demonstrates good area coverage of the membrane, but indicates that the matrix layer is inhomogeneous... 115 4.4 MALDI image of the sodium adduct of a-CHCA. Cellulose membrane
was coated in 25 mg-ml-1 a-CHCA by airspray deposition. Image demonstrates a relatively homogeneous matrix coverage...116 4.5 MALDI Image of the distribution of the isotopic envelope of the pro
tonated molecule [M+H]+ (m /z 531-533) of ketoconazole. Tissue was
4.6 MALDI Image of the sodium adduct matrix ion [Matrix+Na]+ (m /z 211.5-212.5). Tissue was treated with Nizoral within a triangular former. The skin was blotted onto a carbon membrane, and sub sequently coated in a-CHCA by airspray deposition. Image demon strates relatively dense and homogeneous matrix coverage, but reveals a triangular area of matrix suppression...119 4.7 MALDI Image of the distribution of the isotopic envelope of the pro
tonated molecule [M+H]+ (m/z 531-533) of ketoconazole. Tissue was
treated with Nizoral within a triangular former. The skin was blotted onto a cellulose membrane, and subsequently coated in a-CHCA by airspray deposition. Image demonstrates an unsuccessful triangular imprint, indicating analyte spreading by matrix application. Keto conazole is detected across the majority of the membrane area . . . .121
4.8 MALDI image of the sodium adduct matrix ion [Matrix+Na]+ (m/z
211.5-212.5). Tissue was treated with Nizoral within a triangular former. The skin was blotted onto a cellulose membrane, and sub sequently coated in a-CHCA by airspray deposition. Image demon strates poor matrix homogeneity as compared with the other airspray experiments...122 4.9 MALDI Image of the distribution of the isotopic envelope of the pro
tonated molecule [M+H]+ (m/z 531-533) of ketoconazole. Tissue
was treated with Nizoral within a triangular former. The skin was blotted onto a carbon membrane, precoated in a-CHCA by airspray deposition. Image demonstrates an incomplete triangular imprint. . . 123
4.10 MALDI Image of the sodium adduct matrix ion [Matrix+Na]+ (m/z
4.11 MALDI Image of the distribution of the isotopic envelope of the pro
tonated molecule [M+H]+ (m /z 531-533) of ketoconazole. Tissue was
treated with Nizoral within a triangular former. The skin was blot ted onto a cellulose membrane, precoated in a-CHCA by airspray deposition. A triangular distribution of the drug is observed. Im age demonstrates retention of spatial information when the blotting technique is employed...126
4.12 MALDI Image of the sodium adduct matrix ion [Matrix+Na]+ {m/z
211.5-212.5). Tissue was treated with Nizoral within a triangular former. The skin was blotted onto a cellulose membrane, precoated in a-CHCA by airspray deposition. Image demonstrates a triangular area of matrix suppression... 127 4.13 Image of the distribution of the isotopic envelope of the protonated
molecule [M+H]+ (m /z 531-533) of ketoconazole. Porcine epidermal
tissue was treated with 500 /d Nizoral shampoo. A 15 /xm surface section was obtained by microtoming and coated in 25 mg-ml-1 a- CHCA by airspray deposition (while mounted on the MALDI target). Image demonstrates unsuccessful ionisation of drug within the area where tissue was mounted, and analyte spreading from the tissue onto the target... 128 4.14 MALDI Image of the sodium adduct matrix ion [Matrix+Na]+ (m/z
211.5-212.5). Porcine epidermal tissue was treated with 500 /xl Nizoral
shampoo. A 15 fim surface section was obtained by microtoming and
coated in 25 mg-ml-1 a-CHCA by airspray deposition (while mounted on the MALDI target). Image demonstrates unsuccessful coverage or ionisation of matrix material within the area where tissue was mounted. Matrix is only detected outside the tissue region...129 4.15 MALDI mass spectrum of ketoconazole acquired with sinapinic acid
as the matrix material. The protonated drug molecule is detected at
5.1 MALDI Image of the distribution of the isotopic envelope of the pro
tonated molecule [M+H]+ (m /z 531-533) of ketoconazole in a vertical
section of porcine epidermal tissue. Treated tissue was bisected and a cross section was blotted onto cellulose membrane, precoated in a-CHCA by airspray deposition. The image shows a ‘vertical’ distri bution of the protonated drug molecule... 137 5.2 MALDI Image of the distribution of the isotopic envelope of the pro
tonated molecule [M+H]+ (m /z 531-533) of ketoconazole in a vertical
section of porcine epidermal tissue. In this case the treated tissue was bisected and a cross section was blotted onto cellulose membrane, precoated in a-CHCA by airspray deposition. The image shows a ‘vertical’ distribution of the protonated drug molecule. This is the same data as shown in Figure 5.1 and has been rotated through 90°, giving a clear picture of the apparent change in drug concentration with depth... 139 5.3 MALDI mass spectrum of ketoconazole treated tissue imprint on a
cellulose membrane, precoated in a-CHCA by airspray deposition. The sodium matrix adduct ion is the most abundant matrix associ ated p e a k ... 140 5.4 MALDI images of a-CHCA on cellulose membrane: (a) the proton
ated molecule (m /z 190), (b) the sodium adduct (m/z 212), (c) the
potassium adduct (m/z 228), and (d) the matrix dimer (m/z 379). . 141
5.5 Calibration plot for the determination ketoconazole 0.25-1.75 mg con
structed using the intensity of the Na adduct of a-CHCA ion at m /z
212 as an ‘internal standard’ (y = 1.06992: + 0.3566, r2 = 0.9224.) . . 142
5.6 Calibration plot for the determination ketoconazole 0-0.4 mg-ml-1 constructed using the intensity of the Na adduct of a-CHCA ion at
5.7 A 2D representation of the data presented in Figure 5.1 was enlarged within the software to reveal pixels. Each pixel within the image corresponds to an individual mass spectrum. The ratio of drug to matrix in these spectra was used to calculate the concentration of drug at each location by rearranging the straight line equation obtained from the calibration plot shown in Figure 5.6... 5.8 A quantitative profile of ketoconazole in porcine skin constructed from
examination of selected spectra acquired during an imaging run. . . 5.9 Confocal microscope image of a cross section of porcine skin. The
sample was prepared by conventional haemotoxylin and eosin staining methods... 5.10 The mass spectrometric image is superimposed upon a histological
image to reveal that the drug is absorbed into the dermal skin layer. All concentrations are equivalent to concentration in solution... 147
6.1 Chromatogram obtained from analysis of tape used to strip the sur face of treated tissue. Porcine epidermal tissue was treated with 50 /zl Nizoral shampoo. Following incubation the surface layer was removed by stripping with Sellotape. Ketoconazole was extracted from the tape over 16 hours in an 80:20 mixture of acetonitrile and TEA buf
fer, containing tetahydroxybenzophenone as internal standard. 5 fA
of the extracted mixture was injected into the chromatographic sys tem. Separation was performed on a Supelco C18 column, the mobile phase (14-3% THF, 31-7% TMAH buffer, 55% acetonitrile) was set at a flow rate of0-15ml*min_1. UV detection was performed at 232 nm. Ketoconazole was detected at 9-65 minutes, the internal standard was detected at 4-66 minutes. The figure annotations refer to the elution times (in minutes) of detected compounds. Peak areas of the internal standard (eluted at 4.66 minutes) and ketoconazole (eluted at 9.65 minutes) were reported as 633608 and 559201 respectively...154
144
145
6.2 Chromatogram obtained from analysis of tape used to strip untreated tissue: The surface layer of porcine epidermal tissue was removed by stripping with sellotape. The tape was subsequently digested over 16 hours in an 80:20 mixture of acetonitrile and TEA buffer, con taining tetahydroxybenzophenone as internal standard. 5/zl of the digestion/extraction mixture was injected into the chromatographic system. Separation was performed on a Supelco C18 column, the mobile phase (14-3% THF, 31-7% TMAH buffer, 55% acetonitrile) was set at a flow rate of0-15ml-min_1. UV detection was performed at 232 nm The internal standard was detected at 4.66 minutes. No peaks were detected at around 9-6 minutes, indicating that no com pounds were removed from the tissue or extracted from Sellotape that might have interfered with the determination of ketoconazole. The figure annotations refer to the elution times of detected compounds (in minutes). The peak area of the internal standard (eluted at 4.66 minutes) was reported as 604902... 155 6.3 Chromatogram obtained from analysis of 100mg-ml_1 solution of
6.4 Calibration plot for the determination of ketoconazole (0—100 /zg-ml-1) by HPLC. Ketoconazole was prepared in an 80:20 mixture of acet onitrile and TEA buffer, containing 100 /zg-ml-1 tetrahydroxybenzo- phenone as an internal standard. Samples of 5 /d were injected into the chromatographic system. Separation was performed on a Supelco C18 column, the mobile phase (14-3% THF, 31*7% TMAH buffer, 55% acetonitrile) was set at a flow rate of0-15ml-min_1. UV detection was performed at 232 nm, ketoconazole was detected at 9-6 minutes, the internal standard was detected at 4-6 minutes. The ratio of peak areas of ketoconazole and the internal standard were plotted against
concentration of ketoconazole (y = 0.0104a; + 0.0185, r2 = 0 • 9974). . 157
6.5 A quantitative profile of ketoconazole in porcine epidermal tissue by tape stripping/HPLC analysis. Tetrahydroxybenzophenone was em ployed as the internal standard. The tape strip number provides a measure of relative depth within the skin... 159 6.6 A quantitative profile of ketoconazole in porcine epidermal tissue by
tape stripping/tissue blotting/ MALDI-MS analysis. Treated tissue was blotted onto matrix coated membranes following sequential tape stripping. Whole membranes were analysed by MALDI-MS. The ratio of drug:to matrix was calculated from the TIC file, and the calibra tion previously presented in Chapter 5 was used to relate this to an equivalent concentration of ketoconazole. Tape strip number provides a measure of relative depth within the skin... 160
7.1 Digital photograph of the potato tuber section that was blotted onto matrix coated cellulose membranes... 175
7.2 MALDI image of the distribution of an ion observed at m /z 381. This
7.3 MALDI image of the distribution of an ion observed at m /z 852. This is thought to be the sodium adduct of aceto-acetyl-CoA. A cross section of a potato leaf was blotted onto a cellulose membrane pre coated in a-CHCA...178
7.4 MALDI image of the distribution of an ion observed at m /z 852.
1.1 Lasers employed in MALDI-MS... 5 1.2 Possible pathways for MALDI ion formation (as reviewed by Zenobi
Introduction
1.1 Mass spectrometry
Mass spectrometry is concerned with the separation of matter according to atomic and molecular mass. The technique may be described as the science of ‘weighing’ individual atoms and molecules. This is accomplished using instrumentation that generates gas-phase ions from the analyte that are then subjected to electrostatic and/or magnetic fields. The gas-phase ions are mass measured or discriminated based on their interaction and trajectories within these fields. Samples may be in troduced in gas, liquid or solid states. In the latter two cases, volatilisation must be accomplished either prior to, or accompanying ionisation. Many ionisation tech niques are available to produce charged molecules in the gas phase, ranging from simple electron (impact) ionisation (El) and chemical ionisation (Cl) to a variety of desorption ionisation (DI) methods.
1.1.1 Desorption ionisation
The inherent restrictions of electron ionisation and chemical ionisation that limited applications to volatile sample molecules were overcome with the introduction of desorption ionisation methods in which molecules are brought to the surface (de sorbed) and ionised at the same time.
The development of these techniques over the past two decades has made it possible to produce intact, high molecular weight gas-phase ions of thermally labile or non-volatile compounds without derivatisation. This is generally referred to as
desorption/ionisation process. The various soft ionisation techniques use different physical approaches to produce ions:
• A high electric field is applied to the sample in field desorption (FD) mass spectrometry [1];
• The sample is bombarded with highly energetic atoms or ions in fast atom bombardment (FAB) [2], 252Cf plasma desorption (PD) [3] and secondary ion mass spectrometry [4];
• Short and intense pulses of laser light are used to induce the formation of ions in laser desorption (LD) [5] and matrix-assisted laser desorption/ionisation (MALDI) [6].
This thesis is concerned with the development of methods for the analysis and imaging of drugs in skin by MALDI-TOF-MS. Hence only the theoretical aspects of MALDI-TOF and mass spectrometric imaging are discussed in detail in this section.
Laser desorption and matrix—assisted laser desorption/ionisation mass spectrometry
The use of laser desorption (LD) for the analysis of non-volatile, organic molecules dates back to the 1960s when it was demonstrated that irradiation of low-mass organic samples with a high-intensity laser pulse produced ions that could be suc cessfully mass analysed. These experiments, however, revealed an upper mass limit of 5 — 10 kDa.
The mass limit probably arises because the energy required to cause the resonant excitation and successful energy transfer is greater than the dissociation energy of the analyte. Thus the analyte is not desorbed as the intact molecule ion in any significant amount resulting in a spectrum comprising only low-mass fragment ions.
Another major restriction of LD ionisation is the short duration of the ion burst following the laser pulse. A consequence is that the technique is unsuitable for scan ning analysis on sector or quadropole instruments, but means that LD is particularly suited to time-of-flight mass spectrometry.
In 1987, matrix-assisted laser desorption ionisation (MALDI) was introduced
co-workers—who used an inorganic matrix [7]. The use of a matrix extended the analysable mass range up to about 350 kDa at fmol sensitivities, and thereby re volutionised the field of biological mass spectrometry.
1.1.2 Principles of MALDI
In MALDI, the laser is directed at an analyte embedded in an excess of matrix ma terial. Optimal molar ratios are in the 1:1000-1:10000 (analyte:matrix) range. This results in the analyte molecules being singularised and fully surrounded (solvated) by matrix molecules. Thus laser photons have a high probability of encountering the matrix over the analyte molecules.
The laser energy is dispersed as vibrational energy within the sample. As the co-crystalline matrix/analyte structure becomes energised, the binding forces and crystal integrity are reduced. Resultant reactions in this energized state lead to ion formation (see page 12). The matrix molecules desorb (see page 16), leaving the ions. Some of the desorbed ions are still associated with the matrix molecules (Figure 1.1).
The ions are extracted from the MALDI plume by a strong electric field into the field-free drift tube of a time-of-flight (TOF) analyser. TOF analysis separates ions
according to their mass-to-charge (m /z) ratio. A more detailed review of the TOF
process is given on page 16.
Ions are converted into signals using ion-to-electron conversion detectors. These have a flat plate surface that is exposed to the incoming ions, which strike the surface (either a metal or metal oxide coating). The collision results in the emission of electrons and small negative ions, which are accelerated to another surface that produces only electrons which are amplified by conventional electron multipliers to yield a signal.
There are numerous experimental factors that affect the outcome of any MALDI experiment. The matrix, method of matrix/sample preparation, and the laser wavelength employed are generally accepted as the most influential parameters [8].
Lasers
Rapid evaporation of matrix molecules
Electron and proton transfers
Matrix crystal Incident
laser beam
Embedded sample molecule
Protonated sample/matrix molecule
Sample and matrix co crystallised on sample target
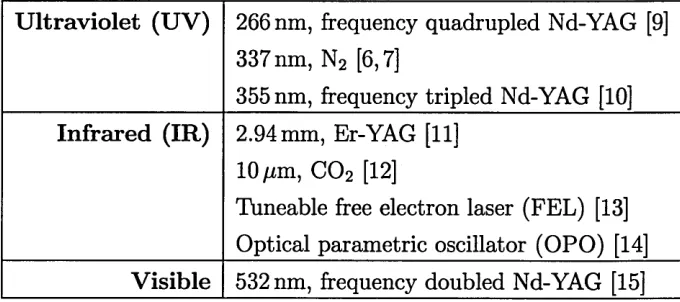
U ltraviolet (UV) 266 nm, frequency quadrupled Nd-YAG [9] 337 nm, N2 [6,7]
355 nm, frequency tripled Nd-YAG [10] Infrared (IR) 2.94 mm, Er-YAG [11]
10 fim, C 02 [12]
Tuneable free electron laser (FEL) [13] Optical parametric oscillator (OPO) [14] Visible 532 nm, frequency doubled Nd-YAG [15]
Table 1.1: Lasers employed in MALDI-MS
cost and good reliability.
The use of infrared (IR) lasers may however have some advantages over the more widely adopted ultraviolet (UV) approach. Liquid matrices in IR MALDI may yield more reproducible spectra than in UV MALDI as solid crystalline samples prepared with UV matrices demonstrate a high degree of heterogeneity Also, it has been reported that IR MALDI is a softer ionisation technique (yields less metastable fragmentation) than UV MALDI [16]. A disadvantage of IR MALDI is that much more sample is ablated in IR MALDI MS. MALDI spectra are generated from mul tiple laser shots. Typically, UV MALDI experiments average 100 laser shots and it has been observed that that ions in IR MALDI MS can only be generated from the first two or three laser shots [17]. Several papers compare the use of UV and IR MALDI MS [18-21].
The m atrix
The matrix performs two important functions: (1) it absorbs photon energy from the laser beam and transfers it into excitation energy, and (2) it serves as a solvent for the analyte, so that the intermolecular forces are reduced and aggregation of the analyte molecules is held to a minimum. Some desirable characteristics of a typical MALDI matrix are:
• high molar absorptivity at the laser wavelength employed;
[image:32.612.127.467.56.207.2]• unreactivity towards the analyte. (However, evidence suggests that proton transfer reactions of excited states of the matrix are involved in UV MALDI: see page 14);
• appropriate physical properties, such as lattice structure and heat of sublim ation;
• ability to promote ionisation;
• vacuum stability
The matrix should provide maximum ion intensity and signal reproducibility, and should minimise fragmentation and adduct formation. The matrix material must
not give rise to ions with m /z values that may coincide with those of the analyte
ions. The ideal matrix produces strong symmetrical peaks showing a minimum of
unimolecular decay (except when desired, as in post-source decay, PSD [22]).
Many different matrix materials and matrix mixtures have been used since the introduction of the MALDI technique. Unfortunately there is not enough informa
tion to date to permit an a priori prediction of suitable matrices for experiments,
largely due to the fact that the full MALDI ionisation and desorption processes are not completely understood. Thus vast numbers of potential candidates have been tested, and a general trial and error approach is still adopted in many scenarios. The majority of successful matrices are low molecular weight organic acids prepared in a suitable solvent.
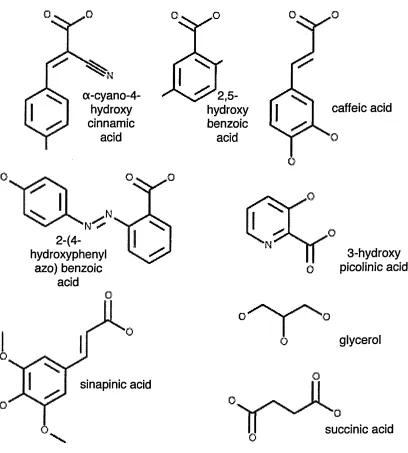
The matrices and applications discussed in this section refer to UV (nitrogen) MALDI unless otherwise specified. Structures of commonly-used matrix compounds are shown in Figure 1.2.
cx-cyano-4-hydroxy cinnamic
acid
■NV
2-(4-hydroxyphenyl
azo) benzoic acid
sinapinic acid
2,5-hydroxy benzoic
acid
caffeic acid
N 0
O
3-hydroxy picolinic acid
glycerol
0
succinic acid
[image:34.613.90.498.128.581.2]co-matrix with DHB [25]. Super-DHB (sDHB, a 9:1 mixture of DHB and 2-hydroxy- 5-methoxybenzoic acid (HMB)) [26], as well as DHB mixed with 5-methoxy-salicylic acid [27] have also shown excellent results. These may be described as binary matrix systems because both components of the mixture exhibit matrix activity.
The standard matrix for the analysis of proteins is 3,5—dimethoxy—4—hydroxy- cinnamic acid (sinapinic acid [10]), most commonly prepared in 50:50 water:acetonitrile (0.1% TFA). This matrix typically requires more laser energy (25 /zJ) than a-CHCA and DHB (around 5 — 15 /zJ).
2—(4—hydroxyphenylazo)-benzoic acid (HABA) has been used for the analysis of large proteins and glycoproteins, however, it has been shown to enhance formation of alkali metal adducts (though this is not particulary important at high mass ranges [28].
3—hydroxy-picolinic acid (3—HPA) has been used for the analysis of small pro teins, but has demonstrated spot to spot variations and excessive adduct peaks [10]. Several authors have reported the use of binary matrix systems for protein ana lysis [27,29], For example, mixtures of matrices already mentioned as well as ferulic acid (4—hydroxy—3—methoxy-cinnamic acid) [30] and caffeic acid (3,4—dihydroxy- cinnamic acid).
The analysis of oligonucleotides has proved problematic, and the most useful matrix is probably 3—HPA [31]. This may be substituted with (10%) diammonium tartrate or citrate (in order to remove alkali metal ions). 2,4,5—trihydroxyacetophenone (THAP) with diammonium citrate or tartrate [32], 6—aza—2—thiothymine [33] and quinaldic acid [34] have demonstrated good results for detection of nucleic acids. It should be noted that nucleic acid analyis is usually conducted in the negative ion mode.
Recently a new matrix, 2,5—dihydroxybenzoic acid butylamine (DHBB) has shown improved results compared with a-CHCA for the analysis of oligosacchar ides, glycoconjugates, polymers and gangliosides. However for peptide and protein analysis a-CHCA was found to be superior due to multiple alkali adducts observed with DHBB [37].
Ice [12], succinic acid [38], and glycerol [12] have all been identified as successful matrices for use with infrared MALDI.
M ethods of matrix preparation/ application
A variety of methods of matrix sample preparation have been developed. The most common method is the original dried-droplet method introduced by Hillenkamp and co-workers [24]. This method involves simple co-crystallisation of the matrix and analyte on a sample target. The surface of the droplet is the preferred site for crystallisaton: crystals form at the liquid/air interface and are carried into the rest of the solution by convection. A commonly observed problem with this technique is the aggregation of larger amounts of crystals around the edge of the dried spot. In addition, the overall sample surfaces obtained using the dried-droplet method are heterogeneous, with a crystal layer uneven both in size and number. Confocal fluorescence microscopy has been used to demonstrate that the analyte is not evenly distributed among or within the crystals, and that some matrix crystals contain no analyte at all [39]. Another limitation of the technique is segregation during crys tallisaton: as the matrix forms crystals, the salts and some analyte molecules are excluded. Whilst this limits overall ionisation of the analyte, it is of particular con sequence in situations where cationisation is preferred. The dried-droplet method often demonstrates both poor mass accuracy (particulatly on linear time-of-flight instruments) and poor spectral quality. Mass accuracy is the ability to measure or calibrate the instrument response against a known entity [40]. The measure ment indicates the deviation of the instrument response from a known monoisotopic calculated mass.
Vacuum drying [41] has been developed to overcome some of the limitations
formation of smaller crystals offers the advantage of thinner samples and improved mass resolution and accuracy with certain instruments. (Mass resolution is the dimensionless ratio of the mass of the peak divided by its width. Usually, the peak width is taken as the full width at half maximum intensity. Resolution is a measure of the separating or resolving power of a mass spectromter, i.e. the ability to distinguish between two masses [40]).
A more uniform inclusion of the analyte into matrix crystals may be achieved by
using the crushed-crystal technique [42]. Matrix-only solution is deposited onto the
target and the resultant crystals are then crushed and spread by overlaying, pressing and twisting a glass slide upon them. Loose material is subsequently brushed away prior to the depostion of a mixture of analyte and matrix (prepared as in the dried- droplet method) onto the crushed crystals. In this method, crystallisation of the analyte and matrix onto the sample plate is facilitated by the nucleation sites of the crushed initial matrix layer. Crystal nucleation shifts from the liquid air interface to the surface of the substrate and microcrystals form within the solution. This results in a polycrystalline film of the matrix and analyte that is more uniform than in the dried-droplet method in terms of spot-to-spot reproducibility and ion production. This method has been claimed to be particularly useful in oligonuleotide and protein analysis [43].
An alternative method, fast-matrix-evaporation, was developed by Vorm et al.
[44-46] with a view to improving mass accuracy and resolution. This involves applic ation of the matrix layer in a highly volatile solvent (acetone) to create a thin film of matrix. The analyte is subsequently deposited onto the preformed matrix crystal layer. Confocal fluorescence microscopy [39] has been used to demonstrate that the crystals produced are more homogenous than those produced by the dried-droplet method.
The principles of the crushed-crystal and fast-evaporation methods were com
bined to develop the overlayer (also termed seed-layer and two-layer) method
The sandwich method was derived from the fast-evaporation and overlayer meth ods. A droplet of analyte solution is applied to a thin thin film of matrix created by fast evaporation, followed by the depostion of a second layer of matrix so that the analyte is effectively sandwiched between two layers of matrix. This method was
introduced by Li et al. for the analysis of single mammalian cell lysates [49], but
has not been widely adopted by the mass spectrometric community.
Spin coating has proved useful for the analysis large biomolecules [50]. A relat
ively large volume (up to 10 ml) of matrix/analyte solution is deposited onto a plate, which is then spun at around 300 rpm to create a more homogeneous film than in the conventional dried-droplet method.
In cases where the analyte is insoluble, the pellet method may be useful [51]. A mixture of finely ground analyte and matrix is pressed together in a hydraulic press to give a combined pellet.
The use of matrix pre-coated targets and membranes has proved particularly useful when there is only a small amount of analyte available. A range of substrates including PVDF, nitrocellulose, cellulose, and nylon have all been tested. The use of such materials as a method of matrix support and also as tissue blotting substrates is reviewed more fully in Chapter 2.
Several research groups have investigated the use of liquid matrices as an al
ternative approach to the desorption of solid matrix-analye deposits. The major advantage of these methods is that the analyte is likely to be more evenly distrib uted throughout the matrix, as a function of simple molecular diffusion. Liquid matrices can be divided into three categories:
1. Chemical liquid matrices [52,53]: the liquid matrix absorbs the laser energy
(similarly to a solid matrix).
2. Suspension or particle-doped liquid matrices [7,54-56]: fine graphite or metal
particles are suspended in a liquid that does not absorb the laser energy (for example glycerol). The fine particles absorb the energy and facilitate desorp tion while the liquid molecules provide the charge for ionisation.
3. Chemical-doped liquid matrices [57]: an organic material that is highly absorb
Alternative methods such as electrospray and airspray matrix depostion have been developed and show particular promise in investigations where the method of matrix application must offer a degree of matrix crystal homogeneity across the sample that would allow the full surface area to be scanned, and have spot-to-spot reproducibility.
Electrospray as a method of MALDI sample preparation was introduced by Owen [58,59] and independently by Axelsson [60]. In this technique a small amount of matrix-analyte mixture, or matrix alone, is elecrosprayed from a high voltage- biased (3-5 kV) stainless steel (or glass) capillary onto a grounded metal plate, moun ted 0.5-3 cm away from the tip of the capillary. This method has superior crystal homogeneity, producing an even matrix layer across the sample surface. Quantitat ive analysis has been reported by Owen [58] with use of an internal standard.
The airspray method [61] uses a compressed airbrush device to spray matrix or a matrix/analyte mixture onto the sample plate. This is a very simple, inexpensive alernative to the electrospray method and has shown excellent reproducibility [61,62]
1.1.3 MALDI ion formation
Despite the widespread use and application of MALDI over the last twenty years, the process of ion formation remains poorly understood. MALDI has proved to be an extremely difficult process to characterise, and it is clear that even in a single exper iment no one mechanism can explain all ions observed. It has also been calculated that while one laser pulse results in several thousands of ions, the overall iomneutral ratio in UV MALDI is only about 1 : 104. Thus we are trying to understand a mechanism that results in minority species. Several theories and mechanisms have been proposed, and are reviewed in an excellent article by Zenobi and Knochen- muss [8]. It is widely accepted that a variety of different pathways contribute to the ions observed in a MALDI spectrum, as summarised in Table 1.2.
MALDI ionisation mechanisms can be divided into primary and secondary ion
isation steps [8]. Primary ion formation accounts for pathways in which neutral
reactants are converted into charged products (gas phase ions) by action of the laser pulse on the sample. These conversions occur in the MALDI plume and usually
result in the formation of matrix ions. Secondary steps are any subsequent ion-
P rim ary ion form ation Desorption of preformed ions Multi-photon ionisation Energy pooling
Excited-state proton transfer Disproportionation reactions Thermal ionisation
Secondary ion form ation Proton transfer Electron transfer Cationisation
Table 1.2: Possible pathways for MALDI ion formation (as reviewed by Zenobi and Knochenmuss [8])
observed at the detector. It is possible that primary ionisation may be partially or completely masked by secondary reactions [63]. While this complicates elucid ation of the primary ionisation steps, it explains the similarity of MALDI spectra recorded under different conditions, and may be useful in predicting MALDI mass spectra [64].
P rim ary ion form ation
An attractive mechanism is that ions observed in the spectrum may already be
present in the solid sample and are liberated with the laser pulse (desorption of
pre-formed ions) [65].
The formation of the cation radical of the matrix by multi-photon ionisation was
considered by many as a likely model of primary ion formation [66]:
M Af+* + e~
However, in theory the laser irradiances used in UV MALDI are too low to allow significant absorption of more than two photons by a matrix molecule. Since the ionisation energy of most matrices is estimated to be greater than the energy of two photons of a nitrogen laser, the two photon ionisation model cannot be assumed [67].
the MALDI plume may make up the difference between a two-photon excitation
and the ionisation potential, thus a photothermal model has been proposed [68].
Furthermore, energy pooling is considered as a likely mechanism [69]. In this model two or more matrix molecules pool their internal energy together while in an excited
state (M*M*) to yield one matrix radical cation:
2M ^ M 'M * — > M + M** — *M + M+- + e~
Following photoionisation, excited state proton transfer (ESPT) is the most fre
quently proposed MALDI ionisation model, dating back to the origin of MALDI [9]. The acidic properties of many aromatic derivatives are enhanced when molecules are laser excited; thus a single excited matrix molecule (M*) may transfer the labile proton to an analyte or matrix molecule in the ground state:
—> +A— * [M + H]- + [A + H]+
or
M —>+M — ►[M + H)~ + [M + H]+
This is an attractive pathway as it only requires one photon, and also because it rationalises the formation of pseudomolecular ions. However, none of the popular matrices is known to be particularly ESPT-active in solution or gas phase, and also known ESPT compounds have been demonstrated to be poor MALDI matrices [70].
Disproportionation reactions have been proposed to explain the simultaneous
formation of positive and negative ions [71,72]. Proton transfer of two coupled and excited matrix molecules is thought to give rise to positive and negative species as follows:
2M M + M** — ►[M - H]~ + [M + H]+
This reaction has been shown to be energetically possible with two nitrogen laser photons [71]. Despite this, there is still little evidence to support this mechanism [8].
Thermal ionisation has been demonstrated as a possible pathway of ion forma
Secondary ion formation
In cases where primary ions are radical cations, gas phase proton transfer reactions
have been shown to occur with both neutral matrix and neutral analyte molecules
[73].
Electron transfer has been shown to be a plausible pathway for MALDI analysis
of compounds with low ionisation potential (IP) [74]. In this situation a matrix radical cation and an analyte molecule may react to produce an analyte radical cation:
M +' + A — >M + A+
Several studies of cationised molecules generated under MALDI conditions have shown that these ions often result from ion-molecule reactions in the gas phase. Thus
the process of cationisation has been widely accepted as a pathway of secondary ion
formation.
The fact that MALDI is generally characterised by the presence of only singly-
charged molecules led to the development of the lucky survivor model [75]. This
uniform model of the MALDI ionisation process proposes that multiply-charged clusters are desorbed, but are subsequently neutralised or have their charge reduced by proton transfers or electron captures with reactive matrix species. By this ra tionale, the only ions that will survive the process and reach the detector are those that are singularly charged.
Although all of these mechanisms are clearly important in MALDI, no definitive explanation of the process has been offered. A better understanding of MALDI ion isation could result in improved ion yields, control of fragmentation and ion charge states, permit access to new compounds by MALDI, provide a solid rationale for marix selection, and may also hi-light reasons for discrimination effects in quantit ative UV MALDI [8].
1.1.4 Desorption mechansisms
The thermal spike model [76] proposes that the matrix molecules sublime from the surface as a result of local heating at low laser fluence, but above a certain laser intensity, a rapid increase in the desorption efficiency occurs. The ejection of intact molecules is attributed to poor vibrational couplng between the matrix and analyte which leads to a bottleneck in the energy transfer from the matrix to the vibrational mode of the analyte molecule.
The pressure-pulse theory [77] proposes that a pressure gradient is created nor
mal to the surface, and that desorption of large molecules might be enhanced by momentum transfer from collisions with fast moving matrix molecules.
A more recent theory suggested by Hillenkamp et al. [78,79], the quasi-thermal
model is the most widely accepted scenario of desorption in MALDI. The primary
step involves a pressure driven decomposition of the co-crystallised analyte/matrix material into smaller particles consisting of both clusters and single molecules. These are subsequently thermally desorbed in a second step to create the MALDI plume. High density and collision rates within the plume create an explosive phase trans ition that results in molecular gas phase species of both the matrix and analyte by expansion cooling.
1.1.5 Time-of-flight mass spectrom etry
Time-of-flight (TOF) mass spectrometry was first successfully used as an ion ana lyser in the 1950’s [80]. The principle of mass analysis in a time-of-flight analyser is
based on the principle that ions of different m /z values have the same energy, but
different velocities, after acceleration out of the ion source. Thus, the time required for each to traverse the flight tube is different: high mass ions take longer to reach the detector than low mass ions.
The kinetic energy given to an ion by the electric field is the product of the charge of the ion and the electrical field strength [81]. This is shown in Equation 1.
Equation 1: zeV = \m v2
Where z = number of charges e = charge of an electron m = mass of ion
v = velocity of ion
If the length of the source region is s, then the drift time, £1, through the source
region is determined by Equation 2:
Equation 2: f _ 2s _ (2m )1/ 2s
1 V (Zevy/2
If the length of the drift tube is 1, then the time-of-flight, t2, of an ion through
the drift tube is determined by Equation 3:
Equation 3: (:2 Z e V)1/ 2
The time-of-flight for an ion can be determined by combining Equations 2 and 3:
,
1 /2Equation 4: t = (:2 Z e V y/ 2
A schematic overview of MALDI-TOF-MS is illustrated in Figure 1.3.
Laser beam
zeV = 1/2 mv
h —
Sample desorbed as ions and neutrals
Detector
o a
Acceleration region
t, = 2s = (2m) s V (ZeV)m
Figure 1.3: MALDI-TOF-MS (linear time-of-flight)
Thus the time taken for an ion to reach the detector is proportional to the square
root of its m/z value. The larger the mass of a singly charged ion, the longer it takes
The pulsed laser used for MALDI makes it an ideal technique for coupling with TOF mass spectrometry since there is a previously defined time of ion generation. Mass to charge ratios are determined by measuring the time that ions take to move through the drift tube between the source and the detector.
Today’s linear TOF MS instruments are capable of attaining a resolution of 1 part per 1000. A major limitation in achieving high resolution is the consequence of the spread in time, space and kinetic energy of the initial ion packet. The time difference in formation of two ions of the same mass caused, for instance, by the length of a laser pulse, will remain the same during the flight to the detector. Ions that are not formed at the same location, due to the spread of the sample on the target or width of the ion beam, will be accelerated to different kinetic energies. Also, ions can be generated with different initial kinetic energy.
Reflectron TOF
This spread in kinetic energy can be partially compensated by using a device called a reflectron (Figure 1.4). Ions of higher energy will penetrate deeper into an elec trostatic repeller field (ion mirror) and will be turned around and arrive at the detector at the same time as ions of lower initial energy that penetrate the field less. In a linear TOF, neutral and charged fragments generated through fragmentation of ions in the drift region cannot be distinguished from the original ion, because their velocity remains the same. Metastable ions generated prior to reflection have the same velocity as their precursor ion, but a reduced energy and hence can be distinguished when spectra acquired in linear and reflectron mode are compared, due to their time difference. Reflectron TOF instruments are capable of a resolving power of over 1:10,000.
Delayed extraction
Laser
Reflectron (ion mirror) ions
Detector
MALDI Target
Figure 1.4: Reflectron TOF mass spectrometer.
energies, so that ions with identical m/z values will arrive at the same time at the detector.
Time-of-flight analysers have some special advantages. In contrast to sector instruments and quadropoles, all ions accelerated out of the ion source of the TOF instrument will reach the detector, giving it a relatively high sensitivity. Of course, the ions must be pulsed into the analyser, and so, some dead time exists when ions are not being analysed. Also, the mass range of TOF analysers is virtually unlimited and any practical upper limit is dictated by the ionisation process and by detector efficiency. The combinations of time-of-flight mass spectrometry with MALD, PD and ES have all been used extensively in biochemical research.
Latest instrum ent developments
novel instruments include a MALDI ion source coupled to a hybrid quadrupole-TOF (QTOF) [84]; tandem MALDI TOF-TOF [85]; and Fourier-transform ion cyclotron resonance (FT-ICR) MS [86,87].
The QTOF has already found widespread use in biomolecular analysis. Such
instruments employ orthogonal ion acceleration (reviewed by Guilaus et al [88])
which has a number of advantages over the more common axial-injection geometry. The hybrid mass analyser configuration permits compound identification either by analysis of the intact molecule or by spectral analysis of product ions produced by collisionally-induced dissociation of individual precursor ions in a collision cell. Both kinds of spectra can be acquired from a single sample in the same experiment. The use of collision-induced dissociation to yield sequence information circumvents the low product ion yields and problematic interpretation of product ion spectra acquired by the postsource decay technique. Collisional damping is used to cool the ions produced by MALDI before they enter the quadrupole. The time-of-flight measurement is thus decoupled from the MALDI process and provides high mass accuracy for both precursor and product ions, high resolution, simple selection of precursor ions and precise tuning of collision energies. MALDI-QTOF-MS with
orthogonal ion injection has been evaluated for in situ analysis and imaging on skin
in Chapters 3-6.
Finally, a range of separation techniques have been successfully interfaced with MALDI to improve the sensitivity further, e.g., scanning IEF gel separation coupled to MALDI-TOF mass spectrometry [89]; replacement of IEF with reversed phase
(RP)-HPLC [90]; and nonporous RP-HPLC [91].
This ever-expanding range of new mass analysis and sample interface configur ations is opening access to a range of new compounds for MALDI analysis, and is increasing the spectral quality of existing procedures.
1.2 Imaging mass spectrometry
The use of mass spectrometry (MS) to obtain spatially resolved information com
menced 30 years ago with the advent of secondary ion mass spectrometry (SIMS).
species from the surface. The ejected species may include atoms, clusters of atoms and molecular fragments. In traditional SIMS, it is only the positive ions that are analysed. Since the technique uses a beam of atomic ions (i.e., charged particles) as the probe, it is a relatively easy matter to focus the incident beam and then to scan it across the surface. Thus the detector response for a selected mass at each raster spot becomes a pixel in the image. SIMS is particularly appropriate for the determination of the inorganic fraction and the elemental composition of the sample surface, whereas non-specific ions are usually generated from the organic fraction.
Secondary ion mass spectrometric imaging has been widely used and developed by both the chemical and biomedical communities. The technique has been applied to the analysis of biological samples in a range of applications, e.g., to monitor phar maceuticals at the cellular and subcellular level; to study ion transport in organisms by isotopic labelling; to map the distribution of ions in hard tissue such as bone and teeth and to study chromosomes [92]. In addition, there have been recent efforts to apply SIMS to organic compounds and metabolites of low mass (500 amu) in single cells [93].
For the study of organic solid compounds, laser desorption mass spectrometry
(LDMS) is a promising technique. The use of lasers in imaging MS has several advantages over the use of ion-beams alone, for example high sensitivity, select ive ionisation, and quantification. This technique is similar to SIMS and permits investigation of solid samples directly—without the need for extensive sample pre paration/separation prior to analysis. UV laser spot sizes can be focused to under
5 pm and thus the technique is ideally suited to spatially-resolved analyses. The use
of laser desorption mass spectrome