DEVELOPMENT AND VALIDATION OF A REFRACTOMETRIC
ASSAY METHOD
K. C. Ajithkumar and K. Pramod*
College of Pharmaceutical Sciences, Govt. Medical College, Kozhikode – 673008, Kerala,
India.
ABSTRACT
Refractometry is used to detect the refractive index of chemical
substances, when light passes through it. Since every chemical
substance or sample has specific refractive index at specific
concentration, here we used it as an assay method and validated the
method in terms of linearity and range, accuracy and precision. The
detection of limit and the quantitation of limit were determined as per
ICH guidelines. The method is expected to be extended in
quantification of variety of samples.
KEYWORDS: ICH, linearity, refractive index, range, precision,
detection limit, quantitation limit
INTRODUCTION
Refractometric analysis is the technique used to determine the refractive index of gas, liquid,
or solid with response to the chemical composition of the substances and purity. It is an
important tool in the field of agriculture, food industry and chemical industry. It can be used
to determine the purity of drugs[1], used for estimation of biological samples[2],
characterization of chemical such as optical active samples and viscous liquids. In agriculture
it will used for the estimation of sugar in fruit juices and wines.[3] Refractive index will be
depended by temperature and the wavelength of the light used. So the temperature should be
maintained constant to avoid the chances of error in an experiment. Here we develop and
validated an assay method using dextrose as test sample.
MATERIALS AND METHODS
Materials: Anhydrous dextrose was purchased from Medilise Chemicals, Kannur, India.
Reagent grade I water (Millipore, Molsheim, France) was used for the study.
Volume 6, Issue 13, 567-571. Research Article ISSN 2277– 7105
*Corresponding Author
Dr. K. Pramod
College of Pharmaceutical
Sciences, Govt. Medical
College, Kozhikode –
673008, Kerala, India.
Article Received on 26 August 2017,
Revised on 17 Sept. 2017, Accepted on 08 Oct. 2017
Refractometry: We employed (Abbemat 350, Anton Paar India Pvt. Ltd., Haryana, India)
refractometer in the study.
Preparation of standard solutions: Anhydrous dextrose (25 g) was dissolved in water in a
100 mL volumetric flask and then the volume was made up with water. The dilutions of this
stock solution were made by diluting the required aliquot with water to obtain standard
solution in the range of 2- 25%w/v. The refractive index of the resultant solutions was
determined at a wavelength of 589 nm and 20°C.
Linearity and range
The calibration curve was plotted using the concentration range of 2- 25 %w/v. The refractive
index of the solutions was determined at a wavelength of 589 nm and 20°C. A calibration
curve was constructed by plotting refractive index versus concentration of standard solution
and the regression equation was determined. The experiment was carried out in triplicate.
Precision
Three concentrations of dextrose solution (2, 8 and 20%w/v) were prepared. The precision of
the method was assessed by analyzing dextrose for repeatability and intermediate precision.
(a) Repeatability
Repeatability (intraday) was assessed by analyzing dextrose in three different concentrations
(2, 8 and 20%w/v) of three times a day. The % relative standard deviation (RSD) was
calculated for refractive index thus obtained, to obtain the intra-day variation.
(b) Intermediate precision
Intermediate precision (inter-day) was established by analyzing three different concentrations
(2, 8 and 20%w/v) of dextrose for three different days. The % relative standard deviation
(RSD) was calculated for refractive index thus obtained, to obtain the inter-day variation.
Detection and quantitation limits
The limit of quantification and limit of detection were determined according to equations (1)
and (2).
QL = 10 σ / S --- (1)
DL = 3.3 σ / S --- (2)
where, σ is the standard deviation of the intercept of the calibration plot and S is the slope of
RESULTS AND DISCUSSION
The developed refractometry method for the estimation of dextrose in water was developed
and validated.
Linearity and range
The refractive index of the prepared standard solutions (2- 25 %w/v) was determined. The
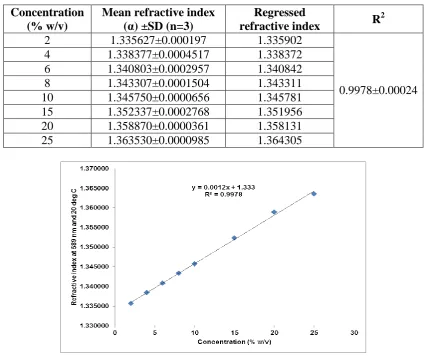
mean refractive index was found to be 1.335627 – 1.36353. The plot of refractive index
versus concentration was linear in above concentration range 2- 25 %w/v with excellent
coefficient of determination of 0.9978±0.00024. The calibration curve data for dextrose in
[image:3.595.84.511.302.661.2]water is displayed in Table 1 and the calibration plot is displayed in Fig. 1.
Table. 1: Calibration curve data for dextrose in water.
Concentration (% w/v)
Mean refractive index (α) ±SD (n=3)
Regressed
refractive index R
2
2 1.335627±0.000197 1.335902
0.9978±0.00024
4 1.338377±0.0004517 1.338372
6 1.340803±0.0002957 1.340842
8 1.343307±0.0001504 1.343311
10 1.345750±0.0000656 1.345781
15 1.352337±0.0002768 1.351956
20 1.358870±0.0000361 1.358131
25 1.363530±0.0000985 1.364305
Fig. 1. Calibration plot for dextrose in water.
Precision
The precision of the method was assessed by analyzing three different concentrations (2, 8
(a) Repeatability: Repeatability (intra-day) was assessed by analyzing three different
concentrations (2, 8 and 20%w/v) of dextrose three times a day. The % RSD was calculated
for refractive index thus obtained, to obtain the intraday variation and is given in Table 2.
(b) Intermediate precision: Intermediate precision (inter-day) was established by analyzing
three different concentrations (2, 8 and 20%w/v) of dextrose for three different days. The %
RSD was calculated, to obtain the inter-day variation and is given in Table 2.
The low values of % RSD for repeatability and intermediate precision suggested an excellent
[image:4.595.137.459.543.681.2]precision of the developed refractometric method.
Table. 2: Repeatability and intermediate precision.
Concentration (% w/v)
Repeatability (n=3) Intermediate precision (n=3)
Mean refractive index±SD(n=3)
% RSD
Mean refractive index±SD(n=3)
% RSD
2 1.33493±0.00051 0.0386 1.33520±0.00067 0.0500
8 1.34204±0.00108 0.0807 1.34332±0.00026 0.0191
20 1.35918±0.00042 0.0308 1.35899±0.00029 0.0211
Detection and quantitation limits
The detection limit (DL) and quantitation limit (QL) were determined as per the ICH
guidelines and were found to be 0.6354 and 1.9255 %w/v respectively.
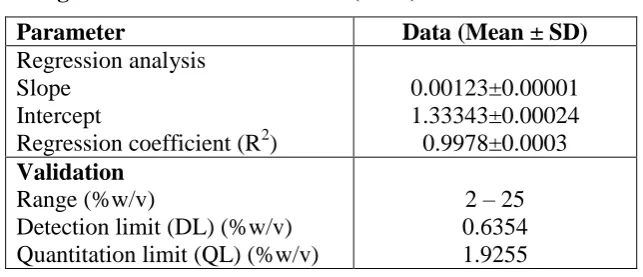
Table 3 summarizes the linear regression and validation data of refractometric method for the
quantification of dextrose in water.
Table 3: Linear regression and validation data (n = 3).
Parameter Data (Mean ± SD)
Regression analysis Slope
Intercept
Regression coefficient (R2)
0.00123±0.00001 1.33343±0.00024 0.9978±0.0003
Validation
Range (%w/v)
Detection limit (DL) (%w/v) Quantitation limit (QL) (%w/v)
2 – 25 0.6354 1.9255
CONCLUSIONS
A refractometric method for the quantification of dextrose was successfully developed and
validated. The method was validated in terms of linearity and range and precision. The
and were found to be 0.6354 and 1.9255 %w/v respectively. The method is expected to be
useful in a variety of industries where dextrose finds its application. The same approach can
be extended for determination of purity of other liquid samples.
ACKNOWLEDGEMENT
K. C. Ajithkumar gratefully acknowledges Kerala State Council for Science, Technology and
Environment (KSCSTE), Thiruvananthapuram, India, for sanctioning student project (No.
14/SPS 57/2016/KSCSTE, Dated 02.04.2016).
REFERENCES
1. Green MD, Nettey H, Villalva RO, Pamanivong C, Khounsaknalath L, Grande OM,
Newton PN, Fernández FM, Vongsack L, Manolin O.Use of refractometry and
colorimetry as field methods to rapidly assess antimalarial drug quality.J Pharm Biomed
Anal, 2007; 43(1): 105-110.
2. Riche M. Analysis of refractometry for determining total plasma protein in hybrid striped
bass (Moronechrysops×M. saxatilis) at various salinities.Aquaculture, 2007; 264:
279–284.
3. Barbosa EA, Silva DM, Preto AO, Verzin R. Design, construction, and performance of a
real-time holographic refractometry prototype for liquid analysis. Review of scientific
instruments, 2011; 82: 013103.
4. ICH-Guidelines Q2 (R1). Validation of Analytical Procedures: Text and Methodology.