10. S
ITE
1217
1Shipboard Scientific Party
2BACKGROUND AND OBJECTIVES
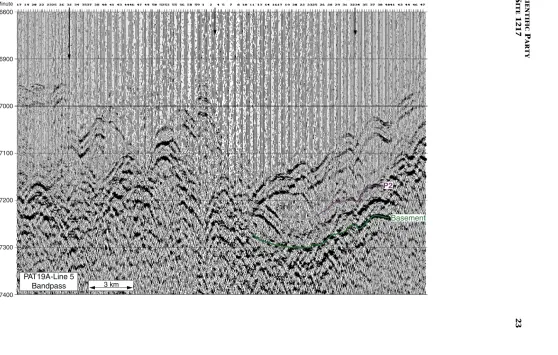
Site 1217 (16°52.02′N, 138°06.00′W; 5342 meters below sea level [mbsl]; Fig. F1) is one of seven sites drilled to target upper Paleocene crust along a latitudinal transect during Leg 199 and will be used to in-vestigate paleoceanographic processes in the northern tropical early Eocene Pacific Ocean. Site 1217 is situated ~1° north of the Clarion Fracture Zone on abyssal hill topography typical of the central Pacific. Based on magnetic lineations, basement age at Site 1217 should be in magnetic Anomaly C25r or ~57 Ma (Cande et al., 1989; timescale of Cande and Kent, 1995). The Cenozoic history of sedimentation in this region was poorly constrained prior to Leg 199 drilling because the nearest drill site (Deep Sea Drilling Project [DSDP] Site 162) is situated ~300 km south and west on 48-Ma crust. Based on data from this early rotary-cored hole, magnetic anomaly maps, a shallow-penetration pis-ton core near Site 1217 (EW9709-4PC), and seismic profiling (Fig. F2), we expected the sedimentary sequence at Site 1217 to comprise a rela-tively thick (25 to 35 m thick) section of red clays overlying a radiolar-ian ooze and a basal carbonate section with possible chert near base-ment (estimated total depth ~125–150 meters below seafloor [mbsf]) deposited when the site was near the ridge crest in the late Paleocene and early Eocene.
Site 1217 was chosen because it is anticipated to have been located just outside of the equatorial region at 56 Ma, ~5°N, 106°W based upon a fixed hotspot model (Gripp and Gordon, 1990, for 0- to 5-Ma Pacific hotspot rotation pole; Engebretson et al., 1985, for older poles). On the same basis at 40 Ma, the site was located at ~8°N, 111°W. Thus, Site 1217 should help define the paleoceanography of the northern tropical Pacific, in particular locating the ancient North Equatorial Countercur-rent (NECC) region. General circulation-model experiments for the
160°W 150° 140° 130°
0° 10° 20° 30° N
0 500 1000
Site 1215 Site 1216 Site 1217 Site 1218 Site 1219 Site 1220 Site 1221 Site 1222 Site 40 Site 42 Site 43
Site 69 Site 70 Site 71 Site 72 Site 160 Site 161 Site 162 Site 163 Site 573 Site 574 Site 575 Honolulu
Molokai F.Z.
Clipperton F .Z. Clarion F.Z.
Site 1216 Site 1217 Site 1218 Site 1222 Site 1221 Site 1220 Site 1215 Molokai Fractu re Zone
Clarion Fracture Zone Mahi M
ahi Fracture Zone
Site 1219 Clipp erton Fractu re Zone 574 573 575 161 162 163 40 42 43 70 71 72 0° 10° 20° 5° 15° 25° N 150°W 145° 140° 135°
km
Leg 199 sites DSDP sites
F1. Site location map, p. 22.
X Line 4 X Line 3
PAT19A-Line 5 Bandpass S N T w o-w ay tr a veltime (ms) Site 1217
X Line 2 EW9709-4PC Hour Minute 6600 6900 7000 7100 7200 7300 7400 3 km Basement P2
F2. Seismic reflection profile,
p. 23.
1Examples of how to reference the
whole or part of this volume.
2Shipboard Scientific Party
addresses.
early Eocene (see Huber, this volume) suggest that the NECC was a well-developed current during this time period.
Other paleoceanographic and paleoclimatic objectives of drilling the sedimentary sequence anticipated at Site 1217 are as follows: (1) to help define the shift in the Intertropical Convergence Zone through the Pa-leogene by following the change in eolian dust composition and flux through time (red clays); (2) to help constrain the middle–late Eocene calcite compensation depth (CCD); and (3) to sample the Paleocene/ Eocene (P/E) boundary, one of the most climatologically critical inter-vals of Cenozoic time. Recovery of deep-sea sediments from this time interval during Leg 199 is a high priority because the P/E boundary has never before been sampled in the central tropical Pacific Ocean.
Results from Site 1217 will also provide important information to test whether there was significant motion of the Hawaiian hotspot, with respect to the Earth’s spin axis during the early Cenozoic. At 56 Ma, the backtracked location based upon a hotspot reference frame is ~5°N, 106°W, and at 40 Ma is ~8°N, 106°W. If significant hotspot mo-tion or true polar wander occurred since 57 Ma (Petronotis et al., 1994), this drill site could have been much nearer to the equator.
SUMMARY
Site 1217 (16°52.01′N, 138°06.00′W) is situated ~1° north of the Clar-ion Fracture Zone on abyssal hill topography at a water depth of 5342 m. The site was chosen for drilling because it is thought to have been located just outside of the equatorial region at 56 Ma (~5°N, 106°W based upon a fixed hotspot model; Gripp and Gordon, 1990, for the 0-to 5-Ma Pacific hotspot rotation pole and Engebretson et al., 1985, for older poles). At 40 Ma, the site was located at ~8°N, 111°W. Thus, Site 1217 should help define the paleoceanography of the northern tropical Pacific and, in particular, help to locate the ancient NECC region. Based on site survey seismic data and piston coring together with results from the nearest drill site (DSDP Site 162; situated on 48-Ma crust ~300 km south and west), we expected the sedimentary sequence at Site 1217 to comprise a relatively thick (25–35 m thick) section of red clays overly-ing a radiolarian ooze. We also expected a basal carbonate section with possible chert near basement (estimated total depth of ~125–150 mbsf) deposited when the site was near the ridge crest in the late Paleocene and early Eocene.
The sedimentary section overlying basalt at Site 1217 is ~138 m thick and records a lower Eocene nannofossil chalk overlain by a poorly recovered lower–middle Eocene chert-clay sequence. Middle Eocene– Holocene deposition is represented by radiolarian ooze followed by red clays at the surface. The recovered sediments from all three holes at Site 1217 were affected by coring disturbance, downhole debris, and flow-in associated with chert fragments blocking the core liner. One strati-graphic interval in the advanced piston corer (APC) cored section was highly disturbed or not recovered in all three holes (~37–49 mbsf), pre-venting the recovery of a complete continuous sedimentary section. Nevertheless, it was possible to generate a spliced, but discontinuous, record in the upper 90 m of the section.
north-ward of the Pacific plate. The red-clay unit also contains a thin (~2.5 m thick; ~30 mbsf) subunit of nannofossil ooze interbedded with nanno-fossil clay. Below the red clays are a radiolarian ooze with clay grading to clayey radiolarian ooze (Unit II; ~39–90 mbsf). The radiolarian ooze is of middle Eocene age (~38–43 Ma) and contains rich and well-preserved middle Eocene radiolarian fauna. Below 90 mbsf, we encoun-tered a unit of chert and interbedded clay (90–128 mbsf) before recover-ing a thin (~1.13 m thick) section of early Eocene chalk (Unit III; 128– 129 mbsf). The chalk is partially to extensively dolomitized (washed core catcher samples yield abundant nearly perfect euhedral rhombs ~100 mm in size) but contains nannofossils and planktonic and benthic foraminifers. Basement basalt was encountered at 138 mbsf.
Wet bulk density values at Site 1217 are high between the seafloor and 22 mbsf (mean values = 1.37 g/cm3) and decrease sharply to a
min-imum of 1.18 g/cm3 at 25.58 mbsf, a value that is very similar to the
density of the radiolarian oozes at the site. In contrast, the wet bulk densities of the Oligocene nannofossil ooze subunit and lower Paleo-cene nannofossil chalk are distinctly higher (~1.28 and 1.79 g/cm3,
re-spectively).
The magnetic intensity of the sediments is relatively strong, and drilling-induced magnetization was mostly removed with mild alternating-field (AF) demagnetization. Site 1217 sediments provided a good record of geomagnetic reversals that could be interpreted as chrons. Characteristic remanent magnetization (ChRM) inclinations are usually shallow, as expected in these latitudes. A record from Chrons C20–C12 was established from the middle Eocene to the early Oligocene, but the reversal stratigraphy in the upper 15 m (late Oligocene–Holocene) could not be established because of the low sedi-mentation rate of the upper sediments and the lack of either core orien-tation or an independent age model.
High levels of sulfate and concomitant low levels of ammonium in interstitial pore waters at Site 1217 indicate a relatively oxic system, consistent with very low levels of labile organic matter, occurrences of metalliferous oxides, and the strong and stable magnetic signature within the host sediments. Relatively high pore water silica concentra-tions are consistent with dissolution of biogenic silica within the sedi-ments. The solid-phase chemical content reflects the microfossil con-tent and the low level of reductive diagenesis. The whole section at Site 1217 shows relatively high levels of Mn and Fe in the solid phase. Within the upper red clays, solid phase Si levels generally increase southward in the Site 1215, 1216, and 1217 transect, presumably indi-cating higher export of biogenic debris to the ocean floor closer to the paleoequator.
The average linear sedimentation rates (LSRs) in the red clays (shal-lower than 23 mbsf) are very low (~0.8 m/m.y.). Sedimentation rates in the underlying fossiliferous and cherty lower sections are substantially higher but are, nevertheless, modest (~5 m/m.y.).
Highlights
Lower Oligocene Nannofossil Ooze
interpreta-tion is consistent with the underlying spacing and length of several normal and reversed intervals and places the thin subunit of nannofos-sil-rich carbonate ooze (all from nannofossil Zone NP22) in the lower-most Oligocene. This brief interval of carbonate sediment preservation may represent the dramatic deepening of the CCD recorded elsewhere in the deep-sea tropical Pacific Ocean (e.g., DSDP Sites 42, 70, 161, and 162) associated with the Eocene–Oligocene transition, but this possibil-ity can only be validated by shore-based studies.
Middle Eocene Radiolarian Ooze
At Site 1217, we collected the first near-continuously drilled se-quence of Eocene radiolarian oozes by deep-sea drilling. In the presence of a well-defined magnetostratigraphy, this section will help to define and calibrate radiolarian stratigraphic zonation. Radiolarian oozes have no modern analog but are prominent sedimentary features of the middle Eocene low-latitude Pacific Ocean having been recovered from piston cores and drill sites up to 4° to the north (e.g., DSDP Sites 40 and 41) and 10° to the south (e.g., DSDP Sites 70 and 162). In contrast, middle Eocene radiolarian oozes are absent at Site 1216. Thus, Sites 1216 and 1217, along with DSDP Sites 40 and 41, appear to define the northern extent of this type of biogenic sedimentation.
Lower–Middle Eocene Chert and Dolomitized Nannofossil
Chalk
By coring to basement at Site 1217, we recovered sediments needed to address a number of Leg 199 objectives, including an improvement in our understanding of the following: (1) the location of the P/E paleo-equator, (2) the biotic composition and accumulation rate of sediments within the tropical Eocene Pacific Ocean, and (3) the behavior of the silica budget and CCD during the early Eocene. Broadly speaking, the sequence drilled at Site 1217 conforms to the classical sedimentary suc-cession predicted for a deep-sea drill site situated on relatively old oce-anic crust in the Central Pacific (red clays overlying siliceous and, in turn, carbonate biogenic sediments). However, the lowermost sedi-ments drilled (lower–middle Eocene chert and chalk) surprised us in two ways. First, these sediments show that average LSRs are relatively slow (<5 m/m.y.), which is consistent with results from Site 1216. Sec-ond, the basal lower Eocene chalks that overlie basement are, like their Site 1215 counterparts, dolomitized; an intriguing discovery given their proximity to what is generally considered to be a kinetically more fa-vorable geochemical sink for Mg (alteration minerals in the upper oce-anic crust).
OPERATIONS
Transit to Site 1217 (PAT-19A)
the Global Positioning System coordinates of the new location by 1815 hr. The hydrophones were lowered, and assembly of the bottom-hole assembly began. A beacon was deployed at 1848 hr. The corrected preci-sion depth recorder (PDR) depth was 5340.9 meters below rig floor (mbrf).
Hole 1217A
After the drill string was deployed to a depth of 5330 mbrf, an APC-mudline core was attempted from 5335.9 mbrf and resulted in a water core. The driller then lowered the bit until the heave compensator ap-peared to activate, suggesting contact with a firm sea bottom at a bit depth of ~5353 mbrf. The second attempt at a mudline core was made with the bit at 5349.0 mbrf and was successful (0630 hr on 9 Novem-ber). The seafloor depth indicated by the recovery of this first core was 5353.0 mbrf and was 12.1 m deeper than the PDR depth.
Hole 1217A was deepened to 99.2 mbsf before it was deemed neces-sary to switch to the extended core barrel (XCB) to achieve the objec-tive of obtaining a sample of basement (Table T1). Two of the twelve APC cores (Cores 6H and 8H) did not achieve a full 9.5-m stroke, pre-sumably the result of striking chert. Many of the fully advanced cores also experienced lateral suctioning (flow-in) of sediment below recov-ered chert nodules. The cores were oriented starting with Core 3H. No heat flow measurements were attempted because of the high probabil-ity of damage to the Adara cutting shoe by chert. Hole 1217A APC oper-ations resulted in 99.2 m of cored section with 86.17 m of material re-covered (86.9%).
XCB coring (Cores 13X–17X) deepened the hole from 99.2 to 145.2 mbsf, with recovery consisting of chert fragments and a section of nan-nofossil chalk near basement. A small sample of basalt was obtained in the last core. XCB coring operations deepened Hole 1217A 46.0 m be-yond the APC operations and recovered 3.77 m (8.2%). The total recov-ery for Hole 1217A was 89.94 m, representing 61.9% of the cored inter-val.
Hole 1217B
After the bit cleared the seafloor, the vessel was offset 10 m north of Hole 1217A. The bit was washed to 20 mbsf before we initiated APC op-erations. Hole 1217B was spudded with the APC at 1545 hr on 10 No-vember. Seven piston cores were obtained over the interval from 20.0 to 86.5 mbsf (Table T1). Many of the cores had flow-in or disturbance be-low recovered chert nodules. All cores from Hole 1217B were oriented. The average recovery was 92.5%.
Hole 1217C
After coring operations in Hole 1217 ceased, the bit was pulled clear of the seafloor, the vessel was moved another 10 m north, and Hole 1217C was spudded at 0630 hr on 11 November. The bit was washed to 32 mbsf, where APC coring operations began. Five oriented cores were taken over the interval from 32.0 to 79.5 mbsf (Table T1). The average recovery was 98.6%, but many cores suffered from flow-in.
After coring operations ceased at Site 1217, the drilling equipment was secured, and the beacon was successfully recovered. The 24-hr transit to the next site (PAT-8) began at 1545 hr on 12 November.
LITHOSTRATIGRAPHY
At Site 1217, we recovered a 145-m section dominated by pelagic clay, radiolarian ooze, chert, and nannofossil chalk (Fig. F3). Fifty-two meters of middle Eocene–Holocene pelagic clay overlies 80 m of middle Eocene radiolarian clay and chert and 1.1 m of nannofossil chalk. Thirty centimeters of basalt were also recovered at the base of this site.
Three holes were drilled at Site 1217. Recovery in Hole 1217B and Hole 1217C began at 20 and 32 mbsf, respectively. The sedimentary sec-tion is divided into four lithologic units on the basis of sedimentary fa-cies. Drilling of Holes 1217B and 1217C was terminated above the chert horizon (Subunit IIB); therefore, this description is largely based on re-sults from Hole 1217A. Lithologic Unit I, Subunit IIA, and Unit III are disturbed by drilling and chert in the upper few centimeters of most cores. Chert in Subunit IIB created numerous flow-ins and other distur-bances, resulting in poor recovery throughout this interval.
Unit I
Intervals: 199-1217A-1H, 0 cm, through 7H-1, 140 cm; 199-1217B-2H, 0 cm, through 3H-CC; and 199-1217C-199-1217B-2H, 0 cm, through 3H-CC
Depths: 0–52 mbsf (Hole 1217A); 20–39 mbsf (Hole 1217B); and 32–51 mbsf (Hole 1217C)
Age: Holocene to middle Eocene
Lithology: clay and nannofossil ooze with clay
The sediments of Unit I vary between dark yellowish brown (10YR 4/ 6) and very dark brown (7.5YR 2.5/2) clay. Zeolitic clay and clay with ze-olites are present throughout Unit I, with zeolite and iron oxide content increasing downcore. Sediments are commonly mottled, with bioturba-tion ranging from slight to moderate. Flow-in occurs within Unit I in Cores 199-1217A-5H (38–43 mbsf) and 199-1217C-3H (45–51 mbsf).
Manganese nodules are present at the top of Hole 1217A. The first downhole appearance of chert occurs in Sections 199-1217A-5H-3, 56 cm; 199-1217B-3H-6, 90 cm; and 199-1217C-3H-2, 116 cm. Below this horizon, black (N1) and brownish black (5YR 2/2) centimeter-sized frag-mented chert nodules result in core disturbance. A vitric ash layer is present at Section 199-1217B-3H-3, 96 cm. The distinctive dark yellow-ish brown (10YR 4/4) to very dark brown (10YR 2/2) color change ob-served at Site 1215, thought to represent a change in the eolian dust source from China to North America (see “Lithostratigraphy,” p. 4, in the “Site 1215” chapter), was not observed at Site 1217.
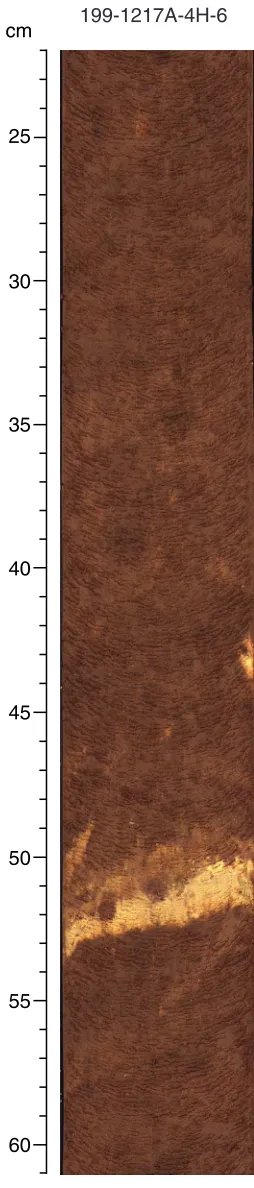
Within Unit I is a lower Oligocene dark yellowish brown (10YR 4/4) nannofossil ooze with clay (intervals 199-1217A-4H-2, 36 cm, to 4H-6, 118 cm; 199-1217B-2H-5, 41 cm, to 2H-CC, 10 cm) and not recovered in Hole 1217C. This interval shows heavy bioturbation/mottling. The upper boundary between the nannofossil ooze and the overlying clay is gradational. At the lower contact of the nannofossil ooze in Hole 1217A, there is a prominent (4 cm thick) light gray (10YR 7/1) vitric ash layer (Fig. F4) (interval 199-1217A-4H-6, 50–54 cm) not represented in Hole 1217B. This ash layer has a bioturbated upper contact with the nannofossil ooze and a sharp basal contact with clay. An ash layer was also observed within the nannofossil ooze in Samples 199-1217A-4H-4, 14–15 cm, and 199-1217B-2H-CC.
IV Basalt
Core
Depth (mbsf)
RecoveryCoreRecoveryCoreRecovery
10 20 30 40 60 70 80 90 110 120 130 140 50 100 Hole 1217A Hole 1217B Hole 1217C 1H 1W 1W 2H 2H 3H 4H 5H 6H 3H 4H 5H 6H 7H 8H
Drilled 0-20 mbsf
Drilled 0-32 mbsf
2H 3H 4H 5H 6H 7H 9H 10H 11H 12H 13X 14X 15X 16X 17X TD 145.2 mbsf
TD 86.5 mbsf TD 79.5 mbsf 8H
Lithologic unit/subunitAge
Lithology I IIA III IIB Oligocene–Holocene
early Eocene to middle Eocene
e.Eoc.
Nannofossil ooze Nannofossil chalk Basalt
Clay Radiolarian ooze with increasing clay content
Clay with chert
Magneticsusceptibility(10
-6
SI ) Naturalgamma(cps) Magneticstratigraphy
Color reflectance( L*) Calcite(model wt%) Opal(model wt%) Illite(model wt%) Smectite(model wt%)
Radiolarians
Nannofossils Foraminifers
Physical properties LAS Mineralogy Zone
NP9
NP17-NP22 (NP17-NP20)nannofossil assemblage
NP10
Unzoned Unzoned
P6b
Late Eocene-Oligocene benthic assemblage
P6a Site 1217
5015010 20 30 30 40 504080206020602060
C20n C19n C18n C17n C13n C15n C12n C16n RP19 Unzoned RP18 RP17 RP16 RP15 RP14 Unzoned l. Paleoc. late Eocene
F3. Lithologic summary, p. 24.
199-1217A-4H-6 cm 35 45 60 50 25 55 40 30
F4. Unit I ash layer within
Unit II
Intervals: 199-1217A-7H-1, 140 cm, through Core 15X; 199-1217B-4H, 0 cm, through 8H-CC; and 199-1217C-3H, 0 cm, through 6H-CC
Depths: 52–128 mbsf (Hole 1217A); 39–87 mbsf (Hole 1217B); and 51–80 mbsf (Hole 1217C)
Age: middle to early Eocene
Lithology: radiolarian ooze with clay, clayey radiolarian ooze, chert, and clay
Unit II is divided into two subunits based upon the lithological com-ponents. The base of Subunit IIA was only recovered in Hole 1217A.
Subunit IIA
Intervals: 199-1217A-7H-1, 140 cm, through 11H-CC; 199-1217B-4H-1, 0 cm, through 8H-CC; and 199-1217C-3H-1, 0 cm, through 6H-CC
Depths: 52–90 mbsf (Hole 1217A); 39–87 mbsf (Hole 1217B); and 51–80 mbsf (Hole 1217C)
Age: middle Eocene
Lithology: radiolarian ooze with clay and clayey radiolarian ooze Subunit IIA is composed primarily of a very dark brown (7.5YR 2.5/3) radiolarian ooze with clay. Clay content increases downhole, and the li-thology grades into a dark brown (7.5YR 3/4) clayey radiolarian ooze in Sections 199-1217A-7H-6, 120 cm, and 199-1217B-7H-2, 30 cm. The ooze is commonly mottled by brownish yellow (10YR 6/8) markings that denote undifferentiated burrows. The upper contact with the Unit I clay is gradational. As in Unit 1, black (N1) chert nodules and fragments re-sult in core disturbance in some intervals. Traces of oxides are present throughout Subunit IIA. A 2-cm-thick, very pale brown (10YR 8/3) vitric ash layer is present in interval 199-1217B-6H-3, 74–76 cm. Centimeter-scale oscillations of strong brown (7.5YR 4/6), dark reddish brown (5YR 3/4), and dark-brown (7.5YR 3/4) banding are present within Cores 199-1217B-6H and 199-1217C-5H and are also represented in the color re-flectance data (see “Composite Depths,” p. 13). However, no significant changes in clay or radiolarian content could be distinguished through smear slide examination.
Notable accessories include a medium gray (N5) 3-cm-sized pumice pebble in interval 199-1217B-8H-3, 135–138 cm (Fig. F5). A thin section of the pumice indicates a glassy, amorphous structure with accessory minerals including plagioclase. Several voids in the thin section con-tained radiolarian tests and fragments; one species was tentatively iden-tified as Siphocampe acephala (Eocene).
Subunit IIB
Interval: Cores 199-1217A-12H through 15X Depth: 90–128 mbsf (Hole 1217A)
Age: middle to early Eocene Lithology: chert and clay
Subunit IIB is differentiated from Subunit IIA by the predominance of chert. Cores 199-1217A-12H to 15X are highly disturbed by the presence
199-1217B-8H-3
cm
130
135
140 125
F5. Pumice pebble in Subunit IIA,
of chert, which resulted in poor recovery. The chert is commonly black (N1) and broken into pebble-sized fragments by the drilling process. An-gular pebbles and massive chert are present within a dark-brown (7.5YR 3/2) clay slurry. Massive chert in Core 199-1217A-14X showed black (N1) and brownish black (5YR 2/2) banding. The clay is not in situ be-cause of drilling disturbance and in many instances is completely re-moved.
Unit III
Interval: Section 199-1217A-16X-1, 0 cm, through 16X-2, 20 cm Depth: 128–129 mbsf (Hole 1217A)
Age: early Eocene
Lithology: nannofossil chalk with clay and dolomite
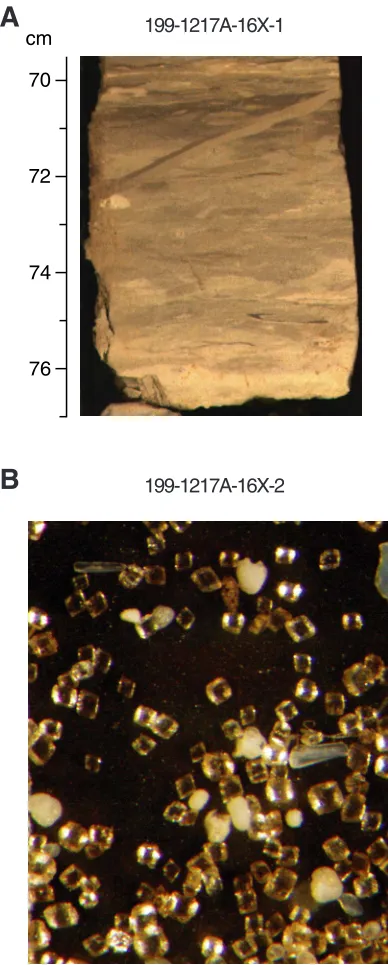
Beneath the chert horizons, we recovered a thin (1.13-m-thick) very pale brown (10YR 8/3) nannofossil chalk with clay and dolomite that is intercalated with 3- to 6-cm-thick beds of a very dark brown (7.5YR 2.5/ 2) nannofossil claystone with dolomite and light-gray (10YR 7/2) nan-nofossil chalk (Fig. F6A). The dolomite crystals are clear, near-perfect rhombs (Fig. F6B). The nature of the contact with the overlying chert and clay is unknown because of poor recovery. The interval is heavily mottled.
Unit IV
Interval: Core 199-1217A-17X Depth: 129–138 mbsf (Hole 1217A) Age: late Paleocene
Lithology: basalt
Core 199-1217A-17X contains a fine-grained, weathered, ocean-floor basalt with aphanitic texture. Rock fragments are composed of elongate white plagioclase and black pyroxene crystals and black glass. Clay was present with nannofossils, which indicates a late Paleocene age (NP9).
Discussion/Summary
The sedimentary section at Site 1217 records lower Eocene nannofos-sil chalk overlain by lower–middle Eocene chert. Middle Eocene– Holocene deposition is represented by the overlying clay and radiolarian-ooze lithologies. Radiolarian biostratigraphy indicates that the radiolarian-ooze lithology represents ~8 m.y. of deposition; unlike modern siliceous sediments, this ooze is dominated entirely by radiolar-ians, not diatoms.
The lower Oligocene nannofossil ooze within Cores 199-1217A-4H and 199-1217B-2H is similar to the nannofossil ooze and chalk recov-ered at DSDP Site 162 (Fig. F7) (van Andel et al., 1975). Paleodepth cal-culations suggest seafloor depths >4 km at Site 1217, which helps to constrain the depth of the Oligocene CCD at this time (see Fig. F12,
p. 63, in the “Leg 199 Summary” chapter).
A 199-1217A-16X-1
199-1217A-16X-2
cm
72 70
74 76
B
F6. Nannofossil chalk and
dolo-mite rhombs, p. 27.
0 20 40 60 80 100 120 140
0 20406080 100
Depth (mbsf)
Carbonate (wt%)
Oligocene Eocene ?
F7. Carbonate data, DSDP Site 162,
BIOSTRATIGRAPHY
The red clays and radiolarian clays of Site 1217 are mostly barren of calcareous microfossils with the exception of a few short intervals (Fig.
F8). The fossil content of the upper part of the sediment sequence is limited to ichthyoliths and occasional concentrations of agglutinated benthic foraminifers. The underlying radiolarian clays, whose top is at ~26.3 mbsf in Section 199-1217A-4H-2, contain radiolarian assemblages indicative of a late Eocene–middle Eocene age (RP18 to RP14). A late Eocene–middle Eocene age for the top of the radiolarian clay sequence is supported by a few samples containing calcareous nannofossils and calcareous benthic foraminifers. A 1.13-m-thick sequence of nannofos-sil chalk in Core 199-1217A-16X (128.1–129.2 mbsf) contains a diverse and moderately well preserved assemblage of nannofossils, planktonic foraminifers, and benthic foraminifers representative of lower Eocene Zones NP9 and NP10 and Subzone P6a. The presence of rare, poorly preserved benthic foraminifers typical of the late Paleocene in Core 199-1217A-17X suggests that the site may have drilled through the P/E boundary. However, the presence of lower Eocene nannofossils in these same samples raises the possibility that the benthic foraminifers have been reworked from older strata.
Calcareous Nannofossils
Red-clay and chert facies barren of nannofossils characterize all core catcher samples except for Sample 199-1217A-17X-CC, containing a P/E boundary assemblage from Zone NP9. This core catcher sample also contains basalt. The first downhole occurrence of nannofossils was ob-served in a short interval in Sections 199-1217A-4H-2 through 4H-4, in-dicating a brief interval of carbonate preservation interrupting the red-clay facies. Five samples were investigated from this carbonate-bearing sediment and all showed severe calcite dissolution.
The best-preserved sample was observed in Section 199-1217A-4H-4, 10 cm, and includes the following species: abundant Dictyococcites bisec-tus, Dictyococcites hesslandii, Reticulofenestra dictyoda, common Discoaster deflandrei, Discoaster tanii, Sphenolithus moriformis, and rare Reticulofenes-tra umbilicus≥14 µm, Coccolithus pelagicus, Sphenolithus predistentus, and
Sphenolithus tribulosus. Many isolated nonbirefringent placolith shields were observed, which are probably distal shields of C. pelagicus. A 2-cm-thick whitish layer in red clays from Section 199-1217A-4H-6 contained a similar nannofossil assemblage, although only rare D. tanii was ob-served in this layer.
The presence of rare R. umbilicus and S. tribulosus, with abundant D. bisectus and the absence of both Eocene rosette-shaped discoasters and
Ericsonia formosa, suggests that Sections 199-1217A-4H-4 through 4H-6 belong to Zone NP22 of the lower Oligocene (Chron C12r).
Section 199-1217A-16X-1 and upper Section 16X-2 contains a mot-tled carbonate chalk unit belonging to Zones NP10 and NP9. A dis-solved but otherwise indigenous lower Eocene assemblage characterizes Sample 199-1217A-16X-1, 6 cm, with common Tribrachiatus contortus,
indicating Zone NP10. Calcite overgrowth complicates accurate identi-fication of the evolutionary transitions in the Rhombaster-Tribrachiatus
lineage. Yet Tribrachiatus bramlettei was observed from Sample 199-1217A-16X-1, 24 cm, to Sample 16X-1, 78 cm (NP10). The next deeper
Core Depth (mbsf) Recovery 10 20 30 40 60 70 80 90 110 120 130 140 50 100 Hole 1217A 1H 2H 3H 4H 5H 6H 7H 9H 10H 11H 12H 13X 14X 15X 16X 17X TD 145.2 mbsf 8H CoreRecovery Hole 1217B 1W 2H 3H 4H 5H 6H 7H 8H
Drilled 0-20 mbsf
TD 86.5 mbsf Core Recovery Hole 1217C 1W 2H 3H 4H 5H 6H
Drilled 0-32 mbsf
TD 79.5 mbsf RP18 RP16 RP15 RP14 Unzoned RP18 RP19 RP16 RP17 RP15 Unzoned Unzoned RP18 RP17 Unzoned Unzoned Unzoned Nannofossils Foraminifers P6a NP9 P6a/ P6b RP15
late Eocene-Oligocene benthic assemblage NP17-NP22 (NP17-NP20)Nannofossil assemblage
RP17 u. Paleocene? benthic assemblage Unzoned NP10 Radiolarians Unzoned Radiolarians Radiolarians Eocene middle early late Series Oligocene- Holocene late Paleoc.?
F8. Distribution of
sample (16X-1, 103 cm) contains abundant Rhomboaster cuspis, and T. bramlettei is absent indicating upper Zone NP9.
Small chalk pockets embedded in a piece of chert (Sample 199-1217A-16X-2, 73 cm) contain common Discoaster multiradiatus and R. cuspis among a dissolved, indigenous lower Eocene assemblage lacking
Fasciculithus spp., which indicates upper Zone NP9.
Core 199-1217A-17X only had recovery in the core catcher (pieces of basalt and some clay), which yielded a corroded assemblage with com-mon to abundant D. multiradiatus and Fasciculithus tympaniformis indi-cating lower Zone NP9 of the uppermost Paleocene. Other species ob-served belong to the genera Chiasmolithus, Coccolithus, Cruciplacolithus, Prinsius, Sphenolithus, and Toweius.
Planktonic Foraminifers
Sediments from Site 1217 are barren of planktonic foraminifers ex-cept for the burrow-mottled chalk recovered in Core 199-1217A-16X. Preservation of foraminifers is highly variable through this section. Samples 199-1217A-16X-1, 27–29 cm, and 16X-1, 74–75 cm, contain heavily dissolved assemblages in which only the more resistant species remain. A few degraded specimens of Morozovella subbotinae, Morozo-vella gracilis, MorozoMorozo-vella aquea, Acarinina soldadoensis, and Acarinina coalingensis in these samples indicate an early Eocene (Subzones P6a and P6b) age. Preservation is very poor in Sample 199-1217A-16X-1, 105–107 cm, and no age diagnostic species are identifiable. Preservation improves slightly downcore, and Sample 199-1217A-16X-2, 19–21 cm, contains a reasonably diverse assemblage of early Eocene planktonic foraminifers of a typically tropical nature. Specimens are common and poorly to moderately well preserved. Based on the occurrence of Moro-zovella marginodentata, M. gracilis, M. subbotinae, and M. aquea and in the absence of Subzone P6b marker M. formosa and the Paleocene Zone P5 marker Morozovella velascoensis, we place this sample in lower Eocene Subzone P6a. The sample also contains A. soldadoensis, Acarinina wilcox-ensis, Globanomalina pseudoimitata, Subbotina patagonica, Parasubbotina varianta, and the small unidentified species reported at Site 1215 (cf.
Tenuitella? sp).
Benthic Foraminifers
Benthic foraminifers are largely absent from the red clay and radio-larian ooze and are present only occasionally at certain intervals in the recovered sections from Site 1217. When present, benthic foraminifers are composed of either agglutinated or calcareous assemblages. The ag-glutinated assemblages show low diversity, are poorly preserved, and of little stratigraphic use. In contrast, calcareous foraminiferal assemblages are well preserved and relatively diverse, but such assemblages are lim-ited in stratigraphic occurrence. Samples 199-1217A-1H-CC through 3H-CC; 7H-CC through 11H-CC; 12H-1, 0–5 cm; 15X-1, 29–30 cm, and core catchers between Samples 199-1217B-5H-CC and 8H-CC are bar-ren of benthic foraminifers. The distribution of benthic foraminifers is reported in Table T2.
Well preserved assemblages of benthic foraminifers are found in Samples 199-1217A-4H-2, 114–116 cm; 4H-3, 27–29 cm; 4H-4, 10–12 cm; and 4H-6, 51–53 cm. Of these, the assemblage in Sample 199-1217A-4H-2, 114–116 cm, shows the greatest diversity. The most com-mon species are Globocassidulina sp., Nuttallides umbonifer, Gyroidinoides
T2. Distribution of benthic
spp., and large specimens of Cibicidoides grimsdalei and Cibicidoides
hav-anensis, which indicate lower bathyal to abyssal depths (van
Morkhoven et al., 1986). The latter two species range from the lower Eocene to the Miocene but are typically most abundant in Eocene– Oligocene deep-sea sediments (van Morkhoven et al., 1986). N. umboni-fer is a common species in the deep sea after the extinction of Nuttal-lides truempyi and has its last occurrence in the uppermost Eocene (Zone P17; Berggren and Miller, 1989). However, N. truempyi more commonly disappears near the middle/upper Eocene boundary (planktonic fora-miniferal Zone P15) at abyssal depths (Berggren and Miller, 1989). As-semblages that contain N. umbonifer in the absence of N. truempyi have also been recognized in bathyal late Eocene sediments (Nomura, 1995). Based on this information, the assemblage of Sample 199-1217A-4H-2, 114–116 cm, can be assigned to a late Eocene or younger age.
Samples 199-1217A-16X-2, 19–20 cm, and 17X-CC contain calcare-ous foraminifers such as N. truempyi, Anomalinoides spissiformis, Bulim-ina semicostata, GlobocassidulBulim-ina globosa, and Abyssamina poagi. Plank-tonic foraminifers are also present and nearly in equal abundance to the benthic assemblage with a planktonic:benthic ratio of 1.2:1. Gave-linella beccariiformis, Aragonina velascoensis, Pullenia coryelli, and Gyroidi-noides globosus, all of which belong to the Velasco-type foraminifers (van Morkhoven et al., 1986), are rare in Sample 199-1217A-17X-CC. However, they are badly preserved and may be reworked from older sediment. Foraminifer assemblages in these two samples are dominated by N. truempyi and A. poagi, and they account for 50% of the total as-semblage of Sample 199-1217A-16X-2, 19–20 cm, and 69% of Sample 199-1217A-17X-CC. The high abundance of these two species suggests that these assemblages belong to the early Eocene.
Radiolarians
The upper red clay (Unit I) of Hole 1217A contains rare to few, poorly preserved radiolarians from Sample 199-1217A-1H-CC to 6H-6, 45–47 cm. Samples 199-1217A-4H-5, 45–47 cm, and 4H-6, 45–47 cm, probably belong to Zone RP19, although the presence of reworked specimens of
Thyrsocyrtis triacantha and Eucrytidium fistuligerum cast some doubt on the zonal designation. The first occurrence of Cryptocarpium azyx in Sample 199-1217A-6H-CC places this sample in Zone RP17, but the fau-nal assemblage between that sample and the Zone RP19 samples is too poor to allow placement of the RP17/RP18 boundary. These samples were particularly difficult to disaggregate, and the clay content could not be completely eliminated. All subsequent downhole samples con-tain a rich, well preserved middle Eocene radiolarian fauna. Samples 199-1217A-7H-2, 45–47 cm, through 1217A-7H-CC belong to Zone RP16. At Section 199-1217A-7H-6, ~134–138 cm, there is a band of pure radiolarian ooze. Samples 199-1217A-8H-CC through 9H-CC fall within Zone RP15. The boundary between Zones RP15 and RP14 is defined as the evolution from Podocyrtis mitra to Podocyrtis chalara but is placed here at the first occurrence of P. chalara. Using this definition, the re-mainder of the studied interval down to Sample 199-1217A-12H-1, 1–5 cm, belongs to Zone RP14.
Samples 199-1217B-3H-2, 32–34 cm; 3H-3, 84–86 cm; and 4H-1, 50–52 cm, belong to Zone RP18. Samples 199-1217B-4H-1, 140–142 cm, and 4H-2, 50–52 cm, are assigned to Zone RP17; Samples 199-1217B-5H-1, 80–82 cm, and 5H-2, 80–82 cm, to Zone RP16; and the remaining sam-ples down to 199-1217B-7H-2, 130–132 cm, fall within Zone RP14.
Four samples were taken from Hole 1217C. The uppermost material from Sample 199-1217C-3H-1, 60–62 cm, contains a moderately well preserved, but somewhat sparse, fauna belonging to Zone RP18. The next sample (199-1217C-3H-2, 10–12 cm) belongs to the same zone but contains a much richer assemblage. Sample 199-1217C-3H-2, 98–100 cm, falls within Zone RP17, and Sample 5H-1, 120–122 cm, falls within Zone RP15.
PALEOMAGNETISM
All archive-half core sections from Holes 1217A, 1217B, and 1217C were measured on the shipboard pass-through cryogenic magnetome-ter. A total of 134 core sections were measured from the 24 cores recov-ered in the 3 holes. The natural remanent magnetization (NRM) was measured at 5-cm intervals in each core section, followed by four to five steps of AF demagnetization up to a maximum peak field of 20 mT. For sections with clearly disturbed sediment, a blanket demagnetization at 15 mT was applied, but the directions were not used for establishing the magnetostratigraphy. In addition, 10 discrete samples were taken from Hole 1217A cores to carry out more detailed progressive demagnetiza-tion. As at Site 1216, several of the measured cores are in poor condi-tion mostly because of drilling disturbance.
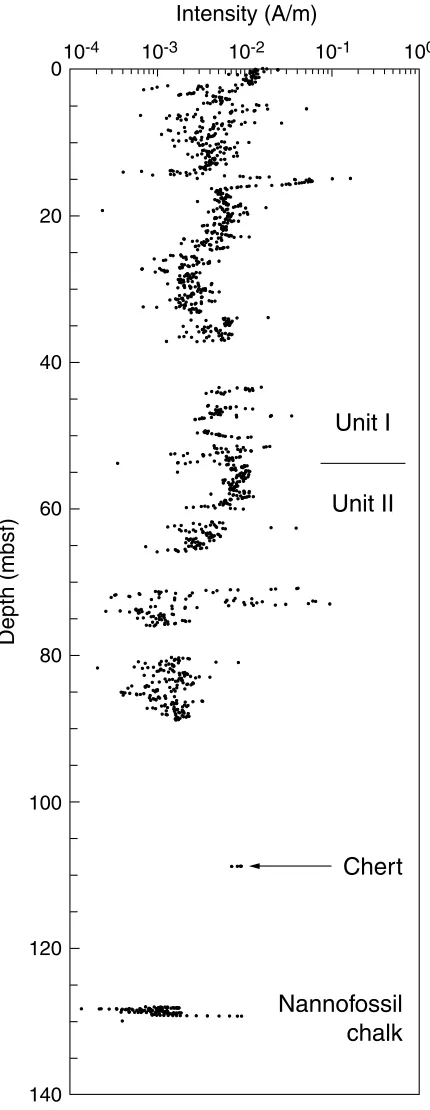
NRM magnetization intensities were in the order of 10–2 to 10–1 A/m
and decreased to about 10–3 to 10–2 A/m after partial AF
demagnetiza-tion (Fig. F9). Magnetization intensity for the basal sedimentary unit (the nannofossil chalk at 128–129 mbsf) is slightly lower than in overly-ing Units I and II but still above the noise level of the cryogenic magne-tometer. Also, a chert interval from Core 199-1217A-14H at ~108 mbsf was measured and gave a reliable paleomagnetic signature. A large group of NRM inclinations showed steep downward directions (~70°), indicative of a drilling-induced overprint. This overprint was mostly re-moved with AF demagnetization, typically disappearing by the 10- to 15-mT demagnetization step. Some magnetic directions did not reach a stable point between 5 and 20 mT, suggesting that the ChRM has been only partially isolated.
Orientation
The Tensor tool was used to orient APC cores in Hole 1217A, starting with Core 199-1217A-3H, whereas all cores were oriented in Holes 1217B and 1217C. Although the Tensor tool provided a good first-order orientation for most cores, some of them needed to be reoriented by an additional vertical rotation. Reorientation assumes that no tectonic ro-tation has occurred, which seems very reasonable in this area and is based on the analysis of the paleomagnetic directions. The mean mag-netization direction computed for each core was restored to the north direction and all individual magnetization directions were rotated by the same amount. This was straightforward for all cores except for Core 199-1217A-9H, where the correct declination could not be established
Depth (mbsf)
Intensity (A/m)
Unit I Unit II
Nannofossil chalk Chert
10-4 10-3 10-2 10-1 0
20
40
60
100
80
100
120
140
F9. Magnetization intensities after
unambiguously. For this reason, the magnetic polarity from 61.95 to 66.04 mbsf in Hole 1217A must be treated with caution.
Discrete Sample Analysis
Oriented discrete samples (8-cm3 cubic plastic boxes) from Core
199-1217A-7H were thoroughly AF demagnetized up to 80 mT to examine the stability of the remanent magnetization and compute a more faith-ful ChRM direction using vector analysis instead of blanket demagneti-zation. Results are of good quality (Fig. F10) and provide our most reli-able estimate of the paleolatitude at this site and for an age corresponding to Chron C18n (38–40 Ma). The average ChRM inclina-tion for this set of 10 samples is 17.2°, corresponding to a paleolatitude of 8.2°N (upper/lower bounds are 9.5° and 6.8°, respectively).
Magnetic Polarity Stratigraphy
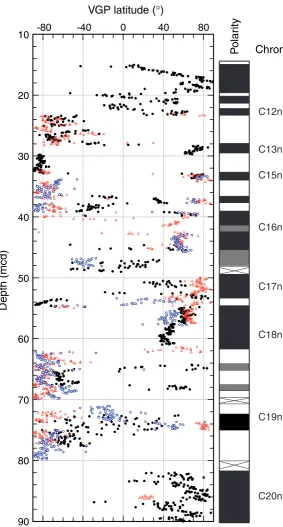
Except for sections that had to be discarded because of excessive drilling disturbance, Site 1217 provided a good record of geomagnetic reversals that could be easily interpreted as magnetozones (Table T3). ChRM inclinations are usually shallow, as expected in these latitudes, and a few cores gave a particularly good set of ChRMs (e.g., Core 199-1217A-7H) that passed a reversal test, which suggests that they repre-sent a clean record of the geomagnetic field. The directions from Core 199-1217A-7H gave average declination and inclination values of 32.15° and 22°, respectively, which are rather similar to those obtained from discrete samples. The inclination in the top 15 m of Hole 1217A cannot be unambiguously interpreted, probably because these sedi-ments had a very low accumulation rate from Oligocene to the Quater-nary time. The magnetostratigraphy of Site 1217 (Fig. F11) results from a composite of the virtual geomagnetic pole latitudes of Holes 1217A, 1217B, and 1217C that were spliced via the composite depth scale (see
“Composite Depths,” p. 13). We identify, from bottom to top, Chron C20n followed by Chron C19r, which is only partially resolved because of sediment disturbance. Upward in the section, Chrons C18n–C12n have also been identified. The magnetic ages are corroborated by the ra-diolarian zones found in the middle and upper parts of the section (see
“Radiolarians,” p. 11, in “Biostratigraphy”). Flow-in in cores 199-1217A-5H and 6H prevented the clear identification of Chrons C16 and C17, at ~40–45 mcd. Overall, the composite stratigraphic section be-tween 14 and 90 mcd spans ~13 m.y., or from the middle Eocene to the early Oligocene.
COMPOSITE DEPTHS
The recovered sediments from all three holes at Site 1217 were seri-ously affected by coring disturbance, downhole debris, and flow-in as-sociated with chert fragments blocking the core liner. In addition to this general coring disturbance throughout the cored interval, one stratigraphic interval was highly disturbed or not recovered in all three holes (~37–49 mbsf), thus preventing the recovery of a complete con-tinuous sedimentary section. Nevertheless, it was possible to generate a spliced, but discontinuous, record in the upper 90 m of the section. Be-low 90 mbsf (Cores 199-1217A-12H through 15H; 89.70–129.66 mbsf), there was negligible recovery because of difficult drilling conditions
as-J/Jmax Jmax = 1.75 × 10⁻² A/m
0
Demagnetization level (mT)
80 N, Up
E
Sample 199-1217A-7H-7, 43 cm
N
S
W E
F10. AF demagnetization of a
dis-crete sample, p. 31.
T3. Composite depths of
geomag-netic reversals, p. 50.
-80 -40 0 40 80 10
20 30 40 50 60 70 80 90
VGP latitude (°)
Depth (mcd)
P
olar
ity
Chron
C20n C19n C18n C17n C13n C15n C12n
C16n
F11. Composite magnetic
sociated with an extensive (~40 m thick) chert-rich interval. Approxi-mately 1.5 m of good-quality quasicyclical claystone and chalk were re-covered in Core 199-1217A-16X (129.66–137.70 mbsf), but this interval is omitted from further discussion because it was not cored in Holes 1217B and 1217C and is too stratigraphically removed from the shal-lower intervals.
Multisensor track (MST) and color reflectance data were collected from Holes 1217A, 1217B, and 1217C. Magnetic susceptibility (MS), P -wave velocity, and color reflectance data were collected at 2-cm intervals and gamma ray attenuation (GRA) bulk density data at 4-cm intervals on all core sections recovered from Holes 1217A to 1217C that were not entirely filled by chert fragments (see “Physical Properties,”
p. 18 and “Lithostratigraphy,” p. 6, for details about MST and color re-flectance data). Table T4 lists intervals from Holes 1217A to 1217C that are interpreted to be disturbed and are excluded from further discus-sion.
Figure F12 illustrates the MST and color reflectance data from Site 1217 on the mbsf depth scale, after culling MST data from the disturbed intervals listed in Table T4. The interhole correlation of the upper ~40 mbsf is straightforward as the result of a strong and clear variation of MS data as well as a clear decreasing pattern in the natural gamma ray (NGR) data that was also observed at Sites 1215 and 1216. Coring in Holes 1217B and 1217C began below 20 mbsf; thus, no data are avail-able from these holes to aid in composite-depth construction in the up-per 20 mbsf. Therefore, no depth adjustment was made to Cores 199-1217A-1H, 2H, and 3H.
A continuous composite record can be constructed from the top of Core 199-1217A-3H (15.00 mbsf; 15.00 meters composite depth [mcd]) down to the base of Core 199-1217B-3H (39.00 mbsf; 41.50 mcd), which corresponds to the middle of Core 199-1217A-5H (a disturbed in-terval in Hole 1217A). Figure F13 shows the MST and color reflectance data after adjusting to a common depth scale, and Table T5 lists the off-sets that were applied to the top of each core. Below 42 mcd (Core 199-1217B-3H), several cores can be placed into a composite depth frame-work (i.e., correlated to each other), but a continuous section cannot be constructed and it was not always possible to establish the true strati-graphic position of cores. For example, data from Cores 199-1217B-4H and 199-1217C-3H can be correlated to each other. In Figure F13, this interval is plotted between ~42.5 and 45.8 mcd, but the position of these cores is not constrained with respect to Hole 1217A or the other intervals above or below in any of the holes. This uncertainty also ap-plies to the relative position of other core segments below 49 mcd (Core 199-1217A-6H).
With the understanding that the composite depth scale aligns fea-tures within continuously cored segments but does not represent the relative sediment thickness across unconstrained intervals, one can construct a partially spliced record as defined by the splice table (Table
T6) and shown in Figure F14. The interhole correlation developed here is consistent with radiolarian biostratigraphic datums (see “Biostratig-raphy,” p. 9) and paleomagnetic data (see “Paleomagnetism,” p. 12).
SEDIMENTATION AND ACCUMULATION RATES
Average LSRs at Site 1217 are based primarily on paleomagnetic re-versals and nannofossil and radiolarian datums as defined in Holes
T4. Core disturbance intervals,
p. 51.
1.01.2 1.4 1.6 0 20 40 60 80
GRA bulk density (g/cm3)
Depth (mbsf)
0 20 40 NGR (cps) 20 40 60
Color reflectance (L*)
1500 1600
P-wave velocity (m/s) 0 100 200
Magnetic susceptibility
(10-6 SI)
F12. GRA bulk density, magnetic
susceptibility, color reflectance
(L*), P-wave velocity, and natural
gamma count data plotted vs. depth, p. 33.
1.0 1.21.4 1.6 0
20
40
60
80 GRA bulk density
(g/cm3)
Depth (mcd)
0 20 40 NGR (cps) 20 40 60
Color reflectance (L*)
1500 1600
P-wave velocity (m/s) 0 100 200
Magnetic susceptibility
(10-6 SI)
F13. GRA bulk density, magnetic
susceptibility, color reflectance
(L*), P-wave velocity, and natural
gamma count data plotted vs. composite depth, p. 34.
T5. Composite depth offsets, p. 52.
T6. Splice tie points, p. 53.
1.0 1.21.41.6 0
20
40
60
80 GRA bulk density
(g/cm3)
Depth (mcd)
0 20 40 NGR (cps) 20 40 60
Color reflectance (L*)
1500 1600
P-wave velocity (m/s) 0 100 200
Magnetic susceptibility
(10-6 SI)
F14. Spliced records of GRA bulk
density, magnetic susceptibility,
color reflectance (L*), P-wave
1217A through 1217C (Tables T7, T8). A few nannofossil datums are critical to determining the age at the base of the section. Radiolarian da-tums are not sufficiently well tied to the paleomagnetic timescale to al-low their use in this part of the section. LSRs are calculated using the mcd scale (see “Composite Depths,” p. 13) (Table T4) for each datum used in constructing the sedimentation rate plots (Figs. F15,F16). The values of these sedimentation rates are combined with the dry bulk density (DBD) data from porosity measurements on individual samples averaged over the intervals reported (see “Physical Properties,” p. 18) (Table T13) to determine the mass accumulation rates (MARs) of the sediments.
Density measurements on piston core EW9709-4P, taken in the site survey area, show a good similarity with density measurements from the spliced density record measured in cores from Site 1217 (Fig. F16). The EW9709-4P record spans a similar depth range in Site 1217 (down to ~14 m); however, there are no biostratigraphic or paleomagnetic da-tums that constrain this correlation.
From ~20 to 80 mbsf, the paleomagnetic data (see “Paleomagne-tism,” p. 12) (Fig. F11) show several distinct reversals. The uppermost distinct reversal (at 23.27 mbsf) in Hole 1217A is taken to be the base of Chron 12n. If we accept this point as the shallowest age control below the seafloor, we estimate the average LSR of the nonfossiliferous pelagic clays to be ~0.76 m/m.y. (Fig. F15). The interpretation for the base of Chron 12n leads to the identification of the next deeper normal inter-val in Hole 1217A as Chron13n, which lies at the base of the Oligocene. This identification fits with the underlying spacing and length of sev-eral normal and reversed interval and with the thin part of the litho-logic Unit I containing a layer of nannofossil-rich carbonate ooze (see
“Lithostratigraphy,” p. 6). This ooze, all from nannofossil Zone NP22, we take to represent the dramatic deepening of the CCD at the Eocene– Oligocene transition (see “Biostratigraphy,” p. 9).
Using identifications of the magnetic reversals, sedimentation rates in the clay underlying the carbonate are ~3.3 m/m.y., increasing to ~4.4 m/m.y. downhole as the more radiolarian-rich sediments of lithologic Unit II are encountered downcore (Fig. F17). In the lower part of the more well-dated section (~60–80 mcd), sedimentation rates appear to increase to 10 m/m.y. (Fig. F17). However, sedimentation rate estimates for this rather short interval are subject to substantial errors arising from even a small error in age or depth estimates. The overall LSR esti-mate for fossiliferous and cherty lower section of lithologic Units II and III is 4.8 m/m.y. (Fig. F15).
By combining LSR values with DBD, we determine the MAR of the total sediment (Table T9) and, when appropriate geochemical concen-tration data are available, the MAR of each sedimentary component. Sediment with an LSR of 1.0 cm/k.y. and a DBD of 1.0 g/cm3 will have a
MAR value of 1.0 g/cm2/k.y. The observed values are rarely this high, so
we report the data in milligrams per centimeter squared per thousand years (mg/cm2/k.y.). The accuracy of this calculation is ±10%–20%.
Lithologic Unit I (pelagic clays) is characterized by LSR and MAR val-ues that increase downhole: LSR from 0.76 m/m.y. in the upper 22.5 m (Fig. F15) to 4.4 m/m.y. in the interval just above 52 mcd (Fig. F17). Be-cause of downhole increases in DBD, the total mass flux increase from 45 mg/cm2/k.y. (in the age range 0–31 Ma) progressively to 150 mg/
cm2/k.y. (between 35 and 38 Ma) (Figs. F15,F17). This is the first record
clearly showing clay fluxes that increase downhole. Prior records indi-cate downcore decreases in the MAR of the red clays during middle
T7. Paleomagnetic datums, p. 54.
T8. Nannofossil and radiolarian
events, p. 55.
0 20 40 60 80 100 120 140
0 10 20 30 40 50 60
Depth (mcd) Age (Ma) 0.76 m/m.y. 4.8 m/m.y. Nannofossils Paleomagnetic reversal
45 mg/cm2/k.y.
F15. Plot of biostratigraphic and
paleomagnetic datum levels used to constrain average LSR vs. depth, p. 36.
1.2 1.3 1.4 1.5 1.6 1.7 1.8
1.1 1.2 1.3 1.4 1.5 1.6 0 2 4 6 8 10 12 14
EW9709-4P density (g/cm3)
Site 1217 density (g/cm3)
Depth (mcd)
EW9709-4P
Site 1217
F16. Core EW9709-4P density
compared with Site 1217 GRA den-sity, p. 37.
20 40 60 80 100 120 140
30 35 40 45 50 55 60
Depth (mcd) Age (Ma) 3.3 m/m.y. 4.4 m/m.y. 10.0 m/m.y. 4.6 m/m.y. Nannofossils Paleomagnetic reversal Radiolarians
150 mg/cm2/k.y. 115 mg/cm2/k.y.
260 mg/cm2/k.y.
120 mg/cm2/k.y.
570 mg/cm2/k.y. 95
135 110
F17. Plot of all biostratigraphic
and paleomagnetic datum levels, p. 38.
T9. Linear sedimentation rates and
Cenozoic time (Janecek and Rea, 1983; Kyte et al., 1993; J.D. Gleason et al., unpubl. data). The clayey carbonate ooze that occurs within Unit I has a MAR value of 135 mg/cm2/k.y. (Fig. F17).
The radiolarian oozes of Subunit IIA accumulated relatively slowly (115 mg/cm2/k.y.) between ~37.7 and 40 Ma then more than double
(260 mg/cm2/k.y.) for a brief period in the middle Eocene between ~40
and 42 Ma (Fig. F17). Older radiolarian oozes and clayey radiolarian oozes accumulated more slowly, at ~120 mg/cm2/k.y. (Fig. F17). These
values represent the first definition of a middle Eocene maximum in the accumulation rate in this facies. Subunit IIB spans ~14 m.y. of time and accumulated at a gross overall rate of ~120 mg/cm2/k.y.
The lower Eocene chalks of Unit III, near the base of the hole, accu-mulated at ~570 mg/cm2/k.y. (Fig. F17).
GEOCHEMISTRY
Interstitial Water Geochemistry
We collected interstitial waters from seven samples in Hole 1217A at depths ranging from 2.95 to 84.65 mbsf (Table T10; Fig. F18). Chemical gradients in the interstitial waters from Site 1217 reflect the dissolution of biogenic opal, the limited amount of organic matter diagenesis, and possibly the precipitation of authigenic minerals and the diffusive in-fluence of reactions in the underlying basalt.
Chlorinity, as measured by titration, increases with depth from val-ues of ~555 mM at 2.95 mbsf to valval-ues of ~565 mM at 84.65 mbsf. Chlorinity of the interstitial water samples from the upper two cores are lower than standard seawater (559 mM). Sodium concentrations as de-termined by charge balance (on average 1% lower than those measured by ion chromatograph) are similar to that of average seawater (480 mM) and show no consistent trend downhole. Salinity, as measured by a handheld refractometer, does not vary downhole; all interstitial waters were measured as 35.0, with the exception of a measurement of 36.0 at 55.15 mbsf.
Alkalinity values for the entire hole are higher than International As-sociation for the Physical Sciences of the Ocean (IAPSO) standard sea-water (2.325 mM) and increase slightly downhole from 2.43 mM at 2.95 mbsf to 3.40 mM at 84.65 mbsf. The pH ranges from 7.20 at 2.95 mbsf to a peak of 7.37 at 29.45 mbsf. Dissolved silica concentrations in-crease with depth from ~280 µM at 2.95 mbsf to values of ~789 µM at 84.65 mbsf. Dissolved silica concentrations are higher than at Sites 1215 and 1216, which is consistent with the presence of radiolarian ooze (from ~50 to 90 mbsf) at Site 1217.
Interstitial water sulfate concentrations remain at or above seawater concentrations (~28 mM) throughout the hole, indicating that the amount of labile organic matter available for oxidation is extremely low. Consistent with high sulfate values, ammonium is present at ex-tremely low levels (<10 µM).
Dissolved manganese concentrations are low throughout the intersti-tial water profile at Site 1217 (<2.5 µM). Lithium and strontium concen-trations are approximately or only slightly higher than seawater values (20 and 90 µM, respectively) throughout the pore water profiles.
Calcium concentrations in the pore waters from Site 1217 are similar to IAPSO concentrations (~10 mM). Magnesium concentrations are lower than IAPSO values (from 2.95 to 55.15 mbsf). These low
magne-T10. Interstitial water data, p. 57.
550 560 570 0 25 50 75 100
Cl (mM)
Depth (mbsf)
2 3 4 Alkalinity (mM)
25 30 35 SO4 (mM)
0 10 20 NH4 (µM)
0 500 1000 H4SiO4 (µM)
0 30 60 Ca and Mg (mM)
10 12 14 0 25 50 75 100
K (mM)
Depth (mbsf)
0 0.5 1 Ba (µM)
0 2.5 5 Mn (µM)
400 600 800 B (µM)
20 30 40 Li (µM)
80 85 90 Sr (µM)
sium concentrations in the pore waters may indicate magnesium up-take in the precipitation of yet unidentified authigenic minerals. Potas-sium concentrations increase from 11.9 to 12.6 mM for 0–19.45 mbsf. Below 19.45 mbsf, there is an overall decrease in potassium concentra-tions from 11.8 to 10.5 mM, which is consistent with higher levels of clay in the upper sediments (0–50 mbsf). The lack of increasing calcium and decreasing magnesium concentrations with depth likely indicates that the diffusive influence of reactions in the underlying basalt is small in these pore waters. Dissolved barium concentrations are low (~<0.50 µM). Boron concentrations range from 461 to 659 µM, higher than sea-water value (416 µM).
In summary, the pore water profiles from Site 1217 are influenced by the dissolution of biogenic silica, authigenic mineral precipitation, pos-sibly alteration of underlying basalt, and subsequent diffusion. High levels of sulfate and concomitant low levels of ammonium indicate an oxic environment consistent with the occurrences of metalliferous ox-ides within the sediment. Silica and alkalinity levels in the interstitial waters are higher than seawater values (and higher than values from Sites 1215 and 1216), indicating the relative importance of biogenic sil-ica as a component of these sediments.
Solid-Phase Geochemistry
We collected bulk-sediment samples adjacent to the interval sampled for physical properties (see “Physical Properties,” p. 18), resulting in a sampling resolution of approximately one per section from 0.79 to 128.83 mbsf in Hole 1217A (Table T11; Fig. F19). We also collected sam-ples from 31.74 to 72.73 mbsf in Hole 1217B to fill in gaps in the Hole 1217A sediment column (Table T11; Fig. F19). We show all data plotted against depth in mcd for Site 1217 (Fig. F19). Depth in mbsf and mcd for each hole is provided (Table T11). We measured silicon (Si), alumi-num (Al), titanium (Ti), iron (Fe), manganese (Mn), calcium (Ca), mag-nesium (Mg), phosphorus (P), strontium (Sr), and barium (Ba) concen-trations in the sediment by inductively coupled plasma–atomic emission spectroscopy (ICP-AES). Bulk-sediment geochemistry prima-rily reflects the changing lithology of the sediments from red clay to nannofossil ooze in Unit I to radiolarian ooze and clay in Subunit IIA to nannofossil chalk in Unit III.
Silicon generally ranges between 20 and 30 wt%, which is consistent with the dominance of red clay and siliceous sediment throughout most of the depth range (Fig. F19). The exceptions are a decrease in sili-con to ~11 wt% in the nannofossil ooze section between 27 and 29 mcd and a decrease to ~4 wt% in a sample from 129 mcd in the nannofossil chalk.
Aluminum and titanium in Site 1217 sediments follow similar trends of aluminum and titanium in sediments from Sites 1215 and 1216. Alu-minum decreases overall downhole from ~9 wt% at 0.79 mcd to <1 wt% at 129.09 mcd (Fig. F19). The nannofossil ooze is marked by lower alu-minum values (<3 wt%). Titanium content decreases from 0.91 wt% at 0.79 mcd to 0.01 wt% at 129.09 mcd. Titanium values in the shallowest sediments (0–5 mcd) are higher than observed in Sites 1215 and 1216 sediments. Al/Ti ratios in these shallow sediments are significantly lower (as low as 10) than at Sites 1215 and 1216.
Iron and manganese contents show similar trends to each other (Fig.
F19). In the red clay Unit I (~0–50 mcd), iron varies between ~5 and ~9 wt% and manganese varies between 0.5 and ~1.5 wt%. Both iron and
T11. Bulk-sediment data, p. 58.
0 20 40 0 40 80 120
Si (wt%)
Depth (mcd)
0 4 8 Al (wt%)
0 30 0 40 80 120
Ca (wt%)
Depth (mcd)
0 2 4 Mg (wt%)
0 0.40.8 P (wt%)
0 1000 Sr (ppm)
0 25005000 Ba (ppm) 0 0.40.8
Ti (wt%) 0102030
Fe (wt%) 0 2 4
Mn (wt%)
manganese decrease in the radiolarian ooze and the nannofossil chalk (Units II and III).
Consistent with the lack of carbonate in most sections, calcium is generally <2 wt% at Site 1217, with the exception of nannofossil ooze, where calcium is as high as 23 wt% (from ~27 to 29 mcd), and nanno-fossil chalk, where calcium is measured at ~42 wt% (129 mcd) (Fig.
F19). This 42 wt% value for Ca cannot be accurate because 100 wt% CaCO3 is 40 wt% Ca. Possible reasons for this discrepancy are given in “Geochemistry,” p. 20, in the “Explanatory Notes,” chapter. A more ac-curate value for CaCO3 (wt%) determined by coulometer is 83.55% (see
Table T12). Likewise, strontium is low (at ~200 ppm throughout) with the exception of peaks of ~1000 ppm in the nannofossil ooze and chalk (~27–29 mcd). Magnesium varies between 1.2 and 3 wt%.
Similar to Sites 1215 and 1216, phosphorus is low (generally <0.5 wt%) in Site 1217 sediments (Fig. F19). Barium contents in Site 1217 sediments are highest between 25 and 50 mcd (>2500 ppm) and are generally higher than at Site 1215 or 1216.
Calcium carbonate (CaCO3) (in weight percent) and organic carbon
(Corg) (in weight percent) were determined for approximately two
sam-ples per section from 0.79 to 128.83 mbsf in Hole 1217A and for one sample per core from 31.74 to 72.73 mbsf in Hole 1217B to fill in gaps in the Hole 1217A sediment column (Table T12). CaCO3 measured by
coulometer is low (less than or equal to ~1 wt%) for all of the sediments from Site 1217 except for samples between 26 and 31 mbsf and a fur-ther sample at 128.83 mbsf in Hole 1217A. CaCO3 values calculated
from Ca contents yielded similar trends to CaCO3 measured via
coulo-meter, although absolute values are lower for low carbonate values (<1 wt%) and higher for values >1 wt% (Table T12). Calculated values were negative for some samples, indicating a problem with the calibration at very low carbonate values (see “Geochemistry,” p. 20, in the “Explana-tory Notes” chapter). Corg is uniformly low (0–0.40 wt%) for all samples
measured (Table T12).
In summary, the bulk geochemistry of the sediments from Site 1217 reflects the varying lithology of the sediments between red clay, nannofossil ooze/chalk, and the increasing proportion of siliceous bio-genic sediments relative to earlier sites.
PHYSICAL PROPERTIES
Physical properties at Site 1217 were measured on whole cores, split cores, and discrete samples. MST measurements (bulk density, MS, P -wave velocity, and NGR) and thermal conductivity comprised the whole-core measurements. Compressional wave velocity measurements on split cores and moisture and density (MAD) analyses on discrete core samples were made at a frequency of one per undisturbed section in Hole 1217A. Intervals that were disturbed or not recovered in Hole 1217A were sampled in Hole 1217B for velocity and MAD analyses. Light absorption spectroscopy (LAS) analyses were performed on the MAD samples as well as an additional one sample per section (located ~50 cm from the MAD sample) in Hole 1217A.
T12. Calcium carbonate and
Density and Porosity
Two methods were used to evaluate the wet bulk density at Site 1217. GRA provided an estimate from whole cores. MAD samples gave a sec-ond, independent measure of wet bulk density as well as providing DBD, grain density, water content, and porosity from a discrete sample (Table T13). The MAD and GRA bulk density measures display the same trends, but the MAD densities are offset to higher values by 0.05–0.10 g/ cm3 (Fig. F20). Crossplots of wet bulk density and DBD vs. interpolated
GRA density (Fig. F21) show that despite the offset, the overall match between the data sets is excellent.
Wet bulk density at Site 1217 is highest between the seafloor and 22 mbsf, with values averaging 1.37 g/cm3. Below 22 mbsf, wet bulk
den-sity decreases sharply, reaching a minimum of 1.18 g/cm3 at 25.58
mbsf. The density of the nannofossil ooze in lithologic Unit I (between 27 and 32 mbsf) is distinctly higher at ~1.28 g/cm3. Below the
nanno-fossil ooze, the increase in abundance of radiolarians results in lower wet bulk density. Density values average 1.19 g/cm3 with little variation
in the sediments recovered from the lower part of Units I and II. The nannofossil chalk of Unit III was sampled at 128.83 mbsf and has a wet bulk density of 1.79 g/cm3.
Grain density (ρs) averages 2.62 g/cm3 in the uppermost 5 m at Site
1217. Below 5 mbsf, it decreases and becomes more variable, coinciding with the LAS-indicated decrease in illite and increase in smectite in the sediment (Fig. F20). A grain density increase below 22 mbsf accompa-nies the LAS-indicated increase in calcite. Between 5 and 34 mbsf, grain density averages 2.53 g/cm3. Below 34 mbsf, grain density is lower and
more variable, which coincides with an increase in radiolarian abun-dance. The average grain density for the lower part of Units I and II is 2.32 g/cm3. The grain density in Unit III is 2.73 g/cm3.
Porosity and water content vary inversely with wet bulk density (Fig.
F20). Porosity averages 75% in the uppermost 22 m at Site 1217. Below 22 mbsf, porosity increases sharply and remains high, averaging 88%. The porosity of the Unit III nannofossil chalk is 55%.
LAS
LAS studies were conducted on cores from Hole 1217A at a frequency of two samples per section (see Vanden Berg and Jarrard, this volume, for a discussion of the LAS technique). Semiquantitative mineral con-centrations were calculated from the collected spectra, assuming a four-component system: calcite, opal, smectite, and illite (Table T14). LAS analyses display the major changes in mineralogy over the different lithologic boundaries (Fig. F22). The upper 10 m of clay contain the distinct illite/smectite transition zone also seen at Sites 1215 and 1216. In the nannofossil ooze between 27 and 32 mbsf, calcite concentrations increase to ~43%, whereas clay contents decrease. The high opal sample (58%) located in this region marks a small bed of radiolarian ooze lo-cated at 28 mbsf. An increase in opal concentrations from 25% to 50% marks a change from clay-rich sediments (smectite rich) to a radiolarian ooze with clay at 52 mbsf. Over the interval from 52 to 90 mbsf, clay (smectite) contents increase downcore, whereas opal contents decrease. Lithologic Subunit IIB was not sampled because of severe core distur-bance. The final LAS sample is located at 128.8 mbsf and contains 63%
T13. Moisture and density
mea-surements, p. 61.
0 20 40 60 80 100 120 140
40 6080100
Depth (mbsf) Porosity (%) A Water content (%)
1.0 1.4 1.8
Wet bulk density (g/cm3) B
GRA bulk density (g/cm3)
2.0 2.4 2.8
Grain density (g/cm3) C I IIA IIB III IV Lithologicunit/sub u nit
F20. MAD measurements, p. 41.
1.0 1.2 1.4
1.0 1.2 1.4 y = 0.333 + 0.773x R = 0.96
W
et b
u
lk density (g/cm
3)
A
0.2 0.4 0.6
1.0 1.2 1.4 y = -1.088 + 1.243x
R = 0.97
Dr
y b
ulk density (g/cm
3)
Interpolated GRA density (g/cm3) B
F21. Wet and dry bulk density
plotted with GRA bulk density, p. 42.
T14. LAS-based mineralogy, p. 62.
Nannofossil ooze
Depth (mbsf)
Lith. unit/ subunitAge
Lithology I IIA III IIB IV Clay Clay
Clay with chert
Nannofossil chalk Radiolarian ooze with clay Increasing clay content
middle Eocene to Holocene
early Eocene to middle Eocene
e. Eoc.
0255075 100 0255075 100 0255075 100 0 255075 100 Calcite (model wt%) Opal (model wt%) Smectite (model wt%) Illite (model wt%) 20 40 60 80 120 100 0 Basalt
F22. LAS mineralogy
calcite, which is consistent with the lithologic description of a nanno-fossil chalk.
Compressional Wave Velocity
Compressional wave velocity was measured by the P-wave logger (PWL) on whole cores from Holes 1217A, 1217B, and 1217C and the in-sertion and contact probe systems on split cores from Holes 1217A and 1217B (Table T15). The match between the whole-core and split-core measurements is relatively good for the insertion probe system, but the contact probe values are ~25 m/s higher than the PWL values (Fig. F23). The general trends in the velocities are an increase from 1470 m/s near the seafloor to 1550 m/s at ~30 mbsf, a decrease to ~1510 m/s at 35 mbsf, and higher, more variable velocities below 35 mbsf. The maxi-mum velocity measured was 1595 m/s for the nannofossil chalk of lith-ologic Unit III.
Velocity anisotropy was calculated from longitudinal (z-direction) and transverse (y-direction) measurements provided by the insertion probe system (Table T15) to evaluate burial-induced changes in sedi-ment fabric. The anisotropy ranges from –0.7% to 1.8% and averages 0.9% (omitting an anomalous value of 3.0%) with no consistent trend with depth.
Thermal Conductivity
Thermal conductivity was measured on the third section of cores from Hole 1217A (Table T16). The thermal conductivity averages 0.75 W/(m·K). As is the case at Sites 1215 and 1216, there is a general inverse relationship between thermal conductivity and porosity at Site 1217.
NGR
NGR was measured on all whole cores at Site 1217 and displays trends similar to the other physical properties (Fig. F24). Between the seafloor and 25 mbsf, NGR values are high (~25 counts per second [cps]). Unlike Sites 1215 and 1216, the LAS-indicated illite/smectite transition in the upper 10 m is not marked by a decrease in NGR values. Below 25 mbsf, the NGR values decrease to ~1 cps and remain at this level to the bottom of Hole 1217A.
MS
Whole-core MS measurements display greater variability than other properties and only somewhat follow the identified changes in lithol-ogy (Fig. F25). The susceptibility increases from 50 × 10–6 SI at the
sea-floor to nearly 200 × 10–6 SI at 12 mbsf. This increase coincides with a
0.2 g/cm3 increase in the GRA bulk density (Fig. F20) and the transition
from illite to smectite clay. Between 12 and 25 mbsf, MS values decrease back to the range of 75 to 125 × 10–6 SI. Significantly lower
susceptibil-ity (~35 × 10–6 SI) marks the calcite-rich nannofossil ooze between 27
and 32 mbsf. Between 32 and 51 mbsf, MS values again increase to ~80
× 10–6 SI as a result of an increase in clay content. Lithologic Subunit
IIA, radiolarian-rich clay, is characterized by another drop in MS to val-ues of ~50 × 10–6 SI.
T15. Split-core velocity
measure-ments, p. 63.
0 20 40 60 80 100 120 140
1450 1500 1550
Depth (mbsf) Velocity (m/s) I IV IIB IIA III Lithologicunit/sub unit
F23. Compressional wave velocity,
p. 44.
T16. Thermal conductivity
mea-surements, p. 64.
0 20 40 60 80 100 120 140
0 50 100 150
Depth (mbsf) Natural gamma (cps) I IIB IV IIA III Lithologicunit/sub unit
F24. Natural gamma radiation,
p. 45. 0 20 40 60 80 100 120 140
0 50100150 200
Depth (mbsf)
Magnetic susceptiblity (10-6 SI)
III IIA IIB I IV Lithologicunit/sub unit
F25. Magnetic susceptibility,
REFERENCES
Berggren, W.A., and Miller, K.G., 1989. Cenozoic bathyal and abyssal calcareous benthic foraminiferal zonations. Micropaleontology, 35:308–320.
Cande, S.C., and Kent, D.V., 1995. Revised calibration of the geomagnetic polarity timescale for the Late Cretaceous and Cenozoic. J. Geophys. Res., 100:6093–6095. Cande, S.C., LaBrecque, J.L., Larson, R.L., Pitmann, W.C., III, Golovchenko, X., and
Haxby, W.F., 1989. Magnetic Lineations of the World’s Ocean Basins. AAPG Map Ser., 13.
Engebretson, D.C., Cox, A., and Gordon, R.G., 1985. Relative Motions Between Oceanic and Continental Plates in the Pacific Basin. Spec. Pap.—Geol. Soc. Am., 206.
Gripp, A.E., and Gordon, R.G., 1990. Current plate velocities relative to the hotspots incorporating the NUVEL-1 global plate motion model. Geophys. Res. Lett.,
17:1109–1112.
Janecek, T.R., and Rea, D.K., 1983. Eolian deposition in the northeast Pacific Ocean: Cenozoic history of atmospheric circulation. Geol. Soc. Am. Bull., 94:730–738. Kyte, F.T., Leinen, M., Heath, G.R., and Zhou, L., 1993. Cenozoic sedimentation
his-tory of the central North Pacific: inferences from the elemental geochemistry of Core LL44-GPC3. Geochim. Cosmochim. Acta, 57:17