Explanatory Value and Probabilistic Reasoning
Matteo Colombo∗ Leandra Bucher† Marie Postma‡ Jan Sprenger§
Wednesday 25th March, 2015
Abstract
The question of how judgments of explanatory value (should) in-form probabilistic inference is well studied within psychology and philosophy. Less studied are the questions: How does probabilis-tic information affect judgments of explanatory value? Does prob-abilistic information take precedence over causal information in de-termining explanatory judgments? To answer these questions, we conducted two experimental studies. In Study 1, we found that probabilistic information had a negligible impact on explanatory judgments of event-types with a potentially unlimited number of available, alternative explanations; causal credibility was the main determinant of explanatory value. In Study 2, we found that, for event-token explanations with a definite set of candidate alternatives, probabilistic information strongly affected judgments of explanatory value. In the light of these findings, we reassess under which circum-stances explanatory inference is probabilistically sound.
∗Tilburg Center for Logic and Philosophy of Science (TiLPS), Tilburg University, P.O.
Box 90153, 5000 LE Tilburg, The Netherlands. Email: [email protected]
†Fachgebiet Psychologie, Justus-Liebig-Universität Gießen, Ludwigstraße 23, 35390
Gießen, Germany. Email: [email protected].
‡Tilburg Center for Communication and Cognition (TiCC), Tilburg University, P.O. Box
90153, 5000 LE Tilburg, The Netherlands. Email: [email protected]
§Tilburg Center for Logic and Philosophy of Science (TiLPS), Tilburg University, P.O.
1
Introduction
Giving explanations and reasoning with them play crucial roles in
hu-man cognition. Explanatory considerations are essential for abduction, a
mode of reasoning where a hypothesis is inferred based on its power to explain a given body of evidence (Peirce 1931-1935; Harman 1965; Joseph-son and JosephJoseph-son 1996; Magnani 2001; Thagard 2007; Douven 2011). Good explanations guide scientific reasoning, inform probabilistic infer-ence, and produce a sense of understanding (e.g., Van Fraassen 1980; Keil and Wilson 2000; Lipton 2004; De Regt and Dieks 2005; Keil 2006; Strevens 2008). Explanatory factors can also constrain causal learning and inference (Halpern and Pearl 2001; Woodward 2003; Lombrozo 2011, 2012).
Despite this impressive body of research, little is known about what determines the explanatory value of a given hypothesis. Lipton (2004) associates explanatory value with causality, and suggests that explanatory
valueguidesprobabilistic inference in both everyday and scientific contexts
(see also Okasha 2000; Weisberg 2009; Henderson 2014). Psychological ev-idence is consistent with Lipton’s suggestion, indicating that explanatory considerations, such as simplicity and coherence, can boost an explana-tion’s perceived probability (Thagard 1989; Koehler 1991; Sloman 1994; Lombrozo 2007). Lipton, however, does not clarify whether probabilistic information (should) affect explanatory value; and available psychological evidence does not address this issue either.
Several philosophers have appealed to probabilistic considerations to characterise the nature and quality of an explanation. This is first touched upon in Carl G. Hempel (1965)’s inductive-statistical model of explana-tion, Peter Railton (1979)’s account of probabilistic explanaexplana-tion, and Wes-ley Salmon (1971/84)’s statistical-relevance model. In these models of ex-planation, the hypothesis that does the explaining (the explanans) ought to be statistically relevant for the phenomenon to be explained (the explanan-dum). More recently, inspired by work of Popper (1934/2002) and Good (1960), McGrew (2003), Schupbach and Sprenger (2011), and Crupi and Tentori (2012) developed probabilistic measures of explanatory power and used them to compare the quality of statistical explanations (e.g., Schup-bach 2011a,b). Similar work has been carried out by Halpern and Pearl (2001), who used structural equations to define causal explanation, and probability to define a measure of explanatory power.
plausibly taps into distinct sources of information, including causal and probabilistic information (Lombrozo 2012). Anticipating this idea, Wesley Salmon characterized scientific explanation as “a two-tiered structure con-sisting of statistical relevance relations on one level and causal processes and interactions on the other” (Salmon 1997, 475–476). From this per-spective, explanatory value depends on the joint contribution of statistical relevance and causality, which has also been stressed in the literature on probabilistic causation (for a survey, see Hitchcock 2010).
The present paper tests Salmon’s hypothesis: it investigates whether and under which circumstances judgments of explanatory value are asso-ciated with probabilistic and causal characteristics of the potential expla-nation. A similar methodology has been applied for studying the extent to which confirmation judgments are determined by probabilistic infor-mation (Tentori et al. 2007a,b).
We conducted two experimental studies. In both studies, participants read vignettes where we provided statistical and causal information about the relation between an explanandum and a potential explanatory hypoth-esis. Participants were asked to judge the quality of the putative expla-nations and to judge along related cognitive dimensions, such as causal relevance, plausibility, and degree of confirmation.
In thefirst study, we examined generic explanations of event-types in
vignettes where alternative explanations could easily come to mind. We tested three hypotheses:
(1A) that judgments of explanatory value were reliably predicted by the prior subjective credibility of the candidate explanation;
(1B) that judgments of explanatory power were sensitive to the causal priming of the vignettes;
(1C) that judgments of explanatory value were predicted by the degree of statistical relevance of the putative explanans for the explanandum.
In the second study, we examined singular explanations for
event-tokens in vignettes where exactly one alternative explanation was pro-vided and no other alternative explanation could easily come to mind. We tested three hypotheses:
(2B) that judgments of explanatory value were positively associated with the perceived causal and cognitive salience of the target hypothesis;
(2C) that judgments of explanatory value were positively affected by sta-tistical relevance.
Results from the first study showed thatfor generic explanations of
event-types, prior credibility of the hypothesis and causal priming both raised the explanatory value of the hypothesis. Statistical relevance relations had a negligible impact on explanatory value, yielding to causal credibility as the main determinant of explanatory value. Results from the second study
provided evidence thatfor explanations of singular events, judgments of
ex-planatory value were highly sensitive to relations of statistical relevance, and were dissociable from posterior probabilities and other indicators of the rational acceptability of the explanatory hypothesis.
In sum, all above hypotheses, apart from (1C), were confirmed by our results.
Collectively, these findings support the hypothesis that explanation is a complex structure that taps into distinct types of sources of informa-tion in different contexts. Specifically, our findings indicate that two dif-ferent kinds of probabilistic cues—the credibility of the explanation and the statistical relevance for the explanandum–—contribute to explanatory value, albeit in different circumstances. The level of generality of the ex-planation (and the explanandum) makes a crucial difference: For generic (type) explanations, the prior credibility, but not the statistical relevance boosts explanatory value. For singular (token) explanations, explanatory value co-varies with statistical relevance, but not with prior credibility. In the light of these results, attempts to find a probabilistically coherent and descriptively adequate logic of abductive/explanatory reasoning may be doomed, due to the radically different way that people react to probabilis-tic cues in different contexts.
The rest of the paper is structured as follows. Section Section 2 and 3 present our two experiments. Section 4 puts the results into a broader perspective and discusses, inter alia, the implications for quantitative ap-proaches to explanatory power and broader consequences for theories of explanatory reasoning.
2
Experiment 1: Credibility and Causal Priming
age 28.61 years, SD = 10.74) volunteered to take part in the pre-study and rated individually 14 empirically testable causal hypotheses with respect to their credibility on a 5-point scale. The four lowest and highest rated hypotheses were selected for the incredible/credible report condition of this study.
2.1 Experiment and Methods
Our first experiment was conducted online, using the Amazon Mechanical
Turk (MTurk, www.mturk.com). Instructions and material were presented
in English language.
Participants
Two hundred thirty-seven participants (mean age 31.86 years; SD = 10.41; 144 male, 161 native speakers of English and 76 speakers of other lan-guages) completed Experiment 1 for a small monetary payment.
Design and Material
Eight short reports about fictitious research studies on different topics were created, using LimeSurvey 1.85 to run the online experiment via MTurk, and to record the data. Presentation order of the short reports was randomized for each participant.
Each report described a fictitious research study, where a “treatment group” (explanans present) and a “control group” (explanans absent) were contrasted. Information about the statistical relevance of the explanans on the explanandum was provided. The reports varied in the use of explicit causal language. Here is an example:
Drinking coffee causes high blood pressure
study therefore supports the hypothesis that drinking several cups of coffee a day causes high blood pressure.
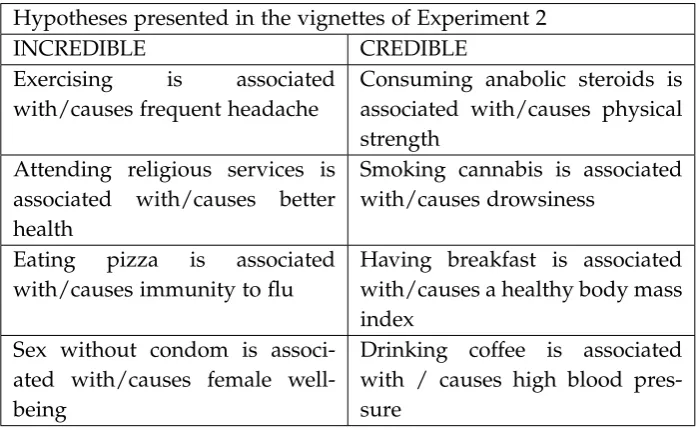
The vignette was, in a within-subjects design, varied in three dimen-sions, corresponding to three independent variables. Table 1 provides an overview of the hypotheses used in the experiment and the exact phrasing we used.
IV 1: Credibility The credibility of an hypothesis, with the two levels “in-credible” and ““in-credible”.
IV 2: Causal Priming The phrasing of the hypotheses, with the condition “on”, using the wording “X causes Y”, and the condition “off”, with the wording “X is associated with Y”.
IV 3: Statistical Relevance The relative frequency of the explanandum, given absence and presence of the putative explanans. There were two conditions: “big difference” (e.g., 48% vs. 13%) and “small dif-ference” (e.g., 25% vs. 22%).
The experiment was based on a 2×2×2 = 8 within-subject design,
with the factors Credability (credible, incredible), Causal Priming (on, off), and Statistical Relevance (big, small). The allocation of causal and non-causal frames and the allocation of small and big effect size to the individ-ual reports was counter-balanced across the participants.
Procedure
Participants were asked to carefully assess each report along four dimen-sions (construct names were not revealed to the participants):
Causal Relevance “There is a causal relation between X [the explanans of the respective hypothesis] and Y.”
Plausibility “The hypothesis is plausible, given the results of the study.”
Confirmation “This study provides strong evidence for the hypothesis.”
Explanatory Power “The hypothesis investigated by the researchers is a good explanation of the results of this study.”
2004). Participants’ judgments were collected using a 7-point scale with the extremes (1) “I strongly disagree” and (7) “I strongly agree”. An “I don’t know” option could also be selected.
Hypotheses presented in the vignettes of Experiment 2
INCREDIBLE CREDIBLE
Exercising is associated
with/causes frequent headache
Consuming anabolic steroids is associated with/causes physical strength
Attending religious services is
associated with/causes better
health
Smoking cannabis is associated with/causes drowsiness
Eating pizza is associated
with/causes immunity to flu
Having breakfast is associated with/causes a healthy body mass index
Sex without condom is associ-ated with/causes female well-being
Drinking coffee is associated with / causes high blood pres-sure
Table 1: The hypotheses of Experiment 1, ordered according to credibility, for
both types of causal framing (off: “X is associated with Y”; on:“X causes Y”).
2.2 Results
The participants’ ratings were submitted to an ANOVA with the factors Credibility (incredible, credible), Causal Priming (off, on), Statistical Rel-evance (small, big), and Construct (Causal RelRel-evance, Plausibility, Confir-mation, Explanatory Power).
ANOVA revealed main effects of Credibility (F(1, 236) = 121.728; p<
.001; η2part = .340), Causal Priming (F(1, 236) = 65.184; p < .001; η2part =
.216), and Construct (F(3, 234) = 6.98; p < .001; η2part = .029). We also
observed interactions between Credibility× Causal Priming (F(1, 236) =
14.265; p < .001; η2part = .057) and Credibility × Construct (F(3, 234) =
5.74; p = .001; η2part = .024). The interaction between Credibility and
Statistical Relevance was marginally significant (F(1, 236) =3.461;p=.64;
η2part = .014). There was no main effect of Statistical Relevance (p > .25),
nor any three-or four-way-interaction (allp’s>.35).
Pairwise comparisons showed that incredible reports were rated signif-icantly lower than credible reports, whether causally primed or not
Credibility Causal Priming Incredible Credible
Off M = 3.87 (.12) M = 4.74 (.92)
On M = 4.14 (.12) M = 5.32 (.78)
Statistical Relevance
Small M = 4.07 (.12) M = 5.03 (.008)
Big M = 3.94 (.12) M = 5.08 (.08)
Table 2: Marginal means and SE of the participants’ ratings as a function of
Credibility and Causal Priming, and Credibility and Statistical Relevance. Stan-dard Error is given in parentheses.
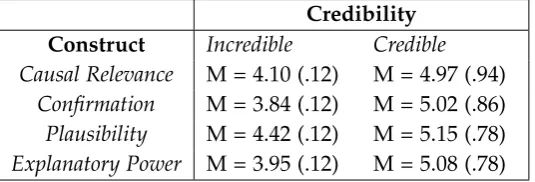
Credibility Construct Incredible Credible Causal Relevance M = 4.10 (.12) M = 4.97 (.94)
Confirmation M = 3.84 (.12) M = 5.02 (.86) Plausibility M = 4.42 (.12) M = 5.15 (.78) Explanatory Power M = 3.95 (.12) M = 5.08 (.78)
Table 3: Marginal means and SE of the four response variables (Causal
Rele-vance, Confirmation, Plausibility, Explanatory Power) as a function of Credibility (N=236).
Causally primed reports, whether credible or incredible, were rated higher
than causally non-primed reports (incredible: t(236) = −4.047; p < .001;
credible: t(236) = −7.818; p < .001). Pairwise comparisons also showed
that incredible reports were rated significantly lower than credible re-ports, whether statistical relevance was small or big (small relevance:
t(236) = −8.92; p < .001; big relevance: t(236) = −10.922; p < .001).
See Table 2 for the descriptives. Finally, for each construct (Plausibility etc.), incredible reports were rated significantly lower than credible reports
(Plausibility: t(236) = −9.579;p < .001; Confirmation: t(236) = −10.63;
p < .001; Explanatory Power: t(236) = −10.976; p < .001; and Causal
Relevance: t(236) =−8.19; p<.001). See Table 3 for the descriptives.
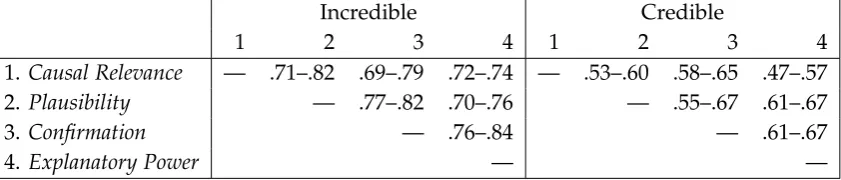
understanding of the four different constructs, we examined the correla-tions between the constructs, separately for both levels of Credibility. The results are summarized in table 4.
Incredible Credible
1 2 3 4 1 2 3 4
1. Causal Relevance — .71–.82 .69–.79 .72–.74 — .53–.60 .58–.65 .47–.57 2. Plausibility — .77–.82 .70–.76 — .55–.67 .61–.67
3. Confirmation — .76–.84 — .61–.67
4. Explanatory Power — —
Table 4: Zero-order correlations for 4 items in the incredible report condition
(N = 237, left table) and the credible report condition (N= 237, right table). All correlations were significant withp<.001.
Correlations between the constructs were very high for incredible re-ports. They ranged from .69 to .84 while for credible report, the corre-lations were lower, ranging from .47 to .67. This indicates that the cor-relations between the constructs, and thus the perceived similarity and dissimilarity of the four constructs, was modulated by the experimental manipulation and especially by the credibility of the reports. Participants treated the four dependent variables (constructs) more similarly for in-credible than for in-credible hypotheses. This shows that participants only distinguished between cognitive virtues of a hypothesis when a basic level of credibility was achieved.
3
Experiment 2: Explanatory Power
3.1 Experiment and Methods
Our second experiment consisted of an online questionnaire, conducted via the LimeSurvey environment. The participants for our study were un-dergraduate students of Tilburg University from the School of Economics and Management and the School of Social and Behavioral Sciences. They were recruited via emails from a teacher of one of their classes. Incentives were provided in terms of points for the final exam and a prize lottery.
The respondents of the survey were 744 students, of which 671
com-pleted the questionnaire (383 male, Mage = 21.5 (SD = 2.3)). They were
Design and Material
Participants were presented with an experimental vignette where two pos-sible events were related to two pospos-sible explanations for that event:
Vignette 1: There are two urns on the table. Urn A contains 67% white and 33% black balls, Urn B contains only white balls. One of these urns is selected. You don’t know which urn is selected, but you know that the chance that Urn A is selected is 25%, and that the chance that Urn B is selected is 75%. From the selected urn a white ball is taken at random.
Please now consider the hypothesis that Urn A has been chosen.
The participants were then asked to assess the following seven items (the construct names in italics were not provided to the participants) on a Likert scale ranking from 1 (“do not agree at all”) to 7 (“fully agree”):
Logical Implication The hypothesis logically implies that a white ball has been taken out.
Causal Relevance The hypothesis specifies the cause that a white ball has been taken out.
Confirmation The hypothesis is confirmed by a white ball has been taken out.
Posterior Probability The hypothesis is probable given that a white ball has been taken out.
Explanatory Power The hypothesis explains that a white ball has been taken out.
Understanding The hypothesis provides understanding why a white ball has been taken out.
Truth The hypothesis is true.
The choice of these seven items was motivated by the crucial role that concepts such as logical implication, causality and confirmation play in reasoning about candidate explanations, according to different philosoph-ical accounts of explanatory value (Hempel 1965; Salmon 1997; Woodward 2003; Schupbach and Sprenger 2011).
IV 1: Statistical Relevance The degree of statistical relevance between the explanans and the explanandum, with four values ranging from “strong disconfirm” to “strong confirm”.
IV 2: Prior Probability The prior probability of the hypothesis under con-sideration (.25, .5, or .75).
All possible 4×3 = 12 combinations of the values of these variables
were realized in the experiment. Statistical relevance was manipulated by changing the color of the ball drawn from the urn or by changing the explanatory hypothesis (from Urn A to Urn B).
To increase the ecological validity of our experiments, we also set up two other vignettes that are closer to cases of ordinary reasoning, and repeated the experiment for these vignettes. See Appendix.
Procedure
Participants completed the questionnaire on a university PC or their own computer in the digital environment of LimeSurvey installed on a local server. The use of LimeSurvey guaranteed that the data could be protected and provided with a time stamp and information about the IP address of the respondent. The experiment was self-paced and took approximately 10 minutes to complete. In total, the experiment thus contained 36 cells, corresponding to twelve different combinations of the values of the inde-pendent variables times three different scenarios.
3.2 Results
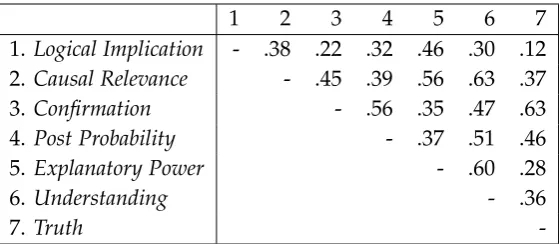
Prior to the analysis of the effects of vignette manipulation, we explored the interdependencies of the seven items in the response questionnaire. To recall, the participants were asked to judge several aspects of the hypoth-esis with respect to the evidence: logical implication, causal relevance, ex-planatory power, increase in understanding, confirmation, posterior prob-ability and truth. By analyzing the interdependencies with the help of the Pearson zero-order correlation coefficient, we determined whether the participants clearly separated these seven concepts, or whether some of them could be identified with each other.
1 2 3 4 5 6 7 1. Logical Implication - .38 .22 .32 .46 .30 .12 2. Causal Relevance - .45 .39 .56 .63 .37 3. Confirmation - .56 .35 .47 .63 4. Post Probability - .37 .51 .46 5. Explanatory Power - .60 .28
6. Understanding - .36
7. Truth
-Table 5: Zero-order correlations for 7 items (N= 671), all correlations with p<
.01.
concepts (e.g., causal relevance, explanatory power) with each other, which would be reflected in correlation coefficients of greater than .7. At the same time, the response variables were sufficiently related to each other to motivate a Principal Component Analysis: that is, a decomposition of the seven response variables into 2-4 constructs that explain together most of the variation in the data.
Principal Component Analysis
The factorability of the 7 items was examined with a Principle Compo-nent Analysis (PCA). The Kaiser-Meyer-Olkin measure of sampling
ade-quacy was .82 and the Bartlett’s test of sphericity was significant (χ2(21)
= 1790.77, p < .0001). The initial eigenvalues showed 51% of variance
plained by the first factor, 16% explained by the second factor, and 10% ex-plained by the third factor. A visual inspection of the scree plot revealed a ’leveling off’ of eigenvalues after the three factors, therefore, a three factor solution using the oblique rotation was conducted, with the three factors explaining 77% of the variance. All items had primary loadings over .7, viz. Table 6, which presents the factor loading matrix (loadings under .30 suppressed). In the remainder, we will restrict our analysis to these three factors.
The names for these factors are derived from the clustering that Table
6 indicates. Factor 1, Cognitive Salience, clusters explanatory power
to-gether with cognitive values that are often seen as related, such as causal coherence and enhancement of understanding (De Regt and Dieks 2005;
Strevens 2008). Factor 2,Rational Acceptability, captures those cognitive
correla-Cognitive Salience
Rational Acceptability
Entailment Communality
Logical Implication .94 .94
Causal Relevance .86 .74
Confirmation -.84 .77
Post Probability -.72 .67
Explanatory Power .81 .73
Understanding .87 .78
Truth -.88 .75
Table 6: Factor loadings and communalities based on a principle component
analysis with oblimin rotation for 7 items (N= 671).
tions between these values are not surprising: confirmation raises poste-rior probability, which is in turn an indicator of the truth of a theory (e.g., Howson and Urbach 2006). Finally, Factor 3 captures the strength of the logical relation between hypothesis and evidence. Since no other response
variable is loaded on this factor, it figures asEntailment, showing the link
to the response variable Logical Implication.1
Tests of Experimental Manipulation
We conducted two analyses of variance (ANOVAs) to test the effects of the independent variables, Statistical Relevance and Prior Probability, on
Cognitive Salience, Rational Acceptability and Entailment, respectively.2
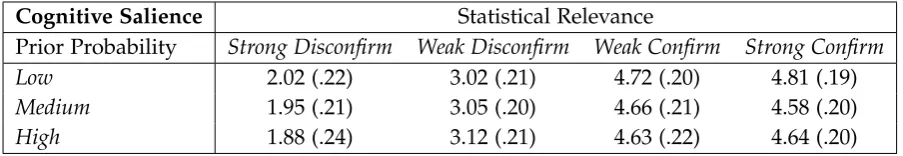
First, we tested the effects of the experimental manipulation on
Cog-nitive Salience. There was a significant main effect of Statistical Relevance, F(3, 659) = 118.53, p < .001, η2p = .35, but no effect of Prior Probability, F(2, 659) = 0.20, p = .822. There was no interaction effect between Statis-tical Relevance andPrior Probability, F(6, 659) = 0.12, p = .994 – see Table
1The internal consistency for two of the three scales (the third scale only consisted of
one item) was examined using Cronbach’s alpha, resulting in alpha .82 for Factor 1 and .79 for Factor 2. Composite scores were calculated for each of the three factors using the mean of the items with primary loadings on each factor. The descriptive values for the newly constructed scales wereM= 3.65,SD= 1.91 for Explanatory Value,M= 3.63,SD= 1.87 for Rational Acceptability, andM= 3.75,SD= 2.40 for Logical Implication.
2A prior analysis of the effect of the vignette on the three dependent variables revealed
Cognitive Salience Statistical Relevance
Prior Probability Strong Disconfirm Weak Disconfirm Weak Confirm Strong Confirm
Low 2.02 (.22) 3.02 (.21) 4.72 (.20) 4.81 (.19)
Medium 1.95 (.21) 3.05 (.20) 4.66 (.21) 4.58 (.20)
High 1.88 (.24) 3.12 (.21) 4.63 (.22) 4.64 (.20)
Table 7: Estimated Marginal Means and SE of Cognitive Salience by Statistical
Relevance and Prior Probability (N= 671).
7 for the descriptives. A pair-wise comparison with Bonferroni correction
of the levels ofStatistical Relevanceshowed a significant difference between
all levels (p< .001), with the exception of Weak and Strong Confirm.
Second, we examined the effects of the experimental manipulation on Rational Acceptability. There was again a significant main effect ofStatistical Relevance,F(3, 659) = 223.76,p<.001,η2p=.51, but no effect ofPrior Prob-ability, F(2, 659) = 1.68, p =.188. There was no interaction effect between Statistical Relevance and Prior Probability, F(6, 659) = 0.81, p = .463 – see Table 8 for the descriptives. A pair-wise comparison with Bonferroni
cor-rection of the levels ofStatistical Relevance showed a significant difference
between all levels (p< .001), with the exception of Weak Disconfirmation
and Weak Confirmation (p=.005).
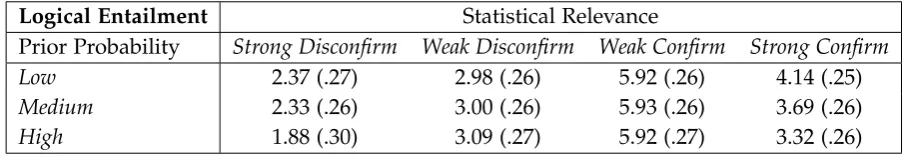
Finally, we analyzed the effects of the experimental manipulation on Entailment. Similarly to the previous two dependent variables, there was
again a significant main effect ofStatistical Relevance, F(3, 659) = 105.40, p
< .001, η2p = .32, but no effect of Prior Probability, F(2, 659) = 1.23, p =
.292. There was no interaction effect betweenStatistical RelevanceandPrior
Probability, F(6, 659) = 0.76, p = .598 – see Table 9 for the descriptives. A
pair-wise comparison with Bonferroni correction of the levels ofStatistical
Relevance showed a significant difference between all degrees (p < .001)
with the exception of Weak Confirm and Weak Disconfirm (p = .007).
Rational Acceptability Statistical Relevance
Prior Probability Strong Disconfirm Weak Disconfirm Weak Confirm Strong Confirm
Low 1.93 (.18) 2.93 (.18) 3.45 (.17) 5.39 (.16)
Medium 2.05 (.18) 3.10 (.17) 3.74 (.18) 5.62 (.17)
High 1.95 (.20) 3.20 (.18) 3.48 (.18) 5.82 (.17)
Table 8: Estimated Marginal Means and SE of Rational Acceptability by
Statisti-cal Relevance and Prior Probability (N= 671).
Logical Entailment Statistical Relevance
Prior Probability Strong Disconfirm Weak Disconfirm Weak Confirm Strong Confirm
Low 2.37 (.27) 2.98 (.26) 5.92 (.26) 4.14 (.25)
Medium 2.33 (.26) 3.00 (.26) 5.93 (.26) 3.69 (.26)
High 1.88 (.30) 3.09 (.27) 5.92 (.27) 3.32 (.26)
Table 9:Estimated Marginal Means and SE of Entailment by Statistical Relevance
and Prior Probability (N= 671).
4
Discussion
To investigate the impact of causal and probabilistic information on ex-planatory judgment, we conducted two experiments where participants were presented with fictitious vignettes and asked to rate a given hypoth-esis along various dimensions, e.g., its explanatory value, its plausibility, its causal saliency, the sense of understanding it confers, etc.
In the first experiment, participants were presented with hypotheses that could causally explain familiar types of phenomena (e.g., “eating pizza causes/is associated with immunity to flu” vs. “consuming anabolic steroids is causes/associated with physical strength”). Explanations dif-fered in their degree of subjective prior credibility, and were presented in the form of research reports. The reports also differed in the explicit use of causal language as well as in the degree of statistical relevance between explanans and explanandum.
credible causal hypothesis, the explicit use of causal language led to a much more coherent (and explanatorily valuable) picture than for an im-plausible causal hypothesis. Both main effects and the interaction effect underline the importance of causal information for generic explanatory judgments.
In the second experiment, participants were asked to judge token-explanations of singular events. We observed a clear distinction between judgments of explanatory value and (objective) posterior probabilities. More generally, participants’ judgments on the seven response variables
were aligned along three dimensions: Cognitive Salience (primarily loaded
with the response variables Causality, Explanatory Value and
Understand-ing),Rational Acceptability(Posterior Probability, Confirmation and Truth)
andEntailment (Logical Implication). On the one hand, this finding sub-stantiates the conjecture from previous literature about the existence of a tight connection between explanatory value, causality and a sense of un-derstanding (Lipton 2004; Keil 2006; Lombrozo 2007; Trout 2007). On the other hand, it indicates that folk reasoning about potential explanations can neatly distinguish between the concepts of Rational Acceptability and Cognitive Salience of a hypothesis, as we hypothesized.
Participants’ judgments on the three main factors we identified— Cognitive Salience, Rational Acceptability, and Logical Implication—were strongly affected by changes in statistical relevance, specifically by manip-ulations of the likelihood of the target hypothesis. Instead, the prior prob-abilities of the candidate explanatory hypothesis, presented as objective base rates, affected participants’ judgments in none of those three factors. These results demonstrate that in situations where causal detail is kept sparse and the explanandum corresponds to a singular token-event, ex-planatory judgment is heavily affected by information about probabilistic relations between hypothesis and evidence.
relevance, but not with the prior credibility of the explanatory hypothesis. While these findings confirm and refine conjectures made in the theoretical literature on explanation (Salmon 1984), they call for a re-assessment of the rationality of abduction (e.g., Okasha 2000; Lipton 2004): when explanatory value is insensitive to the prior credibility of the ex-planans, abductive inference will not track posterior probabilities and
may lead to probabilistically incoherent judgments. Logics of
abduc-tive/explanatory inference that have ambitions to be descriptively
ade-quate need to take into account the context-sensitivity of people’s
ex-planatory reasoning. Pluralism about the nature of exex-planatory reasoning may become more attractive as a result.
The result also demonstrate the fruitfulness of recent theoretical work that explicates explanatory power in probabilistic terms (Schupbach and Sprenger 2011; Crupi and Tentori 2012). Finally, discovering the hitherto unknown difference between singular and generic explanatory reasoning opens the way for further work on matching explanatory with causal and probabilistic reasoning (e.g., regarding the analogous difference between generic and singular causation).
We hope that our contribution will stimulate further research on the nature of explanation. In particular, we hope that our results will help to promote “the prospects for a naturalized philosophy of explanation” (Lombrozo 2011, 549), where philosophical theorizing about the nature of explanation is constrained and informed by empirical evidence about the psychology of explanatory value.
Experimental Material for Experiment 2
Apart from Vignette 1 (the urn scenario), we used the following vignettes and varied them in the dimensions of Statistical Relevance and Prior Prob-ability:
still unable to play football.
Please now consider the hypothesis that Ruud has chosen for the con-servative treatment.
Vignette 3:Louise arrives by train in Twin City. Twin city has two districts: West Bank and East Bank. In West Bank, there is only one taxi company, namely Green Taxi Ltd., and all their cabs are green. Green Taxi Ltd. also owns 67% of all cabs in East Bank. The other cabs in East Bank are owned by The Red Taxi Inc., all their cabs are red. Louise does not know which part of the city the train is entering, but judging from her knowledge of Twin City she assumes that there is a 75% chance that she is in West Bank (and a chance of 25% that she is in East Bank). At some point, Louise sees a green cab from the train.
Please now consider the hypothesis that Louise is in East Bank.
References
Boyd, R. N. (1983). On the Current Status of the Issue of Scientific Realism. Erkenntnis19: 45–90.
Crupi, V. (2012). An argument for not equating confirmation and
explana-tory power.The Reasoner6: 39–40.
Crupi, V. & Tentori, K. (2012). A second look at the logic of explanatory
power (with two novel representation theorems).Philosophy of Science79,
365–385.
Crupi, V., Tentori, K., and González, M. (2007). On Bayesian Measures
of Evidential Support: Theoretical and Empirical Issues. Philosophy of
Science74: 229–252.
De Regt, H., and Dieks, D. (2005). A Contextual Approach to Scientific
Understanding.Synthese144: 137–170.
Douven, I. (2011): Abduction. In: Stanford Encyclopedia of Philosophy, ed. E.
Zalta,http://plato.stanford.edu/entries/abduction/.
Friedman, M. (1974). Explanation and Scientific Understanding.Journal of
Philosophy71: 5–19.
Good, I. J. (1960). Weight of Evidence, Corroboration, Explanatory Power,
Information and the Utility of Experiments.Journal of the Royal Statistical
Halpern, J., and Pearl, J. (2001). Causes and Explanations: A Structural-Model Approach. Part II: Explanations. In: Proceedings of the 17th In-ternational Joint Conference on Artificial Intelligence (IJCAI). San Fran-cisco/CA: Morgan Kaufmann.
Hartmann, S., and Sprenger, J. (2010). Bayesian Epistemology. In D.
Pritchard (ed.): Routledge Companion to Epistemology, 609–620. London:
Routledge.
Harman, G. (1965). The Inference to the Best Explanation. Philosophical
Review74: 88-95.
Hempel, C. G. (1965).Aspects of Scientific Explanation and Other Essays in the
Philosophy of Science. New York: Free Press.
Henderson, L. (2014). Bayesianism and Inference to the Best
Expla-nation. British Journal for the Philosophy of Science, Online First doi:
10.1093/bjps/axt020.
Hitchcock, C. (2010): Probabilistic causation. In: Stanford
Encyclope-dia of Philosophy, ed. E. Zalta, http://plato.stanford.edu/entries/
probabilistic-causation/.
Howson, C. and Urbach, P. (2006): Scientific Reasoning: The Bayesian
Ap-proach, 3rd edition. La Salle: Open Court.
Josephson, J. R., & Josephson, S. G. (1996): (1996).Abductive inference:
Com-putation, philosophy, technology. Cambridge: Cambridge University Press.
Keil, F. C. (2006). Explanation and understanding. Annual Review of
Psy-chology57: 227-254.
Keil, F. C., & Wilson, R. A. (2000).Explanation and Cognition. Cambridge,
MA: MIT Press.
Kitcher, P. (1981). Explanatory Unification. Philosophy of Science 48: 507–
531.
Koehler, D. J. (1991). Explanation, Imagination, and Confidence in
Judg-ment.Psychological Bulletin110: 499–519.
Lewis, D. (1986). Causal explanation. In Philosophical Papers, Volume II, pp. 214–240. New York: Oxford University Press.
Lewis, D. (1999):Papers in Metaphysics and Epistemology. Cambridge:
Lipton, P. (2001). What Good is an Explanation? In G. Hon & S. Rackover
(eds.),Explanation: Theoretical Approaches, 43–59. Dordrecht: Kluwer.
Lipton, P. (2004).Inference to the Best Explanation(second edition). London:
Routledge.
Lombrozo, T. (2007). Simplicity and probability in causal explanation.
Cog-nitive Psychology55: 232–257.
Lombrozo, T. (2011). The instrumental value of explanations. Philosophy
Compass6: 539–551.
Lombrozo, T. (2012). Explanation and abductive inference. In K. J. Holyoak
& R. G. Morrison (eds.): Oxford Handbook of Thinking and Reasoning, 260–
276. Oxford, UK: Oxford University.
Machamer, P. K., Darden, L., and Craver, C.F. (2000). Thinking about
mech-anisms.Philosophy of Science67: 1-25
Magnani, L. (2001)Abduction, Reason, and Science. Processes of Discovery
and Explanation. Dordrecht, NL: Kluwer Academic Press.
McGrew, T. (2003). Confirmation, Heuristics, and Explanatory Reasoning. British Journal for the Philosophy of Science54: 553–567.
Oaksford, M., and Chater, N. (2007).Bayesian Rationality. Oxford: Oxford
University Press.
Okasha, S. (2000). Van Fraassen’s Critique of Inference to the Best
Expla-nation.Studies in History and Philosophy of Science31: 691–710.
Peirce, C. S. (1931-1935).The Collected Papers of Charles Sanders Peirce. Vol.
I-VI. Eds. C. Hartshorne and P. Weiss. Cambridge/MA: Harvard Uni-versity Press.
Popper, K. R. (1934/2002). Logik der Forschung. Berlin: Akademie Verlag.
Translated asThe Logic of Scientific Discovery. London: Routledge.
Psillos, S. (1999).Scientific Realism: How Science Tracks Truth. London:
Rout-ledge.
Railton, P. (1989). Explanation and metaphysical controversy. In P. Kitcher
& W. C. Salmon (eds.): Scientific explanation: Minnesota studies in the
Rozenblit, L., and Keil, F. (2002). The misunderstood limits of folk science:
an illusion of explanatory depth.Cognitive Science26: 521–562.
Salmon, W. (1971/1984). Statistical Explanation. Reprinted in Salmon
(1984): Scientific Explanation and the Causal Structure of the World, 29–
87. Princeton: Princeton University Press.
Salmon, W. (1997): Causality and Explanation: A Reply to Two Critiques. Philosophy of Science64: 461–77.
Schupbach J. (2011a).Studies in the Logic of Explanation. PhD Thesis,
Uni-versity of Pittsburgh.
Schupbach J. (2011b). Comparing Probabilistic Measures of Explanatory
Power.Philosophy of Science, 78: 813–829.
Schupbach, J., and Sprenger J. (2011). The Logic of Explanatory Power. Philosophy of Science78: 105–127.
Sloman, S. A. (1994). When explanations compete: The role of explanatory
coherence on judgments of likelihood.Cognition52: 1–21.
Strevens, M. (2008). Depth: An Account of Scientific Explanation.
Cam-bridge/MA: Harvard Unviersity Press.
Tentori, K., Crupi, V., Bonini, N., and Osherson, D. (2007a): Comparison
of confirmation measures.Cognition103: 107–119.
Tentori, K., Crupi, V., and Osherson, D. (2007b): Determinants of
confir-mation.Psychonomic Bulletin & Review14: 877–883.
Thagard, P. (1989). Explanatory Coherence.Behavioral and Brain Sciences12:
435–502.
Thagard, P. (2007). Abductive inference: From philosophical analysis to
neural mechanisms. In: Inductive reasoning: Experimental, developmental,
and computational approaches, 226–247.
Trout, J. D. (2002). Scientific Explanation and the Sense of Understanding. Philosophy of Science69: 212–233.
Trout, J. D. (2007). The Psychology of Scientific Explanation. Philosophy
Compass2: 564–591.
Van Fraassen, B. C. (1980).The Scientific Image. New York: Oxford
Van Fraassen, B. C. (1989).Laws and Symmetry. New York: Oxford Univer-sity Press.
Weisberg, J. (2009). Locating IBE in the Bayesian Framework.Synthese167:
125–143.
Woodward, J. (2003).Making Things Happen. New York: Oxford University